SECURITIES AND EXCHANGE COMMISSION
Washington, D.C. 20549
FORM 10-K
|
x
|
|
ANNUAL
REPORT PURSUANT TO SECTION 13 OR 15(d) OF THE SECURITIES
EXCHANGE ACT OF 1934
|
|
|
|
For the fiscal year ended December 31, 2006
|
|
|
|
OR
|
|
|
|
o
|
|
TRANSITION
REPORT PURSUANT TO SECTION 13 OR 15(d) OF THE SECURITIES EXCHANGE ACT OF 1934
|
Commission File Number 1-9977

(Exact Name of Registrant as Specified in its Charter)
|
Maryland
|
|
86-0611231
|
|
(State or Other
Jurisdiction of Incorporation or Organization)
|
|
(IRS Employer
Identification No.)
|
|
|
|
|
|
17851
North 85th Street, Suite 300, Scottsdale, Arizona
|
|
85255
|
|
(Address of
Principal Executive Offices)
|
|
(Zip Code)
|
(480) 515-8100
(Registrant’s telephone number, including area code)
Securities registered pursuant to Section 12(b) of the Act:
Common
Stock, $.01 par value New
York Stock Exchange
Securities registered pursuant to Section 12(g) of the
Act: None
Indicate by check mark if
the registrant is a well-known seasoned issuer, as defined in Rule 405 of the
Securities Act.
Yes x No o
Indicate by check mark if
the registrant is not required to file reports pursuant to Section 13 or
Section 15(d) of the Act.
Yes o No x
Indicate
by check mark whether the registrant: (1) has filed all reports required to be
filed by Section 13 or 15(d) of the Securities Exchange Act of 1934 during the
preceding 12 months (or for such shorter period that the registrant was
required to file such reports), and (2) has been subject to such filing
requirements for the past 90 days. Yes x No o
Indicate
by check mark if disclosure of delinquent filers pursuant to Item 405 of
Regulation S-K is not contained herein, and will not be contained, to the best
of registrant’s knowledge, in definitive proxy or information statements incorporated
by reference in Part III of this Form
10-K or any amendment to this Form 10-K. o
Indicate
by check mark whether the registrant is a large accelerated filer, an
accelerated filer, or a non-accelerated filer. See definition of “accelerated
filer and large accelerated filer” in Rule 12b-2 of the Exchange Act. (Check
one):
Large
accelerated filer x Accelerated
Filer o Non-accelerated
filer o
Indicate
by checkmark whether the registrant is a shell company (as defined in Rule
12b-2 of the Exchange Act).
Yes o No x
The
aggregate market value of common stock held by non-affiliates of the registrant
(26,074,616 shares) as of June 30, 2006, was $1,232,025,606, based on the
closing sales price per share as reported by the New York Stock Exchange on
such date.
The
number of shares outstanding of the registrant’s common stock on February 16,
2007 was 26,152,816.
DOCUMENTS INCORPORATED BY REFERENCE
Portions
from the registrant’s Proxy Statement relating to the Annual Meeting of
Stockholders to be held on May 16, 2007 have been incorporated by reference
into Part III, Items 10, 11, 12 , 13 and 14.
MERITAGE HOMES CORPORATION
FORM 10-K
TABLE OF CONTENTS
2
PART I
Item 1. Business
The Company
Meritage Homes is a leading designer and builder of
single-family attached and detached homes in the fast-growing southern and
western United States, based on the number of home closings. We offer a variety
of homes that are designed to appeal to a wide range of homebuyers, including
first-time, move-up, luxury and active adult buyers. We have operations in
three regions: West, Central and East,
which are comprised of 14 metropolitan areas in six states. These three regions are our principal
business segments. Please refer to Note
13 of the consolidated financial statements for information regarding our
operating and reporting segments.
Our homebuilding and marketing activities are
conducted under the name of Meritage Homes in each of our markets, except for
certain communities in Arizona, where we operate under the name of Monterey
Homes, and in Texas, where we operate in certain communities as Legacy Homes,
Meritage Homes and Monterey Homes. At December 31, 2006, we were actively
selling homes in 213 communities, with base prices ranging from approximately
$100,000 to $1,176,000.
Available Information; Corporate Governance
Meritage
Homes Corporation was incorporated in 1988 as a real estate investment trust in
the State of Maryland. At December 31, 1996, through a merger, we acquired the
homebuilding operations of our predecessor company. We currently focus
exclusively on homebuilding and related activities and no longer operate as a
real estate investment trust.
Information about our company and communities is
provided on our Internet website at www.meritagehomes.com.
Our periodic and current reports, including any amendments, filed or furnished
pursuant to section 13(a) or 15(d) of the Securities Exchange Act of 1934 (the “Exchange
Act”) are available, free of charge, on our website as soon as reasonably
practicable after they are electronically filed with or furnished to the
Securities and Exchange Commission (“SEC”). The information contained on our
website is not considered part of this annual report on Form 10-K.
Meritage operates within a comprehensive plan of corporate governance
for the purpose of defining responsibilities and setting high standards for
ethical conduct. Our Board of Directors has established an audit committee,
executive compensation committee and nominating/governance committee. The
charter of each of these committees is available on our website, along with our
Code of Ethics and our Corporate Governance Principles and Practices. Our
committee charters, Code of Ethics and Corporate Governance Principles and
Practices are also available in print, free of charge, to any stockholder who
requests any of them by calling us or by writing to us at our principal
executive offices at the following address:
Meritage Homes Corporation, 17851 North 85th Street, Suite 300, Scottsdale, Arizona 85255,
Attention: Legal Department. Our
telephone number is (480) 515-8100.
Competitive Strengths
We believe Meritage possesses the following
competitive strengths:
Conservative inventory management.
We seek to minimize land and inventory risk in order to optimize our use of
capital and maintain moderate leverage ratios. We accomplish this by:
· generally
purchasing land after full entitlements have been obtained, including zoning
and utility services;
· developing
smaller parcels, which generally consist of projects that can be completed
within a three- to four-year period;
· controlling
a significant portion of our land inventory through rolling options and land
purchase contracts with initial deposit requirements typically between 5% and
15% of the land price;
· managing
housing inventory by pre-selling and obtaining customer deposits on most of our
homes prior to starting construction;
3
· limiting
construction starts on unsold homes; and
· minimizing
home construction cycles.
Disciplined financial management. We
believe that our disciplined financial management policies enable us to achieve
above-average returns on assets compared to our competitors in the homebuilding
industry and to maintain reasonable leverage ratios. Our rigorous investment
requirements for our new communities, whether developed internally or acquired,
enable us to deploy capital efficiently and to generate strong cash flows to
fund the acquisition of additional land or homebuilding operations.
Margin focus. We believe that our
focus on achieving good margins results in greater profitability during strong
economic periods and also enables us to realize lower break-even points to
provide greater pricing flexibility during slower economic periods. In addition to
maintaining low overhead costs, we actively manage construction costs and
pricing and marketing strategies in order to maximize margins. We seek to
optimize our mix of available housing upgrades and customization features to
offer the highest value to customers at the lowest cost. Within our pricing
structure we provide our sales and marketing professionals with the autonomy
and flexibility to respond rapidly to changing market dynamics by customizing
our sales programs and customer incentives.
We believe these are some of the strategies that should help improve our
margins during the current housing downturn.
Experienced management team. Members of our senior management team have
extensive experience in the homebuilding industry as well as in-depth knowledge
of the markets that we serve. Our chief
executive officer and most of our senior executives have extensive homebuilding
experience, and have delivered successful results through varying homebuilding
cycles.
Product breadth and geographic diversity. We
believe that our product breadth and geographic diversity enhance our growth
potential and help to reduce exposure to any specific economic cycle. We tailor
our product offerings to local markets and changing demographics and customer
preferences. In most of our markets we typically focus on the first and
second-time move up markets. We also offer niche products in certain markets.
For example, in Arizona, Texas and California we build within the luxury
market; in California and Florida we build within the multi-story condo market
and in Arizona we build within the active adult market.
Business Strategies
We seek to distinguish ourselves from other production
homebuilders through the following business strategies:
Focus on high growth markets. Our operations are located in six rapidly growing western
and southern states: Texas, Arizona, California, Nevada, Colorado and Florida.
These areas are generally characterized by high job and population growth
trends, which have historically created strong demand for new housing, and we
believe these to be attractive homebuilding markets with opportunities for
long-term growth. Our operations in Texas, Arizona, California and Nevada are
well established and we believe that we have developed a reputation for
building distinctive quality homes within these markets.
Expand into new and within existing
markets. We continuously evaluate expansion opportunities
through strategic acquisitions of other homebuilders and internal growth
through expansion of our product offering in existing markets or start-up
operations in new geographic areas. In pursuing expansion, we explore markets
with demographic and other growth characteristics similar to our current
markets and seek to acquire entities with operating policies and
earnings-focused philosophies similar to ours. Within the last three years, we
began start-up operations in Denver, Colorado, Orlando, Florida and Reno,
Nevada, and acquired operations in Ft. Myers/Naples and Orlando, Florida, which
we believe are geographic markets that possess favorable long-term demographic
and growth characteristics.
In the past nine years we have successfully completed eight
acquisitions, enabling us to substantially increase our revenue and earnings,
expand our geographic footprint, increase our share of existing markets and
develop new product lines, such as active adult housing for the Arizona
retirement market and condominiums in certain markets.
Efficient cost structure. Throughout
our history, we have focused on minimizing construction costs and overhead,
which we believe are key factors in maintaining high margins and profitability.
We minimize costs and overhead by:
4
· using
subcontractors for home construction and site improvements on a fixed-price
basis;
· obtaining
favorable pricing from subcontractors through long-term relationships and high
volume;
· reducing
interest and carrying costs by minimizing our inventory of unsold homes and
minimizing the home construction cycle;
· delaying
construction on most homes until they are under contract, the buyers have paid
earnest money deposits (typically ranging from 2-5% and averaging 3.5%
year-end), and the buyers have obtained preliminary approval for a mortgage
loan;
· centralizing
certain administrative activities; and
· monitoring
homebuilding production, scheduling and budgeting through management
information systems.
Superior design, quality and customer service.
We seek to maximize customer satisfaction by offering homes that are built with
quality materials and craftsmanship, exhibit distinctive design features and
are situated in premium locations. We believe that we generally offer higher
quality homes in their defined price range or category compared to those built
by our competitors. In addition, we seek to achieve the highest level of
customer satisfaction as an integral part of our competitive strategy. For
example, as part of the sales process, our experienced sales personnel
continually inform customers of their home’s construction progress, and after
delivery, our customer care departments respond to homebuyers’ questions and
warranty matters.
Markets and Products
We currently build and sell homes in the following
markets:
|
Markets
|
|
Year Entered
|
|
|
Phoenix, AZ
|
|
1985
|
|
|
Dallas/Ft.
Worth, TX
|
|
1987
|
|
|
Austin, TX
|
|
1994
|
|
|
Tucson, AZ
|
|
1995
|
|
|
Houston, TX
|
|
1997
|
|
|
San Francisco
Bay Area, CA
|
|
1998
|
|
|
Sacramento, CA
|
|
1998
|
|
|
Las Vegas, NV
|
|
2002
|
|
|
San Antonio, TX
|
|
2003
|
|
|
Los Angeles
(Inland Empire), CA
|
|
2004
|
|
|
Denver, CO
|
|
2004
|
|
|
Orlando, FL
|
|
2004
|
|
|
Reno, NV
|
|
2005
|
|
|
Ft. Myers/Naples, FL
|
|
2005
|
|
The
chart above reflects the dates our predecessor companies entered our Texas and
Arizona markets.
Our homes range from entry level to semi-custom
luxury, with base prices ranging from approximately $100,000 to $1,176,000. A
summary of activity by region as of and for the year ended December 31, 2006,
follows (dollars in thousands):
5
|
|
|
Year Ended December 31, 2006
|
|
At December 31, 2006
|
|
|
|
|
# of
Homes
Closed
|
|
Avg.
Closing
Price
|
|
Homes
in
Backlog
|
|
$ Value of
Backlog
|
|
Home Sites
Controlled (1)
|
|
# of
Actively
Selling
Communities
|
|
|
West
Region
|
|
|
|
|
|
|
|
|
|
|
|
|
|
|
California
|
|
1,471
|
|
$
|
557.8
|
|
226
|
|
$
|
129,816
|
|
4,880
|
|
26
|
|
|
Nevada
|
|
620
|
|
394.1
|
|
57
|
|
21,725
|
|
2,393
|
|
5
|
|
|
West Region Total
|
|
2,091
|
|
509.3
|
|
283
|
|
151,541
|
|
7,273
|
|
31
|
|
|
|
|
|
|
|
|
|
|
|
|
|
|
|
|
|
Central
Region
|
|
|
|
|
|
|
|
|
|
|
|
|
|
|
Arizona
|
|
3,355
|
|
328.7
|
|
905
|
|
347,306
|
|
14,649
|
|
42
|
|
|
Texas
|
|
4,263
|
|
233.8
|
|
2,209
|
|
582,163
|
|
17,539
|
|
121
|
|
|
Colorado
|
|
112
|
|
365.0
|
|
45
|
|
18,783
|
|
817
|
|
6
|
|
|
Central Region Total
|
|
7,730
|
|
276.9
|
|
3,159
|
|
948,252
|
|
33,005
|
|
169
|
|
|
|
|
|
|
|
|
|
|
|
|
|
|
|
|
|
East
Region
|
|
|
|
|
|
|
|
|
|
|
|
|
|
|
Florida
|
|
666
|
|
359.0
|
|
243
|
|
100,268
|
|
3,797
|
|
13
|
|
|
|
|
|
|
|
|
|
|
|
|
|
|
|
|
|
Total
Company
|
|
10,487
|
|
$
|
328.4
|
|
3,685
|
|
$
|
1,200,061
|
|
44,075
|
|
213
|
|
(1) “Home Sites Controlled” is the
estimated number of homes that could be built on lots controlled by the
Company, both on lots available for sale and on land expected to be developed
into lots.
Land Acquisition and Development
Our goal is to maintain a four- to five-year lot
supply which we believe provides an appropriate planning horizon to address regulatory
matters and land development. We typically acquire land only after necessary entitlements
have been obtained so that development or construction may begin as market
conditions dictate. The term “entitlements” refers to development agreements
and tentative maps or recorded plats, depending on the jurisdiction within
which the land is located. Entitlements generally give the developer the right
to obtain building permits upon compliance with conditions that are ordinarily
within the developer’s control. Even though entitlements are usually obtained
before land is purchased, we are still required to secure a variety of other
governmental approvals and permits prior to and during development. The process
of obtaining such approvals and permits can substantially delay the development
process. We may consider, on a limited basis, purchasing unentitled property
when we can do so in a manner consistent with our business strategy. Although
historically we have generally developed parcels ranging from 100 to 300 lots,
in order to achieve and maintain an adequate inventory of lots, we also purchase
larger parcels, in many cases with joint venture partners. In some cases, these
joint ventures purchase undeveloped land and develop the land themselves.
We select land for development based upon a variety of
factors, including:
· demographic
factors, based on extensive internal and external marketing studies;
· suitability
for development generally within a one to four-year time period from the
beginning of the development process to the delivery of the last home;
· financial
feasibility of the proposed project, including projected profit margins,
returns on capital employed, and the capital payback period;
· the
ability to secure governmental approvals and entitlements;
· results
of environmental and legal due diligence;
· proximity
to local traffic corridors and amenities; and
· management’s
judgment as to the real estate market and economic trends, and our experience
in particular markets.
6
We acquire land through options and land purchase contracts. Purchases
are generally financed through our corporate borrowings or working capital.
Acquiring our land through option contracts allows us to control lots and land
through third parties who own or buy properties on which we plan to build
homes. We enter into option contracts to purchase finished lots at a certain
price during a specified period of time from these third parties as home
construction begins. These contracts are generally non-recourse and typically
require the payment of non-refundable deposits of 5% to 15% of the sales price.
At December 31, 2006, we had approximately $168.1 million in cash deposits and
$64.3 million in letters of credit deposits on real estate under option or
contract. The total value of land under option or contract at that time was
approximately $2.1 billion. We believe the use of options limits the market
risks associated with land ownership by allowing us to re-negotiate option
terms or terminate options in the event of declines in land value and/or market
downturns. As market conditions change,
we may attempt to re-negotiate the option or purchase contracts to achieve
terms that are more in line with market conditions. Such adjustments can include deferment or
reduction in lot takedown requirements or price concessions. If we are unsuccessful in these
re-negotiations, we may determine that a project is no longer feasible or
desirable and cancel these contracts, usually resulting in the forfeiture of
our option deposits. During 2006, we
terminated options on approximately 7,200 lots and wrote off option deposits
and pre-acquisition costs of $54.6 million.
Additional information relating to our lots and land under option is
presented in Note 3 – Variable Interest Entities and Consolidated Real Estate
Not Owned, in the accompanying consolidated financial statements.
Once we secure land, we generally initiate development
through contractual agreements with subcontractors. These activities include
site planning and engineering, as well as constructing road, sewer, water,
utilities, drainage, recreation facilities and other improvements and
refinements. We frequently build homes in master-planned communities with home
sites that are along or near a major amenity, such as a golf course.
We develop a design and marketing concept tailored to
each community, which includes the determination of size, style and price range
of homes. We also typically determine street layout, individual lot size and
layout, and overall community design for these projects. The product lines
offered depend upon many factors, including the housing generally available in
the area, the needs of a particular market, and our lot costs for the project;
though we are sometimes able to use standardized design plans for a product
line.
The following table presents information as of December 31, 2006
(dollars in thousands):
|
|
|
Number of
Lots Owned (1)
|
|
Number of
Lots Under Contract
or Option (1)(2)
|
|
Total Number
of Lots
Controlled
|
|
|
West
Region
|
|
|
|
|
|
|
|
|
California
|
|
955
|
|
3,925
|
|
4,880
|
|
|
Nevada
|
|
454
|
|
1,939
|
|
2,393
|
|
|
West Region Total
|
|
1,409
|
|
5,864
|
|
7,273
|
|
|
|
|
|
|
|
|
|
|
|
Central
Region
|
|
|
|
|
|
|
|
|
Arizona
|
|
1,885
|
|
12,764
|
|
14,649
|
|
|
Texas
|
|
3,802
|
|
13,737
|
|
17,539
|
|
|
Colorado
|
|
136
|
|
681
|
|
817
|
|
|
Central Region Total
|
|
5,823
|
|
27,182
|
|
33,005
|
|
|
|
|
|
|
|
|
|
|
|
East
Region
|
|
|
|
|
|
|
|
|
Florida
|
|
322
|
|
3,475
|
|
3,797
|
|
|
|
|
|
|
|
|
|
|
|
Total Company
|
|
7,554
|
|
36,521
|
|
44,075
|
|
|
|
|
|
|
|
|
|
|
|
Total book cost (3)
|
|
$
|
582,260
|
|
$
|
167,330
|
|
$
|
749,590
|
|
|
|
|
|
|
|
|
|
|
|
|
(1) Excludes lots with finished homes or
homes under construction. The number of lots is estimated and is subject to
change.
(2) There
can be no assurance that we will actually acquire any lots under option or
properties in which we have entered into a variety of contractual
relationships, including purchase agreements with customary conditions
precedent and other similar arrangements. These amounts do not include 3,720
lots under contract with refundable earnest money deposits of approximately
$800,000 for which we have not completed due diligence and, accordingly, have
no money at risk and are under no obligation to perform under the contract, but
include 6,424 lots under option contracts with joint ventures in which we are a
member.
(3) For
Lots Owned, book cost primarily represents land, development, interest and
common costs. For Lots under Contract or Option, book cost primarily represents
earnest deposits and option deposits.
7
Construction Operations
We act as the general contractor for our projects and typically hire
subcontractors on a project-by-project or reasonable geographic-proximity basis
to complete construction at a fixed price. We usually enter into agreements
with subcontractors and materials suppliers on an individual basis after
receiving competitive bids, when appropriate. We obtain information from
prospective subcontractors and suppliers with respect to their financial
condition and ability to perform their agreements before formal bidding begins.
Occasionally, we enter into longer-term contracts with subcontractors and
suppliers if we can obtain more favorable terms to minimize costs of
construction. Our project managers and field superintendents coordinate and supervise
the activities of subcontractors and suppliers, subject the development and
construction work to quality and cost controls, and monitor compliance with
zoning and building codes. At December 31, 2006, we employed approximately 830
construction operations personnel.
We specify that quality, durable materials be used in
construction of our homes and we do not maintain significant inventories of
construction materials, except for work in process materials for homes under
construction. When possible, we negotiate price and volume discounts with
manufacturers and suppliers on behalf of our subcontractors to take advantage
of production volume. Historically, access to our principal subcontracting
trades, materials and supplies has been readily available in each of our
markets. Prices for these goods and services may fluctuate due to various
factors, including supply and demand shortages that may be beyond the control
of our vendors. We believe that we have good relationships with our suppliers
and subcontractors.
We generally build and sell homes in clusters or
phases within our larger projects, which we believe creates efficiencies in
land development and home construction, and improves customer satisfaction by
reducing the number of vacant lots surrounding a completed home. Our homes are
typically completed within four to nine months from the start of construction,
depending upon the geographic location and the size and complexity of the home.
Construction schedules may vary depending on the availability of labor,
materials and supplies, product type, location and weather. Our homes are
usually designed to promote efficient use of space and materials, and to
minimize construction costs and time. We typically have not entered into any
derivative contracts to hedge against weather or materials fluctuations as we
do not believe they are particularly advantageous to our operations.
Marketing and Sales
We believe that we have an established reputation for
developing high quality homes, which helps generate interest in each new
project. We also use advertising and other promotional activities, including
our website at www.meritagehomes.com,
magazine and newspaper advertisements, brochures, direct mailings and the
placement of strategically located signs in the vicinities around our
developments.
We use furnished model homes as tools in demonstrating
to prospective homebuyers the advantages of the designs and features of our
homes. We generally employ or contract with interior and landscape designers
who are responsible for creating attractive model homes and complexes with many
built-in options for each product line within a project. We generally build
between one and four model homes for each actively selling community, depending
upon the number of homes to be built in the project and the products to be
offered. We often sell our model homes
to, and lease them back from, institutional investors who purchase the homes
for investment purposes or from individual buyers who do not intend to occupy
the home immediately. At December 31, 2006, we owned 75 and leased 357 model
homes and had an additional 87 models under construction. As of December 31,
2006, monthly payments for our leased models were approximately $433,000, of
which approximately $176,000 is accounted for as interest on debt related to
our model lease program. See Note 5 for further detail.
Our homes generally are sold by full-time or part-time, commissioned
employees who typically work from a sales office located in one of the model
homes for each project. At December 31, 2006, we had approximately 580 sales
and marketing personnel. Our goal is to ensure that our sales force has
extensive knowledge of our operating policies and housing products. To achieve
this goal, we train our sales associates and conduct regular meetings to update
them on sales techniques, competitive products in the area, financing
availability, construction schedules, marketing and advertising plans and the
available product lines, pricing, options and warranties offered. Our sales
associates are licensed real estate agents where required by law. Independent
brokers also sell our homes, and are usually paid a sales commission based on
the price of the home. Our sales associates assist our customers in selecting
upgrades or in adding available customization features to their homes, which we
design to appeal to local consumer demands.
We may also offer various sales incentives, such as landscaping or
interior upgrades, to attract buyers. The use and type of incentives depends
largely on economic and local competitive market conditions.
8
Backlog
Most of our home sales are made under standard
sales contracts signed before construction of the home begins. The contracts
require cash deposits and are usually subject to certain contingencies such as
the buyer’s ability to qualify for financing. Homes covered by such sales
contracts but not yet closed are considered “backlog.” Sales contingent upon the sale of a customer’s
existing home are not included as new sales contracts until the contingency is
removed. We do not recognize revenue upon the sale of a home until it is
delivered to the homebuyer and other criteria for sale and profit recognition
are met. We sometimes build homes before obtaining a sales contract; however,
these homes are excluded from backlog until a sales contract is signed. At
December 31, 2006, of our homes in inventory, 19.4% were under construction
without sales contracts and 13.0% were completed homes without sales contracts.
Of the 32.4% of homes without sales contracts, a substantial majority resulted
from cancelled home sale contracts as opposed to our building a home before
obtaining a sales contract. We believe
that during 2007 we will deliver to customers substantially all homes in
backlog at December 31, 2006.
Our backlog decreased to 3,685 units with a value of
approximately $1.2 billion at December 31, 2006 from 6,394 units with a value
of approximately $2.2 billion at December 31, 2005. These decreases are due to deteriorating
market conditions during 2006, which resulted in lower sales volumes and
selling prices, high cancellation rates and increased closings during 2006.
Customer Financing
We attempt to
help qualified homebuyers who require financing to obtain loans from mortgage
lenders that offer a variety of financing options. We provide mortgage-broker
services in most of our markets through relationships with mortgage-brokers,
generally through joint ventures in which we have a non-controlling interest,
which facilitate obtaining customer loans on behalf of third party lenders. In
some markets we use unaffiliated preferred mortgage lenders. We may pay a
portion of the closing costs and discount mortgage points to assist homebuyers
with financing. We do not fund or service the mortgages obtained by our
homebuyers, and therefore do not assume the risks associated with a mortgage
banking business. Since many customers use long-term mortgage financing to
purchase homes, adverse economic conditions, rising mortgage interest rates and
increases in unemployment may deter or reduce the number of potential
homebuyers.
Customer Relations, Quality Control and Warranty Programs
We believe that positive customer relations and an
adherence to stringent quality control standards are fundamental to our continued
success, and that our commitment to buyer satisfaction and quality control has
significantly contributed to our reputation as a high quality builder.
A Meritage project manager or project superintendent
and a customer relations representative generally oversee compliance with
quality control standards for each community. These representatives perform the
following tasks:
· oversee home
construction;
· oversee
subcontractor and supplier performance;
· review the
progress of each home and conduct formal inspections as specific stages of
construction are completed; and
· regularly
update buyers on the progress of their homes and coordinate the closing
process.
We generally provide for each home a one- to two-year
limited warranty on workmanship and building materials. Various of the states in which we build homes
also have laws providing statutory warranties related to structural defects
that generally range in duration from 8 to 15 years. We generally require our subcontractors to
provide an indemnity and a certificate of insurance before beginning work,
which means that claims relating to workmanship and materials are generally the
subcontractors’ responsibility. Reserves for future warranty costs are
established based on Company and industry-wide historical experience within
each division or region, and are recorded when the homes are closed. Reserves
generally range from 0.42% to 0.83% of a home’s sale price. Historically, these
reserves have been sufficient to cover warranty repairs.
Competition and Market Factors
The development and sale of residential property is a
highly competitive industry. We compete for sales in each of our markets with
national, regional and local developers and homebuilders, existing home
resales, and to a lesser extent, condominiums and rental housing. Some of our
competitors have significantly greater financial resources and lower costs
9
than
we do. Competition among both small and large residential homebuilders is based
on a number of interrelated factors, including location, reputation, amenities,
design, quality and price. We believe that we compare favorably to other
homebuilders in the markets in which we operate due to our:
· experience
within our geographic markets which allows us to develop and offer new
products;
· ability to
recognize and adapt to changing market conditions, including from a capital and
human resource perspective;
· ability to
capitalize on opportunities to acquire land on favorable terms; and
· reputation
for outstanding service and quality products.
Government Regulation and Environmental
Matters
We acquire most of our land after entitlements have
been obtained. Construction may begin almost immediately on such entitled land
upon compliance with and receipt of specified permits, approvals and other
conditions, which generally are within our control. The time needed to obtain
such approvals and permits affects the carrying costs of unimproved property
acquired for development and construction. The continued effectiveness of
permits already granted is subject to factors such as changes in government
policies, rules and regulations, and their interpretation and application. To
date, the government approval processes discussed above have not had a material
adverse effect on our development activities, although there is no assurance
that these and other restrictions will not adversely affect future operations.
Local and state governments have broad discretion
regarding the imposition of development fees for projects under their
jurisdictions. These fees are normally established when we receive recorded
maps or plats and building permits. In addition, communities occasionally
impose construction moratoriums. Because most of our land is entitled,
construction moratoriums generally would not affect us in the near term unless
they arose from health, safety or welfare issues, such as insufficient water,
electric or sewage facilities. In the long term, we could become subject to
delays or may be precluded entirely from developing communities due to building
moratoriums, “no growth” or “slow growth” initiatives or building permit
allocation ordinances, which could be implemented in the future.
We are also subject to a variety of local, state, and
federal statutes, ordinances, rules and regulations concerning the protection
of health and the environment. In some markets, we are subject to
environmentally sensitive land ordinances that mandate open space areas with
public elements in housing developments, and prevent development on hillsides,
wetlands and other protected areas. We must also comply with flood plain
restrictions, desert wash area restrictions, native plant regulations,
endangered species acts and view restrictions. These and similar laws may
result in delays, cause substantial compliance and other costs, and prohibit or
severely restrict development in certain environmentally sensitive regions or
areas. To date, compliance with such ordinances has not materially affected our
operations, although it may do so in the future.
We usually will condition our obligation to acquire
property on, among other things, an environmental review of the land. To date,
we have not incurred any unanticipated liabilities relating to the removal of
unknown toxic wastes or other environmental matters. However, there is no assurance
that we will not incur material liabilities in the future relating to toxic
waste removal or other environmental matters affecting land currently or
previously owned.
Employees, Subcontractors and Consultants
At December 31, 2006, we had approximately 1,950 full-time employees,
including approximately 540 in management and administration, 580 in sales and
marketing, and 830 in construction operations. Our employees are not unionized,
and we believe that we have good employee relationships. We pay for a substantial
portion of our employees’ insurance costs, with the balance contributed by the
employees. We also have a 401(k) savings plan, which is available to most of
our employees.
We act solely as a general contractor, and all construction operations
are supervised by our project managers and field superintendents who manage
third party subcontractors. We use independent consultants and contractors for
architectural, engineering, advertising and legal services, and we strive to
maintain good relationships with our subcontractors and independent consultants
and contractors.
10
Investments in
Unconsolidated Entities
We participate in numerous
joint ventures with independent third parties (approximately 25 joint ventures
at December 31, 2006) relating to the purchase and development of land. We have
less than a controlling interest in these types of entities. We typically enter
into these joint ventures with other homebuilders, land sellers or real estate
investors to provide us and the other joint venture partners with a means of
accessing larger parcels and lot positions. The typical joint venture acquires
raw land and processes the property through the entitlement process and, in
some cases, develops the property into partially or fully finished lots. These
joint ventures are usually obligated to sell all or a part of the property or
lots to the joint venture members (at the respective member’s option),
generally at prevailing fair market values (either at the time of acquisition
or the time of sale). In some cases, part of the property is sold to non-member
homebuilders, commercial developers and other third parties. Our participation
in these types of joint ventures is an increasingly important part of our
business model, and we expect it to continue to be in the future.
In connection with these
types of joint ventures, we and/or joint venture partners provide certain types
of guarantees, indemnification arrangements with surety and performance bond
providers and environmental indemnities. Reference is made to Part II, Item 7
in this Annual Report titled “Management’s Discussion and Analysis of Financial
Condition and Results of Operations – Off-Balance Sheet Arrangements” for a
discussion of these items.
We also participate in joint
ventures relating to the provision of mortgage brokerage and title services.
The purpose of these joint ventures is to establish relationships with
providers of mortgage brokerage and title services in order to facilitate the
design of products and services that can be offered to our customers at
attractive prices in a convenient manner. We believe these types of joint
ventures provide a valuable service to our customers and provide us with
additional revenue and profit opportunities, although at the current time these
types of arrangements are not a significant component of our business.
At December 31, 2006, we had
approximately $111.1 million invested in joint ventures involved in the
purchase, development and/or sale of land. We also had approximately $3.2
million invested in mortgage brokerage and title service joint ventures. In
2006, we reported pre-tax earnings of $3.7 million related to our share of the
earnings of our land joint ventures and $16.7 million related to our share of
the earnings of our mortgage-brokerage and title service joint ventures. For
our land joint ventures, we do not recognize profits on lots or land that we
acquire from the joint venture, but instead defer any profits until we sell the
related homes to third party homebuyers.
Item 1A. Risk Factors
Interest Rates and Mortgage
Financing. In general, housing demand is
adversely affected by increases in interest rates and the unavailability of
mortgage financing. Increased
cancellations could increase the available inventory of homes, which may reduce
prices and reduce the availability of future financing for home buyers. Most of our buyers finance their home
purchases through third-party lenders providing mortgage financing. If mortgage interest rates increase and,
consequently, the ability of prospective buyers to finance home purchases is
adversely affected, home sales, gross margins and cash flow may also be
adversely affected and the impact may be material. Long-term interest rates currently remain at
low levels; however, rates have generally increased during the last couple of
years from historically low levels and it is impossible to predict future
increases or decreases in market interest rates.
Homebuilding activities depend upon the availability and
costs of mortgage financing for buyers of homes owned by potential customers,
as those customers (move-up buyers) often must sell their residences before
they purchase our homes. Mortgage
lenders have recently become subject to more intense underwriting standards by
the regulatory authorities which oversee them.
More stringent underwriting standards could indirectly have a material
adverse effect on our business if certain buyers are unable to obtain mortgage
financing.
Housing Affordability and Market
Conditions. As a participant in the homebuilding
industry, we are subject to market forces beyond our control. In general, housing demand can be impacted by
the affordability of housing. In recent
periods, the affordability of housing has declined in many of our markets,
which could adversely affect the ability of our customers, particularly
first-time homebuyers, to afford our product offerings. In addition, many homebuyers need to sell
their existing homes in order to purchase a new home from us, and a weakening
of the home resale market or a decrease or leveling in home sale prices could
adversely affect that ability. Some
commentators believe that the prices of homes are inflated and may decline, or
continue to decline, if the demand for homes weakens. A decline in prices for homes could have an adverse
effect on our homebuilding business.
11
Cancellations. Our backlog reflects the number and value of homes for
which we have entered into a sales contract with a customer but have not yet
delivered the home. Although these sales
contracts typically require a cash deposit and do not make the sale contingent
on the sale of the customer’s existing home, in some cases a customer may
cancel the contract and receive a complete or partial refund of the deposit as
a result of local laws or as a matter of our business practices. If home prices decline, interest rates
increase or if there is a national or local economic decline, homebuyers may
have an incentive to cancel their contracts with us, even where they might be entitled
to no refund or only a partial refund.
Significant cancellations have had, and could have, a material adverse
effect on our business as a result of lost sales revenue and the accumulation
of unsold housing inventory.
Future Expansion. We may continue to consider growth or expansion of our
operations in our current markets or in other areas of the country. Our expansion into new or existing markets
could have a material adverse effect on our cash flows and/or profitability. The magnitude, timing and nature of any
future expansion will depend on a number of factors, including suitable
acquisition candidates, the negotiation of acceptable terms, our financial
capabilities and general economic and business conditions. New acquisitions may result in the incurrence
of additional debt. Acquisitions also
involve numerous risks, including difficulties in the assimilation of the
acquired company’s operations, the incurrence of unanticipated liabilities or
expenses, the diversion of management’s attention from other business concerns,
risks of entering markets in which we have limited or no direct experience and
the potential loss of key employees of the acquired company.
Dependence on
Subcontractors. We conduct our construction
operations only as a general contractor.
Virtually all architectural, construction and development work is
performed by unaffiliated third-party subcontractors. As a consequence, we depend on the continued
availability of and satisfactory performance by these subcontractor for the
design and construction of our homes. We
cannot assure you that there will be sufficient availability of and
satisfactory performance by these unaffiliated third-party subcontractors. In addition, inadequate subcontractor
resources could have a material adverse affect on our business.
Operating and Financial Limitations. The
indentures for our senior notes and the agreement for our senior unsecured
credit facility impose significant operating and financial restrictions on us.
These restrictions limit our ability and the ability of our subsidiaries, among
other things, to:
· incur
additional indebtedness or liens;
· pay
dividends or make other distributions;
· repurchase
our stock;
· make
investments (including investments in joint ventures); or
· consolidate,
merge or sell all or substantially all of our assets.
In addition, the indentures for our senior notes and
the agreement for our senior unsecured credit facility require us to maintain a
minimum consolidated tangible net worth and our credit facility requires us to
maintain other specified financial ratios, including the amount and types of
land, speculative housing and model homes that we may own at any given time. We
cannot assure you that these covenants will not adversely affect our ability to
finance our future operations or capital needs or to pursue available business
opportunities. A breach of any of these covenants or our inability to maintain
the required financial ratios could result in a default in respect of the
related indebtedness. If a default occurs, the relevant lenders could elect to
declare the indebtedness, together with accrued interest and other fees, to be
immediately due and payable.
Increased Investments in Joint
Ventures. We participate in numerous land
acquisition and development joint ventures with independent third parties, in
which we have less than a controlling interest.
Our participation in these types of joint ventures has increased over
the last couple of years and we expect to continue to use joint ventures in the
foreseeable future. These joint ventures
provide us with a means of accessing larger parcels and lot positions and help
us expand our marketing opportunities and manage our risk profile. However, these joint ventures often acquire
parcels of raw land without entitlements and as such are subject to a number of
development risks that our business does not face directly. These risks include the risk that anticipated
projects could be delayed or terminated because applicable governmental
approvals cannot be obtained at reasonable costs, if at all. In addition, the risk of construction and
development cost overruns can be greater for a joint venture where it acquires
raw land compared to our typical acquisition of entitled lots. These increased development and entitlement
risks could have a material adverse effect on our financial position or results
of operations if one or more joint venture projects is delayed, cancelled or
terminated or we are required, whether contractually or for business reasons,
to invest additional funds in the joint venture to facilitate the success of a
particular project.
Our joint venture investments are generally very illiquid
both because we lack a controlling interest in the ventures and because most of
our joint ventures are structured to require super-majority or unanimous
approval of the members to sell a substantial portion of the joint venture’s
assets or for a member to receive a return of their invested capital. Our lack of controlling interest also results
in the risk that the joint venture will take actions that we disagree with, or
fail to take actions that we desire.
Colonial Homes and Greater Homes
Acquisitions. In February and September 2005, we
completed the acquisitions of substantially all of the homebuilding operations
of Colonial Homes of Ft. Myers/Naples, Florida, and Greater Homes of Orlando,
Florida, respectively. The integration
of Colonial and Greater Homes into our operations following the acquisitions
involved a number of challenges. In
particular, the combined companies experienced attrition among management and
personnel. In general, the integration
of acquired companies requires, among other things, coordination of management,
administrative and other functions.
Failure to overcome these challenges or any other problems could cause
financial condition, results of operations and competitive position to
decline. Our integration of the Colonial
Homes and Greater Homes acquisitions assumed certain synergies and other
benefits. We cannot assure you that
unforeseen factors will not offset the intended benefits of these acquisitions
in whole or in part.
Attached Product and Condominium
Offerings. We recently expanded our business
into condominium construction and sales in certain markets in which we operate
and we face challenges and risks with such endeavors. Previously, our business had typically
involved only the construction and sale of single-family homes. The construction and sale of
12
condominium
homes involves different construction processes and subcontractors and, to a
degree, different customers. In
addition, condominium homes typically involve more extensive sales and warranty
regulations.
Dependence on Key Personnel. Our success largely depends on the continuing services
of certain key employees, including our Chief Executive Officer, Steven J.
Hilton, and our ability to attract and retain qualified personnel. We have an employment agreement with Mr.
Hilton but we do not have employment agreements with certain other key
employees. We believe that Mr. Hilton
possesses valuable industry knowledge, experience and leadership abilities that
would be difficult in the short term to replicate. In addition, Mr. Hilton has cultivated key
contacts and relationships with important participants in the land acquisition
process in our various markets across the country. The loss of the services of Mr. Hilton and
other key employees could harm our operations and business plans.
Limited Geographic
Diversification. We have operations in Texas,
Arizona, California, Nevada, Colorado and Florida. Our limited geographic diversification could
adversely impact us if the homebuilding business in our current markets should
decline, since there may not be a balancing opportunity in a stronger market in
other geographic regions.
Increased Insurance Costs. Recently, lawsuits have been filed against builders
asserting claims of personal injury and property damage caused by the presence
of mold in residential dwellings. Some
of these lawsuits have resulted in substantial monetary judgments or
settlements. We believe that we have
maintained adequate insurance coverage to insure against these types of claims
for homes completed before October 1, 2003.
Insurance carriers have been excluding from policies of many
homebuilders coverage for claims arising from the presence of mold and, as of
October 1, 2003, our insurance policy began excluding mold coverage. If our retentions are not sufficient to
protect against these types of claims or if we are unable to obtain adequate
insurance coverage, a material adverse effect on our business, financial
condition and results of operations could result if we are exposed to claims
arising from the presence of mold in the homes that we build.
Natural Disasters. We have significant homebuilding operations in Texas,
California and Florida. Some of our
markets in Texas and Florida occasionally experience extreme weather conditions
such as tornadoes and/or hurricanes.
California has experienced a significant number of earthquakes,
wildfires, flooding, landslides and other natural disasters in recent
years. We do not insure against some of
these risks. These occurrences could
damage or destroy some of our homes under construction or our building lots,
which may result in losses that exceed our insurance coverage. We could also suffer significant construction
delays or substantial fluctuations in the pricing or availability of building
materials. Any of these events could
cause a decrease in our revenue, cash flows and earnings.
Inflation. We, like other homebuilders, may be adversely affected
during periods of high inflation, mainly because of higher land and
construction costs. Also, higher
mortgage interest rates may significantly affect the affordability of mortgage
financing to prospective buyers.
Inflation increases our cost of financing, materials and labor and could
cause our financial results or growth to decline. We attempt to pass cost increases on to our
customers through higher sales prices.
Although inflation has not historically had a material adverse effect on
our business, recently the cost of some of the materials we use to construct
our homes has increased. Sustained
increases in material costs would have a material adverse effect on our
business if we are unable to increase home sale prices or home sale prices
comparably decrease.
Home Warranty Factors. Construction defect and home warranty claims are
common in the homebuilding industry and can be costly. While we maintain product liability insurance
and generally require our subcontractors and design professionals to indemnify
us for liabilities arising from their work, we cannot assure you that these
insurance rights and indemnities will be adequate to cover all construction
defect and warranty claims for which we may be held liable. For example, we may be responsible for
applicable self-insured retentions, which have increased recently, and certain
claims may not be covered by insurance or may exceed applicable coverage
limits.
Homebuilding Industry
Factors. The homebuilding industry is
cyclical and is significantly affected by changes in economic and other
conditions such as employment levels, availability of financing, interest
rates, and consumer confidence. These
factors can negatively affect demand for and cost of our homes. We are also subject to various risks, many of
which are outside of our control, including delays in construction schedules,
cost overruns, changes in governmental regulations (such as no- or slow-growth
initiatives), availability of land, availability of option financing, increases
in inventories of new and existing homes, increases in real estate taxes and
other local government fees, and raw materials and labor costs.
We are also subject to the potential for significant
variability and fluctuations in the cost and availability of real estate. Although historically we have generally
developed parcels ranging from 100 to 300 lots, in order to achieve and
maintain an adequate inventory of lots, we are now acquiring larger parcels in many
cases with a joint venture partner.
13
Impairments
of our real estate and write-offs of purchase and option contract deposits and
pre-acquisition costs were recorded during 2006, and if market conditions
continue to deteriorate such impairments and write-offs may again be required
in the future.
Declines in Real Estate
Values. Some of our owned land was purchased
at prices that reflected the strong homebuilding and real estate markets of the
past several years. As such, in certain
circumstances, we wrote down the value of certain inventory during 2006 to
reflect current market conditions. A
continued decline in the homebuilding market may require us to re-evaluate the
value of our land holdings and we could incur additional impairment charges,
which decrease both the book value of our assets and stockholders’ equity. We also incur various land development
improvement costs for a community prior to the commencement of home
construction. Such costs include
infrastructure, utilities, taxes and other related expenses. Reductions in home absorption rates increases
the associated holding costs and our time to recover such costs. Continued
declines in the homebuilding market may require us to evaluate the recoverability
of these costs.
Deposits and Pre-Acquisition
Costs. We extensively use options to acquire
land. Such options generally require a
cash deposit that will be forfeited if we do not exercise the option. During 2006, we forfeited deposits and wrote
off related pre-acquisition costs related to projects we no longer deemed
feasible. A continued downturn in the
homebuilding market may cause us to re-evaluate the feasibility of other
optioned projects, which may result in additional writedowns that would reduce
our assets and stockholders’ equity.
Fluctuations in Operating
Results. We historically have experienced,
and expect to continue to experience, variability in home sales and net
earnings on a quarterly basis. As a
result of such variability, our historical performance may not be a meaningful
indicator of future results. Factors
that contribute to this variability include:
· timing of
home deliveries and land sales;
· delays in
construction schedules due to strikes, adverse weather, acts of God, reduced
subcontractor availability and governmental restrictions;
· our ability
to acquire additional land or options for additional land on acceptable terms;
· conditions
of the real estate market in areas where we operate and of the general economy;
· the cyclical
nature of the homebuilding industry, changes in prevailing interest rates and
the availability of mortgage financing; and
· costs and
availability of materials and labor.
Competition. The homebuilding industry is highly competitive. We compete for sales in each of our markets
with national, regional and local developers and homebuilders, existing home
resales and, to a lesser extent, condominiums and available rental
housing. Some of our competitors have
significantly greater financial resources or lower costs than we do. Competition among both small and large
residential homebuilders is based on a number of interrelated factors,
including location, reputation, amenities, design, quality and price. Competition is expected to continue and
become more intense, and there may be new entrants in the markets in which we
currently operate and in markets we may enter in the future. If we are unable to successfully compete, our
financial results and growth could suffer.
Additional Financing; Limitations. The
homebuilding industry is capital intensive and requires significant up-front
expenditures to secure land and begin development and construction.
Accordingly, we incur substantial indebtedness to finance our homebuilding
activities. At December 31, 2006, we had approximately $733.3 million of
indebtedness and other borrowings. If we require working capital greater than
that provided by operations or available under our credit facility, we may be
required to seek additional capital in the form of equity or debt financing
from a variety of potential sources, including bank financing and securities
offerings. There can be no assurance we would be able to obtain such additional
capital on terms acceptable to us, if at all. The level of our indebtedness
could have important consequences to our stockholders, including the following:
· our
ability to obtain additional financing for working capital, capital
expenditures, acquisitions or general corporate purposes may be impaired;
· we
must use a substantial portion of our cash flow from operations to pay interest
and principal on our indebtedness, which reduces the funds available to us for
other purposes such as capital expenditures;
· we
have a higher level of indebtedness than some of our competitors, which may put
us at a competitive disadvantage and reduce our flexibility in planning for, or
responding to, changing conditions in our industry, including increased
competition; and
· we
may be more vulnerable to economic downturns and adverse developments in our business
than some of our competitors.
We expect to obtain the money to pay our expenses and to pay the
principal and interest on our indebtedness from cash flow from operations. Our
ability to meet our expenses thus depends on our future performance, which will
be affected by financial, business, economic and other factors. We will not be
able to control many of these factors, such as economic conditions in the
markets where we operate and pressure from competitors.
We cannot be certain that our cash flow will be sufficient to allow us
to pay principal and interest on our debt and meet our other obligations. If we
do not have sufficient funds, we may be required to refinance all or part of
our existing debt, sell assets or borrow additional funds. We cannot guarantee
that we will be able to do so on terms acceptable to us, if at all. In
addition, the terms of existing or future debt agreements may restrict us from
pursuing any of these alternatives.
14
Government Regulations;
Environmental Conditions. Regulatory requirements could cause
us to incur significant liabilities and costs and could restrict our business
activities. We are subject to local,
state and federal statutes and rules regulating certain developmental matters,
as well as building and site design. We
are subject to various fees and charges of government authorities designed to
defray the cost of providing certain governmental services and improvements. We may be subject to additional costs and
delays or may be precluded entirely from building projects because of
“no-growth” or “slow-growth” initiatives, building permit ordinances, building
moratoriums, or similar government regulations that could be imposed in the
future due to health, safety, welfare or environmental concerns. We must also obtain licenses, permits and
approvals from government agencies to engage in certain activities, the
granting or receipt of which are beyond our control and could cause delays in
our homebuilding projects.
We are also subject to a variety of local, state and federal
statutes, ordinances, rules and regulations concerning the protection of health
and the environment. Environmental laws
or permit restrictions may result in project delays, may cause substantial
compliance and other costs and may prohibit or severely restrict development in
certain environmentally sensitive regions or geographic areas. Environmental regulations can also have an
adverse impact on the availability and price of certain raw materials, such as
lumber.
Acts of War. Acts of war or any outbreak or escalation of
hostilities between the United States and any foreign power, including the
conflict with Iraq, may cause disruption to the economy, our company, our
employees and our customers, which could impact our revenue, costs and expenses
and financial condition.
Performance of Joint Venture
Partners. In the ordinary course of our
business, we obtain letters of credit and performance, maintenance and other
bonds in support of our related obligations with respect to the development of
our projects. With respect to our joint
ventures, we and our joint venture partners are typically obligated to complete
land development improvements if the joint venture does not perform the
required development. In addition, we
and our joint venture partners sometimes agree to indemnify third party surety
providers with respect to performance bonds issued on behalf of certain of our
joint ventures. In the event the letters
of credit or bonds are drawn upon, we, and in the case of a joint venture, our
joint venture partners, would be obligated to reimburse the surety or other
issuer of the letter of credit or bond if the obligations the bond or guarantee
secures are not performed by us (or the joint venture). If one or more bonds, letters of credit or
other guarantees were drawn upon or otherwise invoked, our obligations could be
significant, individually or in the aggregate, which could have a material
adverse effect on our financial position or results of operations. We cannot guarantee that such events will not
occur or that such obligations will not be invoked.
15
Special Note of Caution Regarding Forward-Looking
Statements
In
passing the Private Securities Litigation Reform Act of 1995 (PSLRA), Congress
encouraged public companies to make “forward-looking statements” by creating a
safe-harbor to protect companies from securities law liability in connection
with forward-looking statements. We intend to qualify both our written and oral
forward-looking statements for protection under the PSLRA.
The
words “believe,” “expect,” “anticipate,” “forecast,” “plan,” “estimate,” and “project”
and similar expressions identify forward-looking statements, which speak only
as of the date the statement was made. All statements we make other than
statements of historical fact are forward-looking statements within the meaning
of that term in Section 27A of the Securities Act of 1933, and Section 21E of
the Exchange Act. Forward-looking statements in this Annual Report include
statements concerning the demand for and the pricing of our homes, the growth
potential of the markets we operate in, our acquisition strategy, demographic
and other trends related to the homebuilding industry in general and our
ability to capitalize on them, the future supply of housing inventory in our
markets and the homebuilding industry in general, our ability to renew existing
leases on comparable terms, our expectation that existing letters of credit and
performance and surety bonds will not be drawn on, the adequacy of our
insurance coverage and warranty reserves, our ability to deliver existing
backlog, the expected outcome of legal proceedings against us, the sufficiency
of our capital resources to support our business strategy, our ability and
willingness to acquire land under option or contract, the future impact of
deferred tax assets or liabilities, that our participation in joint ventures
will continue to increase, the impact of changes in accounting estimates, that
order and cancellation rates will return to more normalized levels in late 2007
or early 2008, and that certain guarantees relating to our joint ventures will
not be triggered.
Important
factors currently known to management that could cause actual results to differ
materially from those in forward-looking statements, and that could negatively
affect our business are discussed in this report under the heading “Risk
Factors.”
Forward-looking
statements express expectations of future events. All forward-looking
statements are inherently uncertain as they are based on various expectations
and assumptions concerning future events and they are subject to numerous known
and unknown risks and uncertainties that could cause actual events or results
to differ materially from those projected. Due to these inherent uncertainties,
the investment community is urged not to place undue reliance on
forward-looking statements. In addition, we undertake no obligations to update
or revise forward-looking statements to reflect changed assumptions, the
occurrence of unanticipated events or changes to projections over time. As a
result of these and other factors, our stock and note prices may fluctuate
dramatically.
Item 1B.
Unresolved Staff Comments
None.
Item 2.
Properties
Our corporate offices are leased properties located in Scottsdale,
Arizona. The lease expires in March 2014.
We lease an aggregate of approximately 350,000 square
feet of office space in our markets for our operating divisions, corporate and
executive offices.
Item 3. Legal Proceedings
The
United States Environmental Protection Agency and Maricopa County (Arizona) Air
Quality Department have in the past assessed fines against us for violating
dust control regulations. While we strive to maintain practices that comply
with such regulations, dust control violations are common to the residential
homebuilding industry in desert regions such as Arizona. We do not believe that
such fines will have a material adverse effect on our business, financial
position or results of operations.
We are involved in various routine legal proceedings
incidental to our business, some of which are covered by insurance. With
respect to the majority of pending litigation matters, our ultimate legal and
financial responsibility, if any, cannot be estimated with certainty and, in
most cases, any potential losses related to these matters are not considered
probable. At December 31, 2006, we had approximately $2.4 million in accrued
legal expenses and settlement costs reserved
16
for
possible losses related to litigation and asserted claims where our ultimate
exposure is considered probable and the potential loss can be reasonably
estimated. Most of these matters relate to correction of home construction
defects, foundation issues and general customer claims. We believe that none of
these matters will have a material adverse impact upon our consolidated
financial condition, results of operations or cash flows.
Item 4. Submission of Matters to a Vote of
Security Holders
No matters were submitted to a vote of security
holders during the quarter ended December 31, 2006.
Executive Officers of the Registrant
The executive officers of the Company are elected each
year at a meeting of the Board of Directors, which follows the annual meeting
of the stockholders, and at other Board of Directors meetings as appropriate.
The names, ages, positions and business experience of
our executive officers are listed below (all ages are as of March 1, 2007).
There are no understandings between any of our executive officers and any other
person pursuant to which any executive officer was selected to his office.
|
Name
|
|
Age
|
|
Position
|
|
|
|
|
|
|
|
|
|
Steven J. Hilton
|
|
45
|
|
Chairman
of the Board and Chief Executive Officer
|
|
|
Larry W. Seay
|
|
51
|
|
Chief
Financial Officer and Executive Vice President
|
|
|
C. Timothy White
|
|
46
|
|
General
Counsel, Executive Vice President and Secretary
|
|
|
Sandra R.A. Karrmann
|
|
41
|
|
Executive
Vice President – Chief Human Resources Officer
|
|
|
Steven M. Davis
|
|
48
|
|
Executive Vice
President of National Home Building Operations
|
|
Steven J. Hilton
co-founded Monterey Homes in 1985, which merged with the Company’s predecessor
in December 1996. Mr. Hilton served as Co-Chairman and CEO from July 1997 to
May 2006 and has been the Chairman and Chief Executive Officer since May 2006.
Larry W. Seay has
been Chief Financial Officer since December 1996 and was appointed Executive
Vice President in October 2005. Mr. Seay served as Secretary from 1997 to
October 2005.
C.
Timothy White has been General Counsel, Executive Vice President and Secretary
since October 2005 and served on the Meritage Board of Directors from December
1996 until October 2005. Mr. White
served as outside counsel to the Company from 1991 through September 2005.
Sandra
Karrmann has been Chief Human Resources Officer since December 2005 and was
appointed Executive Vice President in September 2006. From April 1993 to December 2005, Ms.
Karrmann was employed by Pepsico in various roles with the Frito-Lay North
America and Taco Bell divisions, most recently as its Vice President – Human
Resources – Sales at Frito-Lay.
Steven
M. Davis has been Executive Vice President of National Home Building Operations
since October 2006. From 2000 to
September 2006, Mr. Davis was employed by KBHome as a Regional General Manager,
with various other management roles at KBHome from 1995 to 2000.
17
PART II
Item 5. Market For Registrant’s Common Equity,
Related Stockholder Matters and Issuer Purchases of Equity Securities
Our common stock is listed on the New York Stock Exchange (“NYSE”)
under the symbol “MTH”. The high and low sales prices per share of our common
stock for the periods indicated, as reported by the NYSE, follow. Prices
reflect a 2-for-1 stock split effected in the form of a stock dividend that
occurred in January 2005.
|
|
|
2006
|
|
2005
|
|
|
Quarter Ended
|
|
High
|
|
Low
|
|
High
|
|
Low
|
|
|
|
|
|
|
|
|
|
|
|
|
|
March 31
|
|
$
|
67.91
|
|
$
|
52.42
|
|
$
|
76.62
|
|
$
|
53.42
|
|
|
June 30
|
|
$
|
68.34
|
|
$
|
45.35
|
|
$
|
85.00
|
|
$
|
58.54
|
|
|
September 30
|
|
$
|
47.80
|
|
$
|
34.44
|
|
$
|
96.50
|
|
$
|
72.06
|
|
|
December 31
|
|
$
|
51.11
|
|
$
|
41.00
|
|
$
|
78.27
|
|
$
|
57.29
|
|
The
following Performance Graph and related information shall not be deemed “soliciting
material” or to be filed with the Securities and Exchange Commission, nor shall
such information be incorporated by reference into any filing under the
Securities Act of 1933 or Securities Exchange Act of 1934, each as amended,
except to the extent that the Company specifically incorporates it by reference
into such filing.
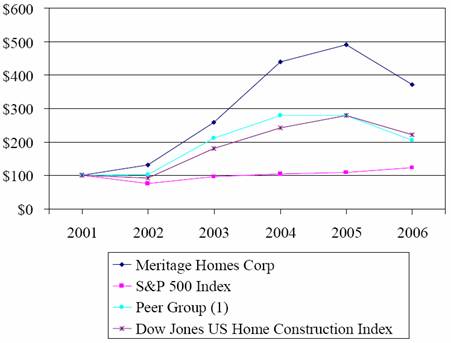
|
|
|
2001
|
|
2002
|
|
2003
|
|
2004
|
|
2005
|
|
2006
|
|
|
Meritage Homes
Corp
|
|
100
|
|
131
|
|
259
|
|
440
|
|
491
|
|
372
|
|
|
S&P 500
Index
|
|
100
|
|
77
|
|
97
|
|
106
|
|
109
|
|
124
|
|
|
Peer Group (1)
|
|
100
|
|
103
|
|
211
|
|
280
|
|
279
|
|
205
|
|
|
Dow Jones US Home
Construction Index
|
|
100
|
|
92
|
|
180
|
|
243
|
|
280
|
|
222
|
|
(1) Peer Group consists of the
following companies: Beazer Homes USA,
Inc., Dominion Homes, Inc., Hovnanian Enterprises, Inc., MDC Holdings, Inc.,
Ryland Group, Inc., Toll Brothers, Inc., Standard Pacific Corporation,
Technical Olympic USA, Inc., M/I Schottenstein Homes, Inc. and WCI Communities,
Inc.
For the year ended December 31, 2006, we analyzed the composition of
the Peer Group we have historically used and determined that the Dow Jones U.S.
Construction (“DJUSHB”) Index provides a more comparable industry benchmark
18
than our listed
Peer Group noted in (1) above. As such,
in future periods, we intend to use the S&P 500 and DJUSHB Indices
only. We believe the homebuilders of the
DJUSHB are a more representative set of peer companies.
On February 16, 2007, the closing sales price of the common stock as
reported by the NYSE was $43.56 per share. At that date, there were
approximately 285 owners of record and approximately 5,500 beneficial owners of
common stock.
The transfer agent for our common stock is Mellon
Investor Services LLC, 85 Challenger Road, Ridgefield Park, NJ 07660 (www.melloninvestor.com).
We have not declared cash dividends for the past nine years, nor do we
intend to declare cash dividends in the foreseeable future. We plan to retain
the Company’s earnings to finance the continuing development of the business.
Future cash dividends, if any, will depend upon our financial condition,
results of operations, capital requirements, compliance with certain
restrictive debt covenants, as well as other factors considered relevant by our
Board of Directors. Certain of our debt instruments contain restrictions on the
payment of cash dividends. See “Management’s Discussion and Analysis of
Financial Condition and Results of Operations — Liquidity and Capital Resources”
and Note 6 — Senior Notes, in the accompanying consolidated financial
statements.
Issuer Purchases of Equity Securities:
We did not acquire any of our own securities during
the three months ended December 31, 2006.
In November 2004, we announced that the Board of
Directors had approved a new stock buyback program, authorizing the expenditure
of up to $50 million to repurchase shares of our common stock. The program was completed in February 2006,
with the repurchase of 601,000 shares at an average price of $59.21.
On February 21, 2006, we announced that the Board of
Directors approved a new stock repurchase program, authorizing the expenditure
of up to $100 million to repurchase shares of our common stock. In August 2006, the Board of Directors
authorized an additional $100 million under this program. There is no stated expiration date for this
program. In the first quarter of 2006,
we repurchased 255,000 shares at an average price of $53.77 under this
program. In the second quarter of 2006,
we repurchased 1,000,000 shares from John R. Landon, our former Co-CEO and
Co-Chairman, for $52.19 per share. In
August 2006, we repurchased 100,000 shares at an average price of $38.96 per
share. As of December 31, 2006, we had
approximately $130.2 million available to repurchase shares under this program.
Reference is made to Note 6 of the consolidated
financial statements included in this Annual Report on Form 10-K. This note discusses limitations on our
ability to pay dividends.
Item 6. Selected Financial Data
The following table presents selected historical consolidated financial
and operating data of Meritage Homes Corporation and subsidiaries as of and for
each of the last five years ended December 31, 2006. The financial data has been
derived from our consolidated financial statements and related notes for the
periods presented, audited by our independent registered public accounting
firms. This table should be read in conjunction with “Management’s Discussion
and Analysis of Financial Condition and Results of Operations” and the
consolidated financial statements and related notes included elsewhere in this
Annual Report. These historical results may not be indicative of future
results.
19
The data in the table includes the operations of Hammonds Homes,
Perma-Bilt Homes, Citation Homes, Colonial Homes and Greater Homes since their
dates of acquisition, July 2002, October 2002, January 2004, February 2005 and
September 2005, respectively.
|
|
|
Historical Consolidated Financial Data
Years Ended December 31,
|
|
|
|
|
($in thousands, except per share amounts )
|
|
|
|
|
2006
|
|
2005
|
|
2004
|
|
2003
|
|
2002
|
|
|
Statement
of Earnings Data:
|
|
|
|
|
|
|
|
|
|
|
|
|
Total closing
revenue
|
|
$
|
3,461,320
|
|
$
|
3,001,102
|
|
$
|
2,040,004
|
|
$
|
1,471,001
|
|
$
|
1,119,817
|
|
|
Total cost of
closings
|
|
(2,748,690
|
)
|
(2,294,112
|
)
|
(1,631,534
|
)
|
(1,178,484
|
)
|
(904,921
|
)
|
|
Gross profit
|
|
712,630
|
|
706,990
|
|
408,470
|
|
292,517
|
|
214,896
|
|
|
|
|
|
|
|
|
|
|
|
|
|
|
|
Commissions and
other sales costs
|
|
(216,341
|
)
|
(160,114
|
)
|
(116,527
|
)
|
(92,904
|
)
|
(65,291
|
)
|
|
General and
administrative expenses
|
|
(164,477
|
)
|
(124,979
|
)
|
(79,257
|
)
|
(53,929
|
)
|
(41,496
|
)
|
|
Earnings from
unconsolidated entities, net
|
|
20,364
|
|
18,337
|
|
2,788
|
|
1,743
|
|
1,383
|
|
|
Other income,
net
|
|
11,833
|
|
7,468
|
|
9,284
|
|
4,033
|
|
4,052
|
|
|
Loss on
extinguishment of debt
|
|
—
|
|
(31,477
|
)
|
—
|
|
—
|
|
—
|
|
|
Earnings before
income taxes
|
|
364,009
|
|
416,225
|
|
224,758
|
|
151,460
|
|
113,544
|
|
|
Income taxes
|
|
(138,655
|
)
|
(160,560
|
)
|
(85,790
|
)
|
(57,054
|
)
|
(43,607
|
)
|
|
|
|
|
|
|
|
|
|
|
|
|
|
|
Net earnings
|
|
$
|
225,354
|
|
$
|
255,665
|
|
$
|
138,968
|
|
$
|
94,406
|
|
$
|
69,937
|
|
|
|
|
|
|
|
|
|
|
|
|
|
|
|
Earnings per
common share: (1)
|
|
|
|
|
|
|
|
|
|
|
|
|
Basic
|
|
$
|
8.52
|
|
$
|
9.48
|
|
$
|
5.33
|
|
$
|
3.62
|
|
$
|
2.82
|
|
|
Diluted
|
|
$
|
8.32
|
|
$
|
8.88
|
|
$
|
5.03
|
|
$
|
3.42
|
|
$
|
2.66
|
|
|
|
|
|
|
|
|
|
|
|
|
|
|
|
Balance
Sheet Data (December 31):
|
|
|
|
|
|
|
|
|
|
|
|
|
Real estate
|
|
$
|
1,530,602
|
|
$
|
1,390,803
|
|
$
|
867,218
|
|
$
|
678,011
|
|
$
|
484,970
|
|
|
Total assets
|
|
$
|
2,170,525
|
|
$
|
1,971,357
|
|
$
|
1,265,394
|
|
$
|
954,539
|
|
$
|
691,788
|
|
|
Senior notes,
loans payable and other borrowings
|
|
$
|
733,276
|
|
$
|
592,124
|
|
$
|
471,415
|
|
$
|
351,491
|
|
$
|
264,927
|
|
|
Total
liabilities
|
|
$
|
1,163,693
|
|
$
|
1,120,352
|
|
$
|
742,839
|
|
$
|
542,644
|
|
$
|
374,480
|
|
|
Stockholders’ equity
|
|
$
|
1,006,832
|
|
$
|
851,005
|
|
$
|
522,555
|
|
$
|
411,895
|
|
$
|
317,308
|
|
|
|
|
Historical Consolidated Financial Data
Years Ended December 31,
|
|
|
|
|
($ in thousands, except per share amounts)
|
|
|
|
|
2006
|
|
2005
|
|
2004
|
|
2003
|
|
2002
|
|
|
Cash
Flow Data:
|
|
|
|
|
|
|
|
|
|
|
|
|
Cash provided by
(used in):
|
|
|
|
|
|
|
|
|
|
|
|
|
Operating activities
|
|
$
|
(21,964
|
)
|
$
|
72,243
|
|
$
|
63,869
|
|
$
|
(50,302
|
)
|
$
|
1,050
|
|
|
Investing activities
|
|
(57,720
|
)
|
(247,427
|
)
|
(85,502
|
)
|
(35,812
|
)
|
(149,691
|
)
|
|
Financing
activities
|
|
70,582
|
|
193,120
|
|
64,710
|
|
84,313
|
|
151,858
|
|
|
|
|
|
|
|
|
|
|
|
|
|
|
|
|
|
|
(1) 2002-2004 amounts have been adjusted to
reflect a 2-for-1 stock split in the form of a stock dividend that occurred in
January 2005. There were no cash dividends paid during 2002-2006.
20
Item 7. Management’s Discussion and Analysis of
Financial Condition and Results of Operations
Overview
We are a leading designer
and builder of single-family homes in the rapidly growing western and southern
United States, based on the number of home closings and revenue. We focus on
providing a broad range of first-time, move-up, active adult and luxury homes
to our targeted customer base. We believe that the relatively strong
population, job and income growth as well as the favorable migration
characteristics of our markets will continue to provide significant long-term
growth opportunities for us. At December 31, 2006, we were actively selling
homes in 213 communities, with base prices ranging from $100,000 to
$1,176,000. We operate in the following
geographic regions, which are presented as our reportable business segments:
|
West:
|
|
California and Nevada
|
|
Central:
|
|
Arizona, Texas and Colorado
|
|
East:
|
|
Florida
|
We achieved record home closings and revenue in 2006. Home closing
revenue increased 15% in 2006 to $3.4 billion; however, net earnings decreased
12% to $225 million due primarily to $78 million of inventory impairments and
write-offs of option deposits and pre-acquisition costs. In 2006 we closed
10,487 homes, up 11% from 2005, while new orders received of 7,778 were down
26% from 2005.
During the latter half
of 2006, our markets experienced significant declines in orders due to the
weakened homebuilding market and high cancellation rates. This decline in net orders contributed to the
42% decrease of units in backlog and 45% decrease of backlog value at December
31, 2006 as compared to the prior year.
At December 31, 2006, we had
a backlog of 3,685 homes with a value of approximately $1.2 billion. Our lower
backlog reflects the slowdown the homebuilding industry as a whole experienced
in 2006.
In 2006, we received 7,778
net new orders valued at $2.5 billion, decreases of 26% and 31%, respectively,
compared to 2005, due to a slower sales pace in 2006 from the weakened
homebuilding market, coupled with higher cancellation rates. Cancellation rates were 35% of gross unit
sales in 2006 as compared to 24% in 2005.
During the fourth quarter of 2006, we experienced a continued slowdown
in our markets in the pace of new orders compounded by increased cancellations
when compared to the abnormally high level of orders in the fourth quarter of
2005, resulting in decreases in the number of homes ordered of 42% and 51% in
the value of those orders. It is our expectation that during 2007 cancellation
rates will begin to trend toward historical average levels of less than 25%.
During January 2007, demand continued to moderate from
the prior year’s pace of sales orders. We believe our experiences are
consistent with the overall trends in the homebuilding market. In addition, we
are offering our customers increased incentives and discounts to remain
competitive in the currently weak market.
Our Strategy and Other Recent
Developments
In general, we focus on
minimizing land risk by purchasing property only after full entitlements have
been obtained and typically begin development or construction immediately after
close. We acquire land primarily through rolling option contracts, allowing us
to purchase individual lots as our building needs dictate. These arrangements
allow us to control lot inventory typically on a non-recourse basis without
incurring the risks of land ownership. At December 31, 2006, we owned or had
options to acquire approximately 44,075 housing lots, of which approximately
83% were under option and land purchase contracts. We believe that the lots we
own or have the right to acquire represent an approximate four- to five-year
supply, and that we are well positioned for future growth.
On February 23, 2007, we completed the sale of an
aggregate principal amount of $150 million of 7.73% senior subordinated notes
due 2017 in a private placement. The notes were issued at par and
resulted in net proceeds to the Company of $147.2 million, after deduction
of fees, commmissions and expenses. We used the proceeds from the sale of
these senior subordinated notes to paydown our revolving credit facility.
This discussion and analysis of financial condition
and results of operations is based upon our consolidated financial statements,
which have been prepared in accordance with accounting principles generally
accepted in the United States of America.
21
Critical
Accounting Policies
We have established various
accounting policies that govern the application of United States generally
accepted accounting principles (“GAAP”) in the preparation and presentation of
our consolidated financial statements. Our significant accounting policies are
described in Note 1 of the consolidated financial statements. Certain of these
policies involve significant judgments, assumptions and estimates by management
that may have a material impact on the carrying value of certain assets and
liabilities, and revenue and costs. We are subject to uncertainties such as the
impact of future events, economic, environmental and political factors and
changes in our business environment; therefore, actual results could differ
from these estimates. Accordingly, the accounting estimates used in the
preparation of our financial statements will change as new events occur, as
more experience is acquired, as additional information is obtained and as our
operating environment changes. Changes in estimates are made when circumstances
warrant. Such changes in estimates and refinements in estimation methodologies
are reflected in our reported results of operations and, if material, the effects
of changes in estimates are disclosed in the notes to the consolidated
financial statements. The judgments, assumptions and estimates we use and
believe to be critical to our business are based on historical experience,
knowledge of the accounts and other factors, which we believe to be reasonable
under the circumstances. Because of the nature of the judgments and assumptions
we have made, actual results may differ from these judgments and estimates,
which could have a material impact on the carrying values of assets and
liabilities and the results of our operations. Our inability to accurately
estimate stock-based compensation, expenses, accruals, or an impairment of real
estate or goodwill could result in charges, or income, in future periods, which
relate to activities or transactions in a preceding period. The estimates and
assumptions we make relating to our application of FIN 46R, if not accurate,
could result in us incorrectly including, or excluding, certain
contractual land acquisition arrangements or investments in unconsolidated
entities as variable interest entities in, or from, respectively, our
consolidated financial statements.
The accounting policies that we deem most critical to
us, and involve the most difficult, subjective or complex judgments, include:
Revenue
Recognition
In accordance with SFAS No. 66, Accounting
for Sales of Real Estate, we recognize revenue from home sales when
title passes to the homeowner, the homeowner’s initial and continuing
investment is adequate to demonstrate a commitment to pay for the home, the receivable
from the homeowner is not subject to future subordination and we do not have a
substantial continuing involvement with the sold home. These conditions are typically achieved when a
home closes.
Revenue from land sales is recognized when a
significant down payment is received, the earnings process is relatively
complete, title passes and collectibility of the receivable is reasonably
assured.
Real Estate
Real
estate is stated at cost and includes the costs of land acquisition, land
development and home construction, capitalized interest, real estate taxes and
direct overhead costs incurred during development and home construction that
benefit the entire community. Land and
development costs are typically allocated to individual lots on a relative
value basis. The costs of these lots are transferred to homes under
construction when construction begins.
Home construction costs are accumulated on a per-home basis. Cost of home closings includes the specific
construction costs of the home and all related land acquisition, land
development and other common costs (both incurred and estimated to be incurred)
based upon the total number of homes expected to be closed in each community. Any changes to the estimated total
development costs of a community are allocated on a relative value basis to the
remaining homes in the community. When a
home is closed, we may have not yet paid all costs incurred to complete
it. At the time of close, we record a
liability and as a charge to cost of sales the amount we determine will
ultimately be paid to complete the home.
In
accordance with Statement of Financial Accounting Standards (“SFAS”) No. 144, Accounting for the Impairment of Disposal of
Long-Lived Assets, land inventory and related communities under
development are reviewed for potential write-downs when impairment indicators
are present. SFAS No. 144 requires that
in the event the undiscounted cash flows projected for those assets are less
than their carrying amounts, impairment charges are to be recorded if the fair
value of such assets is less than their carrying amounts. Our determination of fair value is based on
projections and estimates, including future sales prices, construction costs
and absorption rates. Changes in these
expectations may lead to a change in the outcome of our impairment
analysis. Our analysis is completed at
community level; therefore, changes in local conditions may effect one of
several of our communities. For those assets
deemed to be impaired, the impairment to be recognized is measured by the
amount by which the carrying amount of the assets exceeds the fair value of the
assets.
During
2006, we recorded $23.7 million of such impairment charges related to our real
estate inventories. Additionally, we
wrote off $54.6 million of deposits and pre-acquisition costs relating to
projects that were no longer feasible.
The impairment charges were based on our fair value calculations, which
are affected by current market conditions, assumptions and expectations, all of
which are highly subjective and may differ significantly from actual results if
market conditions change.
22
Goodwill
We
test goodwill for impairment annually or more frequently if an event occurs or
circumstances change that more likely than not reduce the value of a reporting
unit below its carrying value. For
purposes of goodwill impairment testing, we compare the fair value of each
reporting unit with its carrying amount, including goodwill. Our operations in each state are considered a
reporting unit. The fair value of
reporting units is determined using various valuation methodologies, including
discounted future cash flow models and enterprise value computations. If the carrying amount of a reporting unit
exceeds its fair value, goodwill is considered impaired. If goodwill is considered impaired, the
impairment loss to be recognized is measured by the amount by which the
carrying amount of the goodwill exceeds implied fair value of that goodwill.
Inherent
in our fair value determinations are certain judgements and estimates,
including projections of future cash flows, the discount rate reflecting the
risk inherent in future cash flows, the interpretation of current economic
indicators and market valuations and our strategic plans with regard to our
operations. A change in these underlying
assumptions may cause a change in the results of our analysis, which could
cause the fair value of one or more reporting units to be less than their
respective carrying amounts. In
addition, to the extent that there are significant changes in market conditions
or overall economic conditions or our strategic plans change, it is possible
that our conclusion regarding goodwill impairment could change, which could
have a material adverse effect on our financial position and results of
operations.
Our
goodwill has been assigned to reporting units in different geographic
locations. Therefore, potential goodwill
impairment charges resulting from changes in local market and/or local economic
conditions or changes in our strategic plans may be isolated to one or a few of
our reporting units. However, a
widespread decline in the homebuilding industry or a significant deterioration
of general economic conditions could have a negative impact on the estimated
fair value of several or all of our reporting units.
While
we believe that no goodwill impairment existed as of December 31, 2006, future
economic or financial developments, including general interest rate increases
or poor performance in either the national economy or individual local
economies, could lead to impairment of goodwill in future periods.
Warranty Reserves
We
use subcontractors for nearly all aspects of home construction. Although our contracts generally require
subcontractors to repair and replace any product or labor defects, we are
generally responsible for such repairs.
As such, warranty reserves are recorded to cover potential costs for
materials and labor as they relate to warranty-type claims expected to be incurred
subsequent to the delivery of a home to the homeowner. Reserves are determined based upon the
Company’s and industry-wide historical data and trends with respect to product
types and geographical areas.
At
December 31, 2006, our warranty reserve was $28.4 million. While we believe that the warranty reserve is
sufficient to cover our projected costs, there can be no assurances that
historical data and trends will accurately predict our actual warranty costs. Furthermore, there can be no assurances that
future economic or financial developments might not lead to a significant
change in the reserve.
Off-Balance Sheet Arrangements
We
invest in entities that acquire and develop land for sale to us in connection
with our homebuilding operations or for sale to third parties. Our partners
generally are unrelated homebuilders, land sellers and financial or other
strategic partners.
Most
of the unconsolidated entities through which we acquire and develop land are
accounted for by the equity method of accounting because the criteria for
consolidation set forth in FASB Interpretation No. 46 (revised December 2003), “Consolidation of Variable Interest Entities” (FIN
46R) have not been met. We record our investments in these entities in our
consolidated balance sheets as “Investments in unconsolidated entities” and our
pro rata share of the entities’ earnings or losses in our consolidated
statements of earnings as “Earnings from unconsolidated entities, net.”
We
use our business judgement to determine if we are the primary beneficiary of,
or have a controlling interest in, an unconsolidated entity. Factors considered in our determination
include the profit/loss sharing terms of the entity, experience and financial
condition of the other partners, voting rights, involvement in day-to-day
capital and operating decisions and continuing involvement.
As
of December 31, 2006, we believe that the equity method of accounting is
appropriate for our investments in unconsolidated entities where we are not the
primary beneficiary, we do not have a controlling interest, and our ownership
interest exceeds 20%. At December 31,
2006, the unconsolidated entitites in which we had equity investments had total
23
assets of $763.9 million
and total liabilities of $497.8 million.
See Note 4 in the accompanying financial statements for additional
information related to our investments in unconsolidated entities.
We
also enter into option or purchase agreements to acquire land or lots from
entities, for which we generally pay non-refundable deposits. We analyze these
agreements under FIN 46R to determine whether we are the primary beneficiary of
the VIE (as defined) created as result of these agreements using a model
developed by management. If we are deemed to be the primary beneficiary of the
VIE because we are obligated to absorb the majority of the expected losses,
receive the majority of the residual returns, or both, we will consolidate the
VIE in our consolidated financial statements. See Note 3 in the accompanying
financial statements for additional information related to our off-balance
sheet arrangements.
Valuation of Deferred Tax Assets
We
account for income taxes using the asset and liability method, which requires
that deferred tax assets and liabilities be recognized based on future tax
consequences of both temporary differences between the financial statement
carrying amounts of existing assets and liabilities and their respective tax
bases. Deferred tax assets and
liabilities are measured using enacted tax rates expected to apply in the years
in which the temporary differences are expected to be recovered or
settled. The effect on deferred tax
assets and liabilities of a change in tax rates is recognized in earnings in
the period when the changes are enacted.
In
accordance with Statement of Financial Accounting Standards (“SFAS”) No. 109, “Accounting
for Income Taxes,” we assess our ability to realize deferred tax assets
primarily based on earnings history, future earnings potential, the reversal of
taxable temporary differences and available tax planning strategies. At December 31, 2006, our net deferred tax
asset was $28.1 million. Based on our
assessment, it appears more likely than not that the net deferred tax asset
will be fully realized and does not require a valuation allowance.
Share-Based Payments
We have stock options and restricted common stock (“nonvested
shares”) outstanding under two stock compensation plans. Per the terms of these plans, the exercise
price of our stock options may not be less than the closing market value of our
common stock on the date of the grant.
No options granted under the plans may be exercised within one year from
the date of the grant. Thereafter,
exercises are permitted in pre-determined installments based upon a vesting
schedule established at the time of grant.
Each stock option expires on a date determined at the time of the grant,
but not to exceed seven years from the date of the grant.
Prior to January 1, 2006, we accounted for stock
option awards granted under our compensation plans in accordance with the
recognition and measurement provisions of APB Opinion No. 25, Accounting for Stock Issued to Employees, and related
Interpretations, as permitted by SFAS No. 123, Accounting
for Stock-Based Compensation.
Share-based employee compensation expense was not recognized in our
consolidated statements of earnings prior to January 1, 2006, as our stock
options had an exercise price equal to or greater than the market value of our
common stock on the date of the grant and therefore, no intrinsic value. On January 1, 2006, we adopted the provisions
of SFAS No. 123 (revised 2004), Share-Based Payment,
(“SFAS No. 123R”) using the modified-prospective-transition method. Under this transition method, our
compensation expense recorded in 2006 includes both charges related to the
vesting of options and restricted stock granted since the adoption of SFAS No.
123R as well as compensation cost related to the unvested portions of options
granted prior to January 1, 2006. For
all compensation cost recorded, fair value of the options was determined using
the provisions of SFAS No. 123R. In
accordance with the modified-prospective-transition method, results for prior
periods have not been restated.
The calculation of employee compensation expense involves
estimates that require management judgements.
These estimates include determining the value of each of our stock
options on the date of grant using a Black-Scholes option-pricing model
discussed in Note 9. The fair value of
our stock options, which typically vest ratably over a five-year period, is
expensed on a straight-line basis over the vesting life of the options. Expected volatility is based on a composite
of (1) historical volatility of our stock and (2) implied volatility from our
traded options. The risk-free rate for
periods within the contractual life of the stock option award is based on the
rate of a zero-coupon Treasury bond on the date the stock option is granted
with a maturity equal to the expected term of the stock option. We use historical data to estimate stock
option exercises and forfeitures within our valuation model. The expected life of our stock option awards
is derived from historical experience under our share-based payment plans and
represents the period of time that we expect our stock options to be
outstanding.
24
Home Closing Revenue, Home Orders and Order Backlog –
Segment Analysis
The tables
provided below show operating and financial data regarding our homebuilding
activities (dollars in thousands).
|
|
|
Years Ended December 31,
|
|
|
|
|
2006
|
|
2005
|
|
2004
|
|
|
Home
Closing Revenue
|
|
|
|
|
|
|
|
|
Total
|
|
|
|
|
|
|
|
|
Dollars
|
|
$
|
3,444,286
|
|
$
|
2,996,946
|
|
$
|
2,015,742
|
|
|
Homes closed
|
|
10,487
|
|
9,406
|
|
7,254
|
|
|
Average sales price
|
|
$
|
328.4
|
|
$
|
318.6
|
|
$
|
277.9
|
|
|
|
|
|
|
|
|
|
|
|
West
Region
|
|
|
|
|
|
|
|
|
|
|
|
|
|
|
|
|
|
California
|
|
|
|
|
|
|
|
|
Dollars
|
|
$
|
820,583
|
|
$
|
947,228
|
|
$
|
628,324
|
|
|
Homes closed
|
|
1,471
|
|
1,627
|
|
1,367
|
|
|
Average sales price
|
|
$
|
557.8
|
|
$
|
582.2
|
|
$
|
459.6
|
|
|
|
|
|
|
|
|
|
|
|
Nevada
|
|
|
|
|
|
|
|
|
Dollars
|
|
$
|
244,343
|
|
$
|
201,907
|
|
$
|
120,576
|
|
|
Homes closed
|
|
620
|
|
541
|
|
404
|
|
|
Average sales price
|
|
$
|
394.1
|
|
$
|
373.2
|
|
$
|
298.5
|
|
|
|
|
|
|
|
|
|
|
|
West
Region Totals
|
|
|
|
|
|
|
|
|
Dollars
|
|
$
|
1,064,926
|
|
$
|
1,149,135
|
|
$
|
748,900
|
|
|
Homes closed
|
|
2,091
|
|
2,168
|
|
1,771
|
|
|
Average sales price
|
|
$
|
509.3
|
|
$
|
530.0
|
|
$
|
422.9
|
|
|
|
|
|
|
|
|
|
|
|
Central
Region
|
|
|
|
|
|
|
|
|
|
|
|
|
|
|
|
|
|
Arizona
|
|
|
|
|
|
|
|
|
Dollars
|
|
$
|
1,102,662
|
|
$
|
873,137
|
|
$
|
585,743
|
|
|
Homes closed
|
|
3,355
|
|
3,122
|
|
2,331
|
|
|
Average sales price
|
|
$
|
328.7
|
|
$
|
279.7
|
|
$
|
251.3
|
|
|
|
|
|
|
|
|
|
|
|
Texas
|
|
|
|
|
|
|
|
|
Dollars
|
|
$
|
996,739
|
|
$
|
787,204
|
|
$
|
681,099
|
|
|
Homes closed
|
|
4,263
|
|
3,576
|
|
3,152
|
|
|
Average sales price
|
|
$
|
233.8
|
|
$
|
220.1
|
|
$
|
216.1
|
|
|
|
|
|
|
|
|
|
|
|
Colorado
|
|
|
|
|
|
|
|
|
Dollars
|
|
$
|
40,875
|
|
$
|
2,809
|
|
N/A
|
|
|
Homes closed
|
|
112
|
|
8
|
|
N/A
|
|
|
Average sales price
|
|
$
|
365.0
|
|
$
|
351.1
|
|
N/A
|
|
|
|
|
|
|
|
|
|
|
|
Central
Region Totals
|
|
|
|
|
|
|
|
|
Dollars
|
|
$
|
2,140,276
|
|
$
|
1,663,150
|
|
$
|
1,266,842
|
|
|
Homes closed
|
|
7,730
|
|
6,706
|
|
5,483
|
|
|
Average sales price
|
|
$
|
276.9
|
|
$
|
248.0
|
|
$
|
231.0
|
|
|
|
|
|
|
|
|
|
|
|
East
Region
|
|
|
|
|
|
|
|
|
|
|
|
|
|
|
|
|
|
Florida
|
|
|
|
|
|
|
|
|
Dollars
|
|
$
|
239,084
|
|
$
|
184,661
|
|
N/A
|
|
|
Homes closed
|
|
666
|
|
532
|
|
N/A
|
|
|
Average sales
price
|
|
$
|
359.0
|
|
$
|
347.1
|
|
N/A
|
|
25
|
|
|
Years Ended December 31,
|
|
|
|
|
2006
|
|
2005
|
|
2004
|
|
|
Home
Orders
|
|
|
|
|
|
|
|
|
Total
|
|
|
|
|
|
|
|
|
Dollars
|
|
$
|
2,462,747
|
|
$
|
3,580,855
|
|
$
|
2,604,948
|
|
|
Homes ordered
|
|
7,778
|
|
10,571
|
|
9,007
|
|
|
Average sales price
|
|
$
|
316.6
|
|
$
|
338.7
|
|
$
|
289.2
|
|
|
|
|
|
|
|
|
|
|
|
West
Region
|
|
|
|
|
|
|
|
|
|
|
|
|
|
|
|
|
|
California
|
|
|
|
|
|
|
|
|
Dollars
|
|
$
|
529,435
|
|
$
|
976,921
|
|
$
|
821,266
|
|
|
Homes ordered
|
|
983
|
|
1,646
|
|
1,582
|
|
|
Average sales price
|
|
$
|
538.6
|
|
$
|
593.5
|
|
$
|
519.1
|
|
|
|
|
|
|
|
|
|
|
|
Nevada
|
|
|
|
|
|
|
|
|
Dollars
|
|
$
|
139,668
|
|
$
|
249,104
|
|
$
|
146,141
|
|
|
Homes ordered
|
|
328
|
|
653
|
|
417
|
|
|
Average sales price
|
|
$
|
425.8
|
|
$
|
381.5
|
|
$
|
350.5
|
|
|
|
|
|
|
|
|
|
|
|
West
Region Totals
|
|
|
|
|
|
|
|
|
Dollars
|
|
$
|
669,103
|
|
$
|
1,226,025
|
|
$
|
967,407
|
|
|
Homes ordered
|
|
1,311
|
|
2,299
|
|
1,999
|
|
|
Average sales price
|
|
$
|
510.4
|
|
$
|
533.3
|
|
$
|
483.9
|
|
|
|
|
|
|
|
|
|
|
|
Central
Region
|
|
|
|
|
|
|
|
|
|
|
|
|
|
|
|
|
|
Arizona
|
|
|
|
|
|
|
|
|
Dollars
|
|
$
|
611,266
|
|
$
|
1,174,452
|
|
$
|
884,771
|
|
|
Homes ordered
|
|
1,833
|
|
3,558
|
|
3,490
|
|
|
Average sales price
|
|
$
|
333.5
|
|
$
|
330.1
|
|
$
|
253.5
|
|
|
|
|
|
|
|
|
|
|
|
Texas
|
|
|
|
|
|
|
|
|
Dollars
|
|
$
|
1,069,437
|
|
$
|
983,579
|
|
$
|
752,770
|
|
|
Homes ordered
|
|
4,299
|
|
4,264
|
|
3,518
|
|
|
Average sales price
|
|
$
|
248.8
|
|
$
|
230.7
|
|
$
|
214.0
|
|
|
|
|
|
|
|
|
|
|
|
Colorado
|
|
|
|
|
|
|
|
|
Dollars
|
|
$
|
47,836
|
|
$
|
14,631
|
|
N/A
|
|
|
Homes ordered
|
|
125
|
|
40
|
|
N/A
|
|
|
Average sales price
|
|
$
|
382.7
|
|
$
|
365.8
|
|
N/A
|
|
|
|
|
|
|
|
|
|
|
|
Central
Region Totals
|
|
|
|
|
|
|
|
|
Dollars
|
|
$
|
1,728,539
|
|
$
|
2,172,662
|
|
$
|
1,637,541
|
|
|
Homes ordered
|
|
6,257
|
|
7,862
|
|
7,008
|
|
|
Average sales price
|
|
$
|
276.3
|
|
$
|
276.3
|
|
$
|
233.7
|
|
|
|
|
|
|
|
|
|
|
|
East
Region
|
|
|
|
|
|
|
|
|
|
|
|
|
|
|
|
|
|
Florida
|
|
|
|
|
|
|
|
|
Dollars
|
|
$
|
65,105
|
|
$
|
182,168
|
|
N/A
|
|
|
Homes ordered
|
|
210
|
|
410
|
|
N/A
|
|
|
Average sales
price
|
|
$
|
310.0
|
|
$
|
444.3
|
|
N/A
|
|
26
|
|
|
At December 31,
|
|
|
|
|
2006
|
|
2005
|
|
2004
|
|
|
Order
Backlog
|
|
|
|
|
|
|
|
|
Total
|
|
|
|
|
|
|
|
|
Dollars
|
|
$
|
1,200,061
|
|
$
|
2,181,600
|
|
$
|
1,320,951
|
|
|
Homes in backlog
|
|
3,685
|
|
6,394
|
|
4,408
|
|
|
Average sales price
|
|
$
|
325.7
|
|
$
|
341.2
|
|
$
|
299.7
|
|
|
|
|
|
|
|
|
|
|
|
West
Region
|
|
|
|
|
|
|
|
|
|
|
|
|
|
|
|
|
|
California
|
|
|
|
|
|
|
|
|
Dollars
|
|
$
|
129,816
|
|
$
|
420,964
|
|
$
|
391,271
|
|
|
Homes in backlog
|
|
226
|
|
714
|
|
695
|
|
|
Average sales price
|
|
$
|
574.4
|
|
$
|
589.6
|
|
$
|
563.0
|
|
|
|
|
|
|
|
|
|
|
|
Nevada
|
|
|
|
|
|
|
|
|
Dollars
|
|
$
|
21,725
|
|
$
|
126,400
|
|
$
|
79,203
|
|
|
Homes in backlog
|
|
57
|
|
349
|
|
237
|
|
|
Average sales price
|
|
$
|
381.1
|
|
$
|
362.2
|
|
$
|
334.2
|
|
|
|
|
|
|
|
|
|
|
|
West
Region Totals
|
|
|
|
|
|
|
|
|
Dollars
|
|
$
|
151,541
|
|
$
|
547,364
|
|
$
|
470,474
|
|
|
Homes in backlog
|
|
283
|
|
1,063
|
|
932
|
|
|
Average sales price
|
|
$
|
535.5
|
|
$
|
514.9
|
|
$
|
504.8
|
|
|
|
|
|
|
|
|
|
|
|
Central
Region
|
|
|
|
|
|
|
|
|
|
|
|
|
|
|
|
|
|
Arizona
|
|
|
|
|
|
|
|
|
Dollars
|
|
$
|
347,306
|
|
$
|
838,702
|
|
$
|
537,387
|
|
|
Homes in backlog
|
|
905
|
|
2,427
|
|
1,991
|
|
|
Average sales price
|
|
$
|
383.8
|
|
$
|
345.6
|
|
$
|
269.9
|
|
|
|
|
|
|
|
|
|
|
|
Texas
|
|
|
|
|
|
|
|
|
Dollars
|
|
$
|
582,163
|
|
$
|
509,465
|
|
$
|
313,090
|
|
|
Homes in backlog
|
|
2,209
|
|
2,173
|
|
1,485
|
|
|
Average sales price
|
|
$
|
263.5
|
|
$
|
234.5
|
|
$
|
210.8
|
|
|
|
|
|
|
|
|
|
|
|
Colorado
|
|
|
|
|
|
|
|
|
Dollars
|
|
$
|
18,783
|
|
$
|
11,822
|
|
N/A
|
|
|
Homes in backlog
|
|
45
|
|
32
|
|
N/A
|
|
|
Average sales price
|
|
$
|
417.4
|
|
$
|
369.4
|
|
N/A
|
|
|
|
|
|
|
|
|
|
|
|
Central
Region Totals
|
|
|
|
|
|
|
|
|
Dollars
|
|
$
|
948,252
|
|
$
|
1,359,989
|
|
$
|
850,477
|
|
|
Homes in backlog
|
|
3,159
|
|
4,632
|
|
3,476
|
|
|
Average sales price
|
|
$
|
300.2
|
|
$
|
293.6
|
|
$
|
244.7
|
|
|
|
|
|
|
|
|
|
|
|
East
Region
|
|
|
|
|
|
|
|
|
|
|
|
|
|
|
|
|
|
Florida
|
|
|
|
|
|
|
|
|
Dollars
|
|
$
|
100,268
|
|
$
|
274,247
|
|
N/A
|
|
|
Homes in backlog
|
|
243
|
|
699
|
|
N/A
|
|
|
Average sales
price
|
|
$
|
412.6
|
|
$
|
392.3
|
|
N/A
|
|
27
Home Closing Revenue. Companywide.
Home closing revenue increased 15% to a
Company record of $3.4 billion in 2006 from $3.0 billion in 2005. The factor
primarily leading to this increase was the strong demand and pricing power
relating to 2005 sales orders, which were realized in the 2006 closings. Average selling prices on homes closed rose
3% from 2005 to 2006 and we benefited from an 11% increase in the number of
homes closed in 2006 to 10,487 from 9,406 in 2005.
Home closing revenue
increased 49% to a Company record of $3.0 billion in 2005 from $2.0 billion in
2004. The factors primarily leading to
this increase were continued strong demand and our ability to raise prices
throughout many of our markets. Average
selling prices on homes closed rose 15% from 2004 to 2005 and we benefited from
a 30% increase in the number of homes closed in 2005 to 9,406 from 7,254 in
2004. Additionally, our two acquisitions
in Florida, though only included in our 2005 results for less than one year,
accounted for approximately 18% of our increase in home closing revenues in
2005.
West. In 2006, the West Region experienced a 7%
revenue decline. As some markets in the
western United States were first to feel the impacts of the downturn in the
housing markets, closings in 2006 in both dollars and volume reflect our
reduced pricing power and high cancellations, particularly in California. The
13% decrease in California home closing revenue to $820.6 million in 2006
compared to $947.2 million in 2005 reflects a 10% decrease in the number of
homes closed and a 4% decrease in the average selling price of homes
closed. In Nevada, strong sales
performance in early 2006 resulted in the number of homes closed increasing 15%
in 2006, producing home closing revenue of $244.3 million, an increase of 21%
compared to 2005.
In 2005, the West Region
experienced 53% revenue growth to $1.1 billion as compared to $748.9 million in
2004. The strong performance of the West
Region in 2005 was primarily attributed to exceptionally high demand and
pricing power as reflected in the number of closings and increased average
sales price. The 51% increase in
California home closing revenue to $947.2 million in 2005 compared to $628.3
million in 2004 reflected a 19% increase in the number of homes closed and a
27% increase in the average selling price of homes closed. In Nevada, the number of homes closed
increased 34% in 2005, producing home closing revenue of $201.9 million, an
increase of 67% compared to 2004.
Central. In 2006, sales mix and strong 2005 orders were
the primary drivers behind the overall increased results in the Central
Region. Home closing revenue increased
$477.1 to $2.1 billion as compared to $1.7 billion in 2005. Both Arizona and Texas had a year of record
closings, with 3,355 and 4,263 homes closed, respectively, increases of 7% and
19% over 2005. Additionally, average
sales price increases of 18% and 6%, respectively, in Arizona and Texas in 2006
as compared to 2005 further contributed to the year’s strong performance.
In 2005, healthy demand
and pricing power resulted in strong results in the Central Region. Home closing revenue increased $396.3 to $1.7
billion as compared to $1.3 billion in 2004.
In Arizona, home closing revenue increased $287.4 million, due to
increases of 34% and 11% in the number of homes closed and average sales price,
respectively. These strong results
reflected the pricing power and limited homes inventory availability in this
local market during 2005. In a very
competitive Texas market, where we expanded our entry-level and semi-custom
luxury offerings in addition to our primary focus on move-up homes, we closed
3,576 homes in 2005 for $787.2 million in revenue, increases of 13% and 16%,
respectively.
East. During 2006, we closed 666 homes, generating
revenue of $239.1 million. The 29%
increase in revenue is due to both increased volume and the higher average
sales price of $359,000 as compared to $347,100 in 2005.
In 2005, as a result of our two acquisitions and the
commencement of closings in our Orlando start-up division, we produced home
closing revenue of $184.7 million on 532 home closings.
Home Orders. Companywide. Home
orders for any period represent the aggregate sales price of all homes ordered
by customers, net of cancellations. We do not include orders contingent upon
the sale of a customer’s existing home as a sales contract until the
contingency is removed. Historically, we have experienced a cancellation rate
of less than 25% of gross sales, although our rate in 2006 was 35%. In 2006, we
took home orders for 7,778 homes, a decrease of 26% compared to the 10,571 home
orders in 2005 primarily due to the decline in demand in many of our
homebuilding markets, partially offset by home sales at new communities, which
increased by 16% to 213 actively
selling communities at December 31, 2006.
28
In
2005, we took home orders for 10,571 homes, an increase of 17% compared to the
9,007 home orders in 2004 primarily due to strong demand for homes in most of
our markets and a 32% increase in the number of actively selling communities to
184 at December 31, 2005.
West. Our West Region posted significantly weaker
order volume in 2006, decreasing 45% in the value of home orders, with our
fourth quarter order value for this region also falling 45%, reflecting the
continued slowing from the unusually robust sales pace seen in previous years
in these markets. We expect home order rates to return to more normal and
sustainable levels in late 2007 or early 2008 as market conditions adjust and
cancellation rates stabilize to more typical levels.
Our
West Region posted strong order growth in 2005, increasing 27% in the value of
home orders and 15% in the number of homes ordered. However, our fourth quarter 2005 order value
for this region fell 41% year over year, reflecting the start of the slowing
trend in the homebuilding market as a whole and this Region in particular.
Central. In 2006, a weaker housing
market in the Arizona Region contributed to a 48% decrease in the value of home
orders in Arizona. While average sales
price per home held steady due to changes in sales mix offsetting price
decreases, the number of home orders declined 1,605 to 6,257 for the Region,
reflecting the deterioration in the local market from the strong demand a year
earlier. In Texas, despite a very
competitive market, we experienced solid demand in all of our markets and
received orders for 4,299 homes valued at $1.1 billion in 2006, increases of 1%
and 9%, respectively, compared to 4,264 home orders with a value of $983.6 million
in 2005. Additionally, the Central Region increased its number of
actively-selling communities to 169 as of December 31, 2006, as compared to 146
a year ago, also offsetting slower sales and high cancellations.
In
2005, the Central Region experienced a 33% increase in the value of home orders
as compared to 2004. The increase was
primarily due to particularly strong results in Arizona. The value of home orders in Arizona rose 33%
in 2005 due, in part, to a 35% increase in the number of actively-selling
communities and the diversification of our product offerings. We were able to take advantage of emerging
demographic trends such as maturing baby boomers in the form of Active Adult
communities.
East. In 2006, the number of home
sales in Florida decreased by 200 orders to 210 units worth $65.1 million, a
49% and 64% decrease over 2005. This
decrease is due to the extremely difficult market conditions in Ft.
Myers/Naples, where demand and pricing power have declined at a faster pace
than the rest of the nation. We expect
these conditions to continue in 2007.
Order Backlog. Companywide. Our
backlog represents net sales contracts that have not closed. Our backlog was
$1.2 billion at December 31, 2006, a decrease of 45% compared to $2.2 billion
at December 31, 2005 and was comprised of 3,685 homes, a 42% decrease compared
to December 31, 2005. Our homes in backlog at December 31, 2006 reflect an
average sales price of $325,700, a decrease of 5% compared to $341,200 at the
same time a year ago. These decreases are primarily the result of declining
housing markets in many of our markets, as reflected by decreased pricing power
and higher cancellation rates, coupled with record closings in 2006.
Our backlog was $2.2 billion at December 31, 2005, an
increase of 65% compared to $1.3 billion at December 31, 2004 and was comprised
of 6,394 homes, a 45% increase compared to the year ended December 31,
2004. Our homes in backlog at December
31, 2005 reflected an average sales price of $341,200, an increase of 14% compared
to $299,700 at the same time a year ago.
These increases were primarily due to healthy housing markets in many of
our markets.
West. In 2006, the West Region experienced a 72% decrease in dollar backlog
as compared to 2005. In California, we
had a decrease in the dollar value of backlog of 69%, reflecting weaker demand
in the fourth quarter, while Nevada’s 57 backlog units represent an 84%
decrease over the prior year. As previously noted, record high cancellation
rates were a primary factor causing the reduced backlog.
In 2005, the West Region
experienced a 16% increase in dollar backlog as compared to 2004. In California, we had a modest increase in
the dollar value of backlog of 8%, reflecting moderating demand in the fourth
quarter, while Nevada’s 349 homes represented a 47% increase over the prior
year.
Central. As of December 31, 2006, the Central Region had 3,159 homes in backlog,
a decrease of 32% over 2005. In Arizona,
the number of homes in backlog decreased 63% and the value of those homes
decreased 59%. These results were
partially offset by Texas, where homes in backlog increased 2% to 2,209 from
2,173 at December 31, 2005 with an increase of 14% in value to $582.2 million.
29
As of December 31, 2005, the
Central Region had 4,632 homes in backlog, an increase of 33% over 2004. In Arizona, the number of homes in backlog
increased 22% and the value of those homes increased 56%, while in Texas, homes
in backlog increased 46% to 2,173 from 1,485 at December 31, 2004 with an
increase of 63% in value to $509.5 million.
East. We ended 2006 with 243 homes in backlog in Florida with a value of
$100.3 million, decreases of 65% and 63%, respectively, from 2005. The poor homebuilding market conditions and
high cancellation rates, particularly in Ft. Myers/Naples, were the main cause
for these declines.
Other Operating Information
|
|
|
Years Ended December 31,
|
|
|
|
|
($ in thousands)
|
|
|
|
|
2006
|
|
2005
|
|
2004
|
|
|
Home
Closing Gross Profit
|
|
|
|
|
|
|
|
|
West
|
|
|
|
|
|
|
|
|
Home closing
gross profit
|
|
$
|
198,890
|
|
$
|
319,759
|
|
$
|
173,481
|
|
|
Percent of home
closing revenue
|
|
18.7
|
%
|
27.8
|
%
|
23.2
|
%
|
|
|
|
|
|
|
|
|
|
|
Central
|
|
|
|
|
|
|
|
|
Home closing
gross profit
|
|
$
|
486,780
|
|
$
|
348,998
|
|
$
|
226,806
|
|
|
Percent of home
closing revenue
|
|
22.7
|
%
|
21.0
|
%
|
17.9
|
%
|
|
|
|
|
|
|
|
|
|
|
East
|
|
|
|
|
|
|
|
|
Home closing
gross profit
|
|
$
|
26,318
|
|
$
|
37,696
|
|
—
|
|
|
Percent of home
closing revenue
|
|
11.0
|
%
|
20.4
|
%
|
—
|
|
|
|
|
|
|
|
|
|
|
|
Total
|
|
|
|
|
|
|
|
|
Home closing
gross profit
|
|
$
|
711,988
|
|
$
|
706,453
|
|
$
|
400,287
|
|
|
Percent of home closing
revenue
|
|
20.7
|
%
|
23.6
|
%
|
19.9
|
%
|
Home Closing Gross Profit. Companywide. Home
closing gross profit represents home closing revenue
less cost of home closings. Cost of home closings include land and lot
development costs, direct home construction costs, an allocation of common
community costs (such as model complex costs and architectural, legal and
zoning costs), interest, sales tax, impact fees, warranty, construction
overhead and closing costs.
Our companywide gross profit of 20.7% is 290 basis points below our
2005 gross profit of 23.6%. Our 2006
gross profit included real estate inventory impairments and write-offs of
option deposits and pre-acquisition costs of $78.3 million, which is 2.3% of
total home closing revenue. Excluding
such charges, our 2006 and 2005 margins are relatively comparable as many of
the 2006 closings reflect the favorable pricing conditions of 2005, when many
of these homes were sold.
West. For 2006, home closing gross profit decreased 910
basis points over 2005 to 18.7%. The
2006 margins reflect our declining pricing power and increased use of
incentives in 2006, coupled with home construction costs holding steady when
compared to the robust homebuilding environment of 2005. Margins in 2006 were further impacted by
inventory impairments and write-downs of options and pre-acquisition
costs. The West Region recorded $36.9
million of impairment and write-downs, reducing the gross profit margin by
3.5%.
As we expected, our 2005 homebuilding margins were not sustainable, and
we believe our margins will continue to decline to more historical average
levels. We believe that further margin
compression could result from a continued slowing in home sale price increases
(or decreases in home sale prices), increasing costs of land and building
materials and the offering of increased incentives to homebuyers if the
homebuilding market slows and interest rates increase.
Home closing gross profit increased 460 basis points in 2005 over 2004
to 27.8%. The 2005 margins reflected an
overall robust homebuilding environment and were above our target range. This increase was primarily due to strong
demand in 2005 and our ability to increase prices in many of our markets at
that time, while cost-containment efforts of our land and construction costs
further contributed to the increase.
Central.
The Central Region experienced a 170 basis point increase in gross
profit percentage in 2006 to 22.7% as compared to 2005. This increase is due primarily to the mix of
homes sold in Arizona, with higher margin communities
30
contributing a
larger percentage of the sales. The
Central Region also recorded $13.7 million of impairments and write-downs as
discussed above.
The Central Region experienced a 310 basis point increase in gross
profit percentage in 2005 to 21.0% as compared to 2004 due to the strong homebuilding
environment and cost management efforts of our land and construction costs.
East.
The East Region had home closing profit of 11.0% during 2006. The 940 basis point decline is due to both
the inventory impairments recorded during 2006, as well as the weakened
homebuilding market, particularly in Ft. Myers/Naples, where significant price
concessions and sales incentives were utilized in order to remain competitive
in the local market. Total impairments
and write-downs aggregated to $27.7 million during 2006, 11.6% of the Region’s
home closing revenue for the year.
|
|
|
Years Ended December 31,
|
|
|
|
|
($ in thousands)
|
|
|
|
|
2006
|
|
2005
|
|
2004
|
|
|
Commissions
and Other Sales Costs
|
|
|
|
|
|
|
|
|
Dollars
|
|
$
|
216,341
|
|
$
|
160,114
|
|
$
|
116,527
|
|
|
Percent of home
closing revenue
|
|
6.3
|
%
|
5.3
|
%
|
5.8
|
%
|
|
|
|
|
|
|
|
|
|
|
General
and Administrative Expenses
|
|
|
|
|
|
|
|
|
Dollars
|
|
$
|
164,477
|
|
$
|
124,979
|
|
$
|
79,257
|
|
|
Percent of total
closing revenue
|
|
4.8
|
%
|
4.2
|
%
|
3.9
|
%
|
|
|
|
|
|
|
|
|
|
|
Provision
for Income Taxes
|
|
|
|
|
|
|
|
|
Dollars
|
|
$
|
138,655
|
|
$
|
160,560
|
|
$
|
85,790
|
|
|
Percent of earnings
before provision for income taxes
|
|
38.1
|
%
|
38.6
|
%
|
38.2
|
%
|
Commissions
and Other Sales Costs. Commissions and other sales costs, such as
advertising and sales office expenses, increased as a percent of home closing revenue
to 6.3% in 2006 from 5.3% in 2005. This increase was primarily due to the
weakened housing markets, which resulted in the increased involvement of
external real estate agents who are paid a higher commission than our internal
sales force, and additional sales and marketing efforts targeted at improving
our competitiveness in this challenging market.
Commissions and other sales costs as a percent of home
closing revenue were 5.3% in 2005, down from 5.8% in 2004. This decrease was
primarily the result of our ability to leverage our fixed and semi-fixed sales
and marketing costs with our 49% increase in home closing revenue.
General and Administrative
Expenses. General and administrative expenses represent
corporate and divisional overhead expenses such as salaries and bonuses, occupancy, insurance and travel expenses. General and administrative expenses increased
to 4.8% of total revenue in 2006 from 4.2% in 2005. The increase is primarily attributed to $24.9
million (pre-tax) of charges related to severance costs and stock-based
compensation due to the adoption of SFAS No. 123R, which contributed an
additional 72 basis points.
During 2005 we completed two
acquisitions in Florida. These acquisitions, along with our growth in our
existing markets, necessitated an expansion of our corporate infrastructure
capabilities, such as accounting, internal audit, human resources, legal and
information technology to prudently manage the growth of the Company. This expansion resulted in an increase in 2005
general and administrative cost to 4.2% of total revenue compared to 3.9% for
2004.
Loss on Extinguishment of Debt.
In 2005, we incurred a $31.5
million loss on extinguishment of debt relating to our 2005 bond refinancing,
the proceeds of which were used to repurchase pursuant to a tender offer and
consent solicitation approximately $276.8 million of our outstanding 9.75%
senior notes due 2011.
Income Taxes. Income taxes decreased to $138.7 million in 2006
from $160.6 million in 2005. As a percent of pre-tax earnings, taxes were 38.1%
in 2006, down from 38.6% in 2005. The
slight decrease in 2006 is primarily attributed to an increase in the deduction
related to qualified production activities provided by the American Jobs
Creation Act of 2004, a reduction in the amount of non-deductible executive
incentive compensation, and the impact of incentive stock options under SFAS
No. 123R, which was implemented at the beginning of 2006.
31
Income taxes increased to $160.6 million in 2005
from $85.8 million in 2004. As a percent of pre-tax earnings, taxes were 38.6%
in 2005, up from 38.2% in 2004. This increase was mainly due to the 2005
increase in pre-tax earnings in Arizona and California, which have
higher state tax rates than Nevada and Texas. The tax benefit associated with
the exercise of employee stock options reduced taxes payable for 2004 by
approximately $3.0 million, which was credited to additional paid-in-capital.
Liquidity and Capital Resources
Our principal uses of capital for the year ended
December 31, 2006 were for operating expenses, land purchases, investments in
joint ventures, lot development, home construction, the repurchase of common
stock, income taxes and interest. We used a combination of borrowings under our
revolving credit facility and funds generated by operations to meet our
short-term working capital requirements.
Cash flows for each of our communities depend on the
status of the development cycle and can differ substantially from reported
earnings. Early stages of development or expansion require significant cash
outlays for land acquisitions, plat and other approvals, and construction of
model homes, roads, utilities, general landscaping and other amenities. Because
these costs are capitalized, income reported for financial statement purposes
during those early stages may significantly exceed cash flow. Cash flows during
the later stages of a community may significantly exceed earnings reported for
financial statement purposes, as cost of closings includes charges for
substantial amounts of previously expended costs.
We enter into various option and purchase contracts
for land in the normal course of business. Except for a minor number of our
specific performance options, none of these agreements require us to purchase
lots. Generally, our options to purchase lots remain effective so long as we
purchase a pre-established minimum number of lots each month or quarter, as
determined by the respective agreement. Although the pre-established number is
typically structured to approximate our expected rate of home construction
starts, during a weakened homebuilding market, as we are currently
experiencing, we may be required to purchase lots at an absorption level that
exceeds our sales pace in order to maintain the pre-established purchase rate. At December 31, 2006, we had entered into
option purchase contracts with an aggregate purchase price of approximately
$2.1 billion, on which we had made deposits of approximately $168.1 million in
cash along with approximately $64.3 million in letters of credit. Additional
information regarding our purchase agreements and related deposits is presented
in Note 3 – Variable Interest Entities and Consolidated Real Estate Not Owned
in the accompanying consolidated financial statements.
Unsecured
Revolving Credit Facility
On May 16, 2006, we amended and restated our senior
unsecured revolving credit facility (“Amended Credit Agreement”). Under the Amended Credit Agreement, our
credit facility was increased from $600 million to $800 million, and the term
was extended from May 2009 to May 2010.
On June 30, 2006, we amended our Credit Agreement to increase our
borrowing capacity under the Credit Agreement by $50 million and to make
certain other minor changes. The total
borrowing capacity of the credit facility is now $850 million. The increase in capacity was made pursuant to
an accordion feature contained in the Credit Agreement. This accordion feature allows us to request
from time to time an aggregate increase of up to $250 million in the maximum
borrowing commitment. Each member of the lending group may elect to participate
or not participate in any request we make. In addition, any increase in the
borrowing capacity pursuant to this accordion feature is subject to certain
terms and conditions, including the absence of an event of default. At December 31, 2006, $200 million was
available under the accordion feature.
At December 31, 2006, $226.5 million was outstanding
under our Amended Credit Agreement and approximately $102.6 million was
outstanding in letters of credit that collateralize our obligations under
various land purchase and other contracts. After considering our most
restrictive bank covenants, our borrowing availability under the Amended Credit
Agreement was approximately $449 million at December 31, 2006, as determined by
borrowing base limitations defined by our agreement with the lending banks.
On February 23, 2007, we completed the sale of an
aggregate principal amount of $150 million of 7.73% senior subordinated notes
due 2017 in a private placement. The notes were issued at par and
resulted in net proceeds to the Company of $147.2 million, after deduction
of fees, commmissions and expenses. We used the proceeds from the sale of
these senior subordinated notes to paydown our revolving credit facility.
32
This credit facility contains certain financial and
other covenants, including covenants:
· requiring
us to maintain tangible net worth of at least $500 million plus 50% of net
income earned since January 1, 2005 plus 50% of the aggregate net increase in
tangible net worth resulting from the sale of capital stock and other equity
interests (as defined);
· prohibiting
our ratio of indebtedness (including accrued expenses) to tangible net worth
from being greater than 2.25 to 1;
· requiring
us to maintain a ratio of EBITDA (including interest amortized to cost of
sales) to interest incurred (as defined) of at least 2.0 to 1;
· prohibiting
the net book value of our land and lots where construction of a home has not
commenced to exceed 100% of tangible net worth and prohibiting the net book
value of our raw land where grading or infrastructure improvements have not
begun to exceed 20% of tangible net worth;
· limiting
the number of unsold housing units and model units that we may have in our
inventory at the end of any fiscal quarter as follows:
(1) unsold homes cannot
exceed 25% of the number of home closings within the four fiscal quarters
ending on such date; and
(2) model homes cannot
exceed 10% of the number of home closings within the four fiscal quarters
ending on such date; and
· prohibiting
us from entering into any sale and leaseback transaction, excluding the sale
and leaseback of model homes.
7.0%
Senior Notes
In April 2004, we issued $130.0 million in principal amount of 7.0%
senior notes due 2014. The indenture for
our 7.0% senior notes requires us to comply with a number of covenants that
restrict certain transactions, including covenants:
· limiting the
amount of additional indebtedness we can incur unless after giving effect to
such additional indebtedness, either (i) our fixed charge coverage ratio would
be at least 2.0 to 1.0 or (ii) our ratio of consolidated debt to consolidated
tangible net worth would be less than 3.0 to 1.0, provided, however, this
limitation does not generally apply to indebtedness under our senior unsecured
credit facility, most types of inter-company indebtedness, purchase money
indebtedness up to $15 million, other indebtedness up to $15 million and
non-recourse indebtedness;
· generally limiting
the amount of dividends, redemptions of equity interests and certain
investments we can make to $10 million plus (i) 50% of our net income since
June 1, 2001 plus (ii) 100% of the net cash proceeds from the sale of qualified
equity interests, plus other items and subject to other exceptions;
· requiring us to maintain tangible net
worth of at least $60 million;
· limiting our ability to incur or create
certain liens; and
· placing limitations on the sale of
assets, mergers and consolidations and transactions with affiliates.
6.25% Senior Notes
In March 2005, we completed the private placement of $350 million in
aggregate principal amount of 6.25% senior notes due 2015 which resulted in net
proceeds to us of approximately $344 million. The indenture which governs the
6.25% senior notes contains covenants that are substantially similar to the
covenants in the indenture that governs our existing 7.0% senior notes, except
that, among other things, the new indenture:
· does not require us to maintain a certain
level of minimum tangible net worth;
· provides that the exceptions to the
limitation of the amount of additional indebtedness we may acquire with respect
to purchase money indebtedness is unlimited, and with respect to other
indebtedness is $25 million;
· provides that the amount of dividends,
redemptions of equity interests and certain investments we can make is
33
limited to $25 million
plus (i) 50% of net income since June 1, 2001 plus (ii) 100% of the net cash
proceeds from the sale of qualified equity interests, plus other items and
subject to other exceptions;
· increases the amount of investments we
can make in joint ventures in a permitted business with unaffiliated third
parties to 30% of our consolidated tangible net worth (as defined in the new
indenture); and
· provides for a suspension of certain
covenants if the new 6.25% senior notes have “investment grade ratings,” as
defined in the indenture, including covenants relating to change of control,
limitations on additional indebtedness, limitations on the amount of dividends,
redemptions of equity interest and certain limitations on investments and asset
sales.
As of and for the year ended December 31, 2006, we
were in compliance with the credit facility and senior note covenants.
Although we believe that our current borrowing
capacity, cash on hand and anticipated net cash flows from operations are and
will be sufficient to meet liquidity needs for the foreseeable future, certain
events may occur, particularly in light of the current slowdown of the
homebuilding market, which may require additional cash outlays beyond our
historical levels. Such events include
the acquisition of land from our lots under option at a rate faster than our
sales pace and the build-up of unsold inventory due to high cancellation
rates. We believe our future cash needs
will include funds for the completion of projects that are underway, the
acquisition of land and property for new projects, repurchases of common stock.
the maintenance of our day-to-day operations, and the acquisition or start-up
of additional homebuilding operations, should the opportunities arise. There is
no assurance, however, that future cash flows will be sufficient to meet future
capital needs. The amount and types of indebtedness that we incur may be
limited by the terms of the indenture governing our senior notes and by the
terms of the credit agreement governing our senior unsecured credit facility.
See Part II, Item 5 for additional discussions
regarding our share repurchase program.
Off-Balance Sheet Arrangements
We often acquire finished building lots at market
prices from various development entities under fixed price purchase agreements.
This lot acquisition strategy reduces the financial requirements and risks
associated with direct land ownership and land development. Under these
purchase agreements, we are usually required to make deposits in the form of
cash or a letter of credit, which may be forfeited if we fail to perform under
the agreement. At December 31, 2006, we had entered into purchase agreements
with an aggregate purchase price of approximately $2.1 billion and had made
deposits of approximately $168.1 million in the form of cash and approximately
$64.3 million in letters of credit.
We also enter into land acquisition and development
joint ventures. We believe our participation in such joint ventures provides us
a means of accessing larger parcels and lot positions and helps us expand our
market opportunities and manage our risk profile. Our participation in joint
ventures is an increasingly important part of our business model and we expect
it to continue to be in the future. We and/or our joint venture partners
occasionally provide limited repayment guarantees on a pro rata basis on debt
of certain unconsolidated land acquisition and development joint ventures. At
December 31, 2006, we had limited repayment guarantees of $38.6 million.
In addition, we and/or our joint venture partners
occasionally provide guarantees that are only applicable if and when the joint
venture directly, or indirectly through agreement with its joint venture
partners or other third parties, causes the joint venture to voluntarily file a
bankruptcy or similar liquidation or reorganization action (commonly referred
to as “bad boy guarantees”). These types of guarantees typically are on a pro
rata basis and are designed to protect the secured lender from the joint
venture filing voluntary bankruptcy to impede the lender’s remedies with
respect to its mortgage or other secured lien on the joint venture’s underlying
property. To date, no such guarantees have been invoked and we believe it is
unlikely that such a guarantee would be invoked in the future as it would
generally require us to voluntarily take actions that would generally be
disadvantageous to the joint venture and to us. At December 31, 2006, we had
outstanding guarantees of this type totaling approximately $82.3 million. By
definition, guarantees of this type, unless invoked as described above, are not
considered guarantees or indebtedness under our revolving credit facility or
senior note indentures.
We and our joint venture partners are also typically obligated to the
project lenders to complete land development improvements if the joint venture
does not perform the required development. Provided we and the other joint
venture partners are in compliance with these completion obligations, the
project lenders generally would be obligated to fund these improvements through
any financing commitments available under the applicable joint venture development
and construction
34
loans. In
addition, we and our joint venture partners have from time to time provided
unsecured environmental indemnities to joint venture project lenders. In some
instances, these indemnities are subject to caps. These indemnities generally
obligate us to reimburse the project lenders only for claims related to
environmental matters for which such lenders are held responsible. As part of
our project acquisition due diligence process to determine potential
environmental risks, we, or the joint venture entity, generally obtain an
independent environmental review from outside consultants.
Additionally, we and our joint venture partners have agreed to
indemnify third party surety providers with respect to performance bonds issued
on behalf of certain of our joint ventures. If a joint venture does not perform
its obligations, the surety bond could be called. If these surety bonds are
called and the joint venture fails to reimburse the surety, we and our joint
venture partners would be obligated to indemnify the surety. These surety
indemnity arrangements are generally joint and several obligations with our
other joint venture partners. As of December 31, 2006, we were subject to
approximately $45.4 million of these types of surety bond indemnity
arrangements. None of these bonds have been called to date and we believe it is
unlikely that any of these bonds will be called.
We also obtain letters of credit and performance,
maintenance, and other bonds in support of our related obligations with respect
to the development of our projects. The amount of these obligations outstanding
at any time varies depending on the stage and level of our development
activities. In the event the letters of credit or bonds are drawn upon, we
would be obligated to reimburse the issuer of the letter of credit or bond. At
December 31, 2006, we had approximately $38.3 million in outstanding letters of
credit and $272.5 million in performance bonds for such purposes. We believe it
is unlikely that any of these letters of credit or performance bonds will be
drawn upon.
Contractual Obligations
The
following is a summary of our contractual obligations at December 31, 2006, and
the effect such obligations are expected to have on our liquidity and cash
flows in future periods (in thousands):
|
|
|
Payments Due by Period
|
|
|
|
|
Total
|
|
Less than
1 Year
|
|
1-3 Years
|
|
4-5
Years
|
|
More Than
5 Years
|
|
|
|
|
|
|
|
|
|
|
|
|
|
|
|
Principal,
senior notes
|
|
$
|
480,000
|
|
$
|
—
|
|
$
|
—
|
|
$
|
—
|
|
$
|
480,000
|
|
|
Interest, senior
notes
|
|
245,452
|
|
30,975
|
|
61,950
|
|
61,950
|
|
90,577
|
|
|
Unsecured
revolving credit facility
|
|
226,500
|
|
—
|
|
—
|
|
226,500
|
|
—
|
|
|
Other borrowing
obligations (1)(2)
|
|
28,140
|
|
27,964
|
|
176
|
|
—
|
|
—
|
|
|
Interest, other
borrowing obligations (1)(2)
|
|
917
|
|
916
|
|
1
|
|
—
|
|
—
|
|
|
Operating lease
obligations (1)
|
|
58,090
|
|
18,462
|
|
23,088
|
|
10,084
|
|
6,456
|
|
|
Specific
performance option obligations
|
|
4,269
|
|
2,468
|
|
1,801
|
|
—
|
|
—
|
|
|
|
|
|
|
|
|
|
|
|
|
|
|
|
Total
|
|
$
|
1,043,368
|
|
$
|
80,785
|
|
$
|
87,016
|
|
$
|
298,534
|
|
$
|
577,033
|
|
(1) As a part of our model home construction activities,
we enter into lease transactions with third parties, the monthly payments for
which are typically calculated by applying a LIBOR-based rate to the agreed
upon basis of the leased asset. As discussed in Note 5, at December 31, 2006
and 2005, approximately $26.8 and $39.3 million of these transactions were
included in our balance sheet as model home inventory with a corresponding debt
balance, which is included in the other borrowings category above. Other payments relating to the model home
leases and other operating leases are included in the “Operating lease
obligations” category. See Notes 3 and 14 to our consolidated financial
statements included in this report for additional information regarding our
contractual obligations.
(2) Includes $1.3 million in principal related to an
acquisition and development loan with interest payments totaling approximately
$40,000.
We do not engage
in commodity trading or other similar activities. We had no derivative
financial instruments at December 31, 2006 or 2005.
Seasonality
We typically experience seasonal variations in our
quarterly operating results and capital requirement. Historically, we sell more homes in the first
half of the fiscal year than in the second half, which results in more working
capital requirements and home closings in the third and fourth quarters. We
expect this seasonal pattern to continue, although it may vary as our
operations continue to expand.
Recent Accounting Standards
See Note 1 for discussion of recently-issued
accounting standards. Reference is also
made to Note 9 regarding our adoption of SFAS No. 123R, “Share-based
Payment.”
35
Item 7A. Quantitative and Qualitative Disclosures
about Market Risk
We are exposed to market risk primarily related to
potential adverse changes in interest rates on our existing revolving credit
facility. The interest rate relative to this borrowing fluctuates with the
Prime and LIBOR lending rates. At December 31, 2006, we had $226.5 million
drawn under our revolving credit facility that would be subject to changes in
interest rates. We do not enter into, or intend to enter into, derivative
financial instruments for trading or speculative purposes.
Our fixed rate debt is made up primarily of $350.0
million in principal of our 6.25% senior notes and $130.0 million in principal
of our 7.0% senior notes. Except in limited circumstances, we do not have an
obligation to prepay our fixed-rate debt prior to maturity and, as a result,
interest rate risk and changes in fair value should not have a significant
impact on our fixed rate borrowings until we would be required to repay such
debt.
The following table presents our long-term debt
obligations, principal cash flows by maturity, weighted average interest rates
and estimated fair market value. Information regarding interest rate
sensitivity principal (notional) amount by expected maturity and average
interest rates for the year ended December 31, 2006 follows:
|
|
|
December 31, 2006
For the Years Ended December 31,
|
|
Fair Value at
December 31,
|
|
|
|
|
2007
|
|
2008
|
|
2009
|
|
2010
|
|
2011
|
|
Thereafter
|
|
Total
|
|
2006
|
|
|
|
|
(dollars in millions)
|
|
|
|
|
|
|
|
|
|
|
|
|
|
|
|
|
|
|
|
|
|
|
|
Fixed rate
|
|
$
|
—
|
|
—
|
|
—
|
|
—
|
|
—
|
|
$
|
480.0
|
|
$
|
480.0
|
|
$
|
460.6
|
(a)
|
|
Average interest
rate
|
|
—
|
|
—
|
|
—
|
|
—
|
|
—
|
|
6.45
|
%
|
6.45
|
%
|
n/a
|
|
|
|
|
|
|
|
|
|
|
|
|
|
|
|
|
|
|
|
|
|
Variable rate
|
|
$
|
28.0
|
(b)(c)
|
0.1
|
(b)
|
—
|
|
226.5
|
(d)
|
—
|
|
—
|
|
$
|
254.6
|
|
$
|
254.6
|
|
|
Average interest rate
|
|
—
|
|
—
|
|
—
|
|
—
|
|
—
|
|
—
|
|
—
|
|
n/a
|
|
|
|
|
|
|
|
|
|
|
|
|
|
|
|
|
|
|
|
|
|
|
|
|
|
(a) Fair value of
our fixed rate debt at December 31, 2006, is based on quoted market prices by
independent dealers.
(b) $26.7 and $0.1
million relates to our model home lease program in 2007 and 2008. Although we
have no legal obligation to repay this amount, generally accepted accounting
principles require we include this liability and a related asset in our
consolidated financial statements. The lease payments required under this
program are based on the outstanding principal amount at approximately 7.85% of
such amount per annum.
(c) $1.3 million
relates to an acquisition and development loan which carries a variable
interest rate of the 30 day LIBOR plus 3.5% per annum.
(d) $226.5 million
relates to our revolving credit facility which carries a variable interest rate
of LIBOR plus 1.25% per annum or Prime.
Our operations are interest rate sensitive. As overall
housing demand is adversely affected by increases in interest rates, a
significant increase in mortgage interest rates may negatively affect the
ability of homebuyers to secure adequate financing. Higher interest rates could
adversely affect our revenues, gross margins and net income and would also
increase our variable rate borrowing costs.
Item 8. Financial Statements and Supplementary
Data
Our consolidated financial statements as of December 31, 2006 and 2005
and for each of the years in the three-year period ended December 31, 2006,
together with related notes and the report of Deloitte & Touche LLP,
independent registered public accounting firm, are on the following pages.
Other required financial information is more fully described in Item 15.
36
REPORT OF
INDEPENDENT REGISTERED PUBLIC ACCOUNTING FIRM
The
Board of Directors and Stockholders of
Meritage Homes Corporation
We
have audited the accompanying consolidated balance sheets of Meritage Homes
Corporation and subsidiaries (the “Company”) as of December 31, 2006 and 2005,
and the related consolidated statements of earnings, stockholders’ equity, and
cash flows for each of the three years in the period ended December 31,
2006. These consolidated financial
statements are the responsibility of the Company’s management. Our responsibility is to express an opinion
on these consolidated financial statements based on our audits.
We
conducted our audits in accordance with the standards of the Public Company
Accounting Oversight Board (United States).
Those standards require that we plan and perform the audit to obtain
reasonable assurance about whether the financial statements are free of
material misstatement. An audit includes
examining, on a test basis, evidence supporting the amounts and disclosures in
the financial statements. An audit also
includes assessing the accounting principles used and significant estimates
made by management, as well as evaluating the overall financial statement
presentation. We believe that our audits
provide a reasonable basis for our opinion.
In our
opinion, such consolidated financial statements present fairly, in all material
respects, the financial position of Meritage Homes Corporation and subsidiaries
as of December 31, 2006 and 2005, and the results of their operations and their
cash flows for each of the three years in the period ended December 31, 2006 in
conformity with accounting principles generally accepted in the United States
of America.
As
discussed in Note 9 to the consolidated financial statements, effective January
1, 2006, the Company adopted Statement of Financial Accounting Standard No.
123(R), Share-Based Payment, using the modified
prospective method.
We
have also audited, in accordance with the standards of the Public Company
Accounting Oversight Board (United States), the effectiveness of the Company’s
internal control over financial reporting as of December 31, 2006, based on the
criteria established in Internal Control - Integrated Framework issued by the
Committee of Sponsoring Organizations of the Treadway Commission and our report
dated February 26, 2007 expressed an unqualified opinion on management’s
assessment of the effectiveness of the Company’s internal control over
financial reporting and an unqualified opinion on the effectiveness of the
Company’s internal control over financial reporting.
/s/ DELOITTE
& TOUCHE LLP
Phoenix, Arizona
February
26, 2007
37
MERITAGE
HOMES CORPORATION AND SUBSIDIARIES
CONSOLIDATED BALANCE SHEETS
|
|
|
December 31,
|
|
|
|
|
2006
|
|
2005
|
|
|
|
|
(In thousands, except share data)
|
|
|
Assets
|
|
|
|
|
|
|
Cash and cash equivalents
|
|
$
|
56,710
|
|
$
|
65,812
|
|
|
Receivables
|
|
68,725
|
|
60,745
|
|
|
Real estate
|
|
1,530,602
|
|
1,390,803
|
|
|
Real estate not owned
|
|
5,269
|
|
1,464
|
|
|
Deposits on real estate under option or contract
|
|
167,132
|
|
167,040
|
|
|
Investments in unconsolidated entities
|
|
114,250
|
|
88,714
|
|
|
Property and equipment, net
|
|
40,712
|
|
36,239
|
|
|
Deferred tax asset, net
|
|
28,119
|
|
—
|
|
|
Goodwill
|
|
129,659
|
|
130,222
|
|
|
Intangibles, net
|
|
9,492
|
|
14,029
|
|
|
Prepaid expenses and other assets
|
|
19,855
|
|
16,289
|
|
|
|
|
|
|
|
|
|
Total assets
|
|
$
|
2,170,525
|
|
$
|
1,971,357
|
|
|
|
|
|
|
|
|
|
Liabilities
|
|
|
|
|
|
|
Accounts payable
|
|
$
|
117,443
|
|
$
|
140,789
|
|
|
Accrued liabilities
|
|
266,683
|
|
289,307
|
|
|
Home sale deposits
|
|
42,022
|
|
76,299
|
|
|
Liabilities related to real estate not owned
|
|
4,269
|
|
968
|
|
|
Deferred tax liability, net
|
|
—
|
|
20,865
|
|
|
Loans payable and other borrowings
|
|
254,640
|
|
112,398
|
|
|
Senior notes
|
|
478,636
|
|
479,726
|
|
|
|
|
|
|
|
|
|
Total liabilities
|
|
1,163,693
|
|
1,120,352
|
|
|
|
|
|
|
|
|
|
Stockholders’
Equity
|
|
|
|
|
|
|
Common stock, par value $0.01. Authorized 50,000,000
shares; issued 34,035,084 and 33,112,358 shares at December 31, 2006 and
2005, respectively
|
|
340
|
|
331
|
|
|
Additional paid-in capital
|
|
332,652
|
|
296,804
|
|
|
Retained earnings
|
|
862,602
|
|
637,248
|
|
|
Treasury stock at cost, 7,891,068 and 5,935,068
shares at December 31, 2006 and 2005, respectively
|
|
(188,762
|
)
|
(83,378
|
)
|
|
|
|
|
|
|
|
|
Total stockholders’ equity
|
|
1,006,832
|
|
851,005
|
|
|
|
|
|
|
|
|
|
Total
liabilities and stockholders’ equity
|
|
$
|
2,170,525
|
|
$
|
1,971,357
|
|
See accompanying notes to consolidated financial statements
38
MERITAGE
HOMES CORPORATION AND SUBSIDIARIES
CONSOLIDATED STATEMENTS OF EARNINGS
|
|
|
Years Ended December 31,
|
|
|
|
|
2006
|
|
2005
|
|
2004
|
|
|
|
|
(In thousands, except per share data)
|
|
|
|
|
|
|
|
|
|
|
|
Home closing
revenue
|
|
$
|
3,444,286
|
|
$
|
2,996,946
|
|
$
|
2,015,742
|
|
|
Land closing
revenue
|
|
17,034
|
|
4,156
|
|
24,262
|
|
|
Total closing revenue
|
|
3,461,320
|
|
3,001,102
|
|
2,040,004
|
|
|
|
|
|
|
|
|
|
|
|
Cost of home
closings
|
|
(2,732,298
|
)
|
(2,290,493
|
)
|
(1,615,455
|
)
|
|
Cost of land
closings
|
|
(16,392
|
)
|
(3,619
|
)
|
(16,079
|
)
|
|
Total cost of closings
|
|
(2,748,690
|
)
|
(2,294,112
|
)
|
(1,631,534
|
)
|
|
|
|
|
|
|
|
|
|
|
Home closing
gross profit
|
|
711,988
|
|
706,453
|
|
400,287
|
|
|
Land closing
gross profit
|
|
642
|
|
537
|
|
8,183
|
|
|
Total closing gross profit
|
|
712,630
|
|
706,990
|
|
408,470
|
|
|
|
|
|
|
|
|
|
|
|
Commissions and
other sales costs
|
|
(216,341
|
)
|
(160,114
|
)
|
(116,527
|
)
|
|
General and
administrative expenses
|
|
(164,477
|
)
|
(124,979
|
)
|
(79,257
|
)
|
|
Earnings from
unconsolidated entities, net
|
|
20,364
|
|
18,337
|
|
2,788
|
|
|
Other income,
net
|
|
11,833
|
|
7,468
|
|
9,284
|
|
|
Loss on
extinguishment of debt
|
|
—
|
|
(31,477
|
)
|
—
|
|
|
|
|
|
|
|
|
|
|
|
Earnings before
provision for income taxes
|
|
364,009
|
|
416,225
|
|
224,758
|
|
|
Provision for
income taxes
|
|
(138,655
|
)
|
(160,560
|
)
|
(85,790
|
)
|
|
|
|
|
|
|
|
|
|
|
Net earnings
|
|
$
|
225,354
|
|
$
|
255,665
|
|
$
|
138,968
|
|
|
|
|
|
|
|
|
|
|
|
Earnings per
share*:
|
|
|
|
|
|
|
|
|
Basic
|
|
$
|
8.52
|
|
$
|
9.48
|
|
$
|
5.33
|
|
|
Diluted
|
|
$
|
8.32
|
|
$
|
8.88
|
|
$
|
5.03
|
|
|
|
|
|
|
|
|
|
|
|
Weighted average
number of shares*:
|
|
|
|
|
|
|
|
|
Basic
|
|
26,448
|
|
26,977
|
|
26,066
|
|
|
Diluted
|
|
27,102
|
|
28,787
|
|
27,610
|
|
*2004 share amounts reflect a
2-for-1 stock split in the form of a stock dividend that occurred in January
2005.
See accompanying
notes to consolidated financial statements
39
MERITAGE
HOMES CORPORATION AND SUBSIDIARIES
CONSOLIDATED STATEMENTS OF STOCKHOLDERS’ EQUITY
|
|
|
Years Ended December 31, 2006, 2005 and 2004
|
|
|
|
|
(In thousands)
|
|
|
|
|
Number of
Shares*
|
|
Common
Stock*
|
|
Additional
Paid-In
Capital*
|
|
Retained
Earnings
|
|
Treasury
Stock
|
|
Total
|
|
|
|
|
|
|
|
|
|
|
|
|
|
|
|
|
|
Balance at
January 1, 2004
|
|
30,958
|
|
310
|
|
202,523
|
|
242,615
|
|
(33,553
|
)
|
411,895
|
|
|
|
|
|
|
|
|
|
|
|
|
|
|
|
|
|
Net earnings
|
|
—
|
|
—
|
|
—
|
|
138,968
|
|
—
|
|
138,968
|
|
|
Income tax
benefit from stock option exercises
|
|
—
|
|
—
|
|
2,972
|
|
—
|
|
—
|
|
2,972
|
|
|
Exercise of
stock options
|
|
502
|
|
5
|
|
4,114
|
|
—
|
|
—
|
|
4,119
|
|
|
Purchase of
treasury stock
|
|
—
|
|
—
|
|
—
|
|
—
|
|
(35,420
|
)
|
(35,420
|
)
|
|
Stock option
expense
|
|
—
|
|
—
|
|
21
|
|
—
|
|
—
|
|
21
|
|
|
|
|
|
|
|
|
|
|
|
|
|
|
|
|
|
Balance at
December 31, 2004
|
|
31,460
|
|
315
|
|
209,630
|
|
381,583
|
|
(68,973
|
)
|
522,555
|
|
|
|
|
|
|
|
|
|
|
|
|
|
|
|
|
|
Net earnings
|
|
—
|
|
—
|
|
—
|
|
255,665
|
|
—
|
|
255,665
|
|
|
Income tax benefit
from stock option exercises
|
|
—
|
|
—
|
|
10,465
|
|
—
|
|
—
|
|
10,465
|
|
|
Exercise of
stock options
|
|
617
|
|
6
|
|
6,985
|
|
—
|
|
—
|
|
6,991
|
|
|
Purchase of
treasury stock
|
|
—
|
|
—
|
|
—
|
|
—
|
|
(14,405
|
)
|
(14,405
|
)
|
|
Stock option
expense
|
|
—
|
|
—
|
|
25
|
|
—
|
|
—
|
|
25
|
|
|
Issuance of
common stock
|
|
1,035
|
|
10
|
|
69,699
|
|
—
|
|
—
|
|
69,709
|
|
|
|
|
|
|
|
|
|
|
|
|
|
|
|
|
|
Balance at
December 31, 2005
|
|
33,112
|
|
331
|
|
296,804
|
|
637,248
|
|
(83,378
|
)
|
851,005
|
|
|
|
|
|
|
|
|
|
|
|
|
|
|
|
|
|
Net earnings
|
|
—
|
|
—
|
|
—
|
|
225,354
|
|
—
|
|
225,354
|
|
|
Income tax
benefit from stock option exercises
|
|
—
|
|
—
|
|
10,777
|
|
—
|
|
—
|
|
10,777
|
|
|
Exercise of
stock options
|
|
923
|
|
9
|
|
13,526
|
|
—
|
|
—
|
|
13,535
|
|
|
Purchase of
treasury stock
|
|
—
|
|
—
|
|
—
|
|
—
|
|
(105,384
|
)
|
(105,384
|
)
|
|
Stock option
expense
|
|
—
|
|
—
|
|
11,545
|
|
—
|
|
—
|
|
11,545
|
|
|
|
|
|
|
|
|
|
|
|
|
|
|
|
|
|
Balance at December 31,
2006
|
|
34,035
|
|
$
|
340
|
|
$
|
332,652
|
|
$
|
862,602
|
|
$
|
(188,762
|
)
|
$
|
1,006,832
|
|
|
|
|
|
|
|
|
|
|
|
|
|
|
|
|
|
|
|
|
*2004
amounts reflect a 2-for-1 stock split in the form of a stock dividend that
occurred in January 2005.
See accompanying notes to consolidated financial statements
40
MERITAGE HOMES
CORPORATION AND SUBSIDIARIES
CONSOLIDATED STATEMENTS OF CASH FLOWS
|
|
|
Years Ended December 31,
|
|
|
|
|
2006
|
|
2005
|
|
2004
|
|
|
|
|
(In thousands)
|
|
|
Cash flows from operating
activities:
|
|
|
|
|
|
|
|
|
Net earnings
|
|
$
|
225,354
|
|
$
|
255,665
|
|
$
|
138,968
|
|
|
Adjustments to
reconcile net earnings to net cash provided by (used in) operating
activities:
|
|
|
|
|
|
|
|
|
Depreciation and
amortization
|
|
23,729
|
|
17,207
|
|
13,233
|
|
|
Write-off of
senior note issuance cost
|
|
—
|
|
4,977
|
|
—
|
|
|
Inventory
impairments and land option deposit and land pre-acquisition cost write-offs
|
|
78,268
|
|
—
|
|
—
|
|
|
Increase
(decrease) in deferred taxes
|
|
(48,984
|
)
|
(5,965
|
)
|
609
|
|
|
Stock-based
compensation
|
|
11,545
|
|
—
|
|
—
|
|
|
Income tax
benefit from stock option exercises
|
|
—
|
|
10,465
|
|
2,972
|
|
|
Excess income
tax benefit from stock-based awards
|
|
(8,938
|
)
|
—
|
|
—
|
|
|
Equity in
earnings of unconsolidated entities
|
|
(20,364
|
)
|
(18,337
|
)
|
(2,788
|
)
|
|
Distributions of
earnings from unconsolidated entities
|
|
17,126
|
|
16,140
|
|
3,698
|
|
|
Changes in
assets and liabilities, net of effect of acquisitions:
|
|
|
|
|
|
|
|
|
Increase in real
estate
|
|
(182,391
|
)
|
(364,571
|
)
|
(136,967
|
)
|
|
Increase in
deposits on real estate under option or contract
|
|
(19,785
|
)
|
(33,455
|
)
|
(23,776
|
)
|
|
Increase in
receivables and prepaid expenses and other assets
|
|
(7,569
|
)
|
(40,805
|
)
|
(11,347
|
)
|
|
Increase
(decrease) in accounts payable and accrued liabilities
|
|
(55,678
|
)
|
208,968
|
|
63,169
|
|
|
Increase
(decrease) in home sale deposits
|
|
(34,277
|
)
|
21,954
|
|
16,098
|
|
|
Net cash
provided by (used in) operating activities
|
|
(21,964
|
)
|
72,243
|
|
63,869
|
|
|
|
|
|
|
|
|
|
|
|
Cash flows from investing
activities:
|
|
|
|
|
|
|
|
|
Investments in
unconsolidated entities
|
|
(51,909
|
)
|
(89,085
|
)
|
(45,567
|
)
|
|
Distributions of
capital from unconsolidated entities
|
|
18,959
|
|
20,799
|
|
951
|
|
|
Cash paid for
acquisitions
|
|
—
|
|
(152,425
|
)
|
(24,165
|
)
|
|
Cash paid for
earn-out agreements
|
|
—
|
|
(1,929
|
)
|
(1,780
|
)
|
|
Purchases of
property and equipment
|
|
(25,850
|
)
|
(25,279
|
)
|
(15,113
|
)
|
|
Proceeds from
sales of property and equipment
|
|
1,080
|
|
492
|
|
172
|
|
|
Net cash used in
investing activities
|
|
(57,720
|
)
|
(247,427
|
)
|
(85,502
|
)
|
|
|
|
|
|
|
|
|
|
|
Cash flows from financing
activities:
|
|
|
|
|
|
|
|
|
Net borrowings
(payments) under line of credit agreement
|
|
153,900
|
|
72,000
|
|
(34,077
|
)
|
|
Proceeds from
loans payable and other borrowings
|
|
847
|
|
462
|
|
—
|
|
|
Proceeds from
issuance of senior notes, net
|
|
—
|
|
343,835
|
|
130,088
|
|
|
Proceeds from
sale of common stock, net
|
|
—
|
|
69,709
|
|
—
|
|
|
Purchase of
treasury stock
|
|
(105,384
|
)
|
(14,405
|
)
|
(35,420
|
)
|
|
Payments for
repurchase of senior notes
|
|
(1,254
|
)
|
(285,472
|
)
|
—
|
|
|
Excess income
tax benefit from stock-based awards
|
|
8,938
|
|
—
|
|
—
|
|
|
Proceeds from
stock option exercises
|
|
13,535
|
|
6,991
|
|
4,119
|
|
|
Net cash
provided by financing activities
|
|
70,582
|
|
193,120
|
|
64,710
|
|
|
|
|
|
|
|
|
|
|
|
Net increase (decrease)
in cash and cash equivalents
|
|
(9,102
|
)
|
17,936
|
|
43,077
|
|
|
Cash and cash
equivalents, beginning of year
|
|
65,812
|
|
47,876
|
|
4,799
|
|
|
Cash and cash equivalents, end of year
|
|
$
|
56,710
|
|
$
|
65,812
|
|
$
|
47,876
|
|
See Supplemental
Disclosure of Cash Flow Information at Note 11.
See accompanying
notes to consolidated financial statements
41
MERITAGE
HOMES CORPORATION AND SUBSIDIARIES
NOTES TO CONSOLIDATED FINANCIAL STATEMENTS
December 31, 2006, 2005 and 2004
NOTE 1 –
BUSINESS AND SUMMARY OF SIGNIFICANT ACCOUNTING POLICIES
Organization. Meritage
Homes is a leading designer and builder of single-family attached and detached
homes in the fast-growing southern and western United States, based on the
number of home closings. We offer a variety of homes that are designed to
appeal to a wide range of homebuyers, including first-time, move-up, luxury and
active adult buyers. We have operations in three regions: West, Central and East, which are comprised
of 14 metropolitan areas in Arizona, Texas, California, Nevada, Colorado and
Florida. Through our successors, we commenced our homebuilding operations in
1985. Meritage Homes Corporation was
incorporated in 1988 in the State of Maryland.
Our homebuilding and marketing activities are
conducted under the name of Meritage Homes in each of our markets, except for
certain communities in Arizona, where we operate under the name of Monterey
Homes, and in Texas, where we operate in certain communities as Legacy Homes,
Meritage Homes and Monterey Homes. At December 31, 2006, we were actively
selling homes in 213 communities, with base prices ranging from approximately
$100,000 to $1,176,000.
Basis of Presentation. The
accompanying consolidated financial statements have been prepared in accordance
with United States generally accepted accounting principles and include the
accounts of Meritage Homes Corporation and those of our consolidated
subsidiaries, partnerships and other entities in which we have a controlling
financial interest, and of variable interest entities (see Note 3) in which we
are deemed the primary beneficiary (collectively, the “Company”). Intercompany
balances and transactions have been eliminated in consolidation.
Cash and Cash Equivalents. Liquid investments with an initial maturity of three months or
less are classified as cash equivalents. Amounts in transit from title
companies for home closings of approximately $51.6 million and $62.7 million
are included in cash and cash equivalents at December 31, 2006 and 2005,
respectively.
Real Estate. Real
estate consists of finished home sites and home sites under development,
completed homes and homes under construction, and land held for development.
Capitalized costs include direct construction costs for homes, development
period interest and certain common costs that benefit the entire community.
Common costs are incurred on a community-by-community basis and allocated to
residential lots based on the number of lots to be built in the project, which
approximates the relative sales value method. Common costs incurred prior to
construction are allocated to the land parcel benefited, based on the relative
fair value of the parcel prior to construction.
An impairment loss is recorded when events or changes
in circumstances indicate that the carrying amount of an asset may not be
recoverable from the cash flows generated by future disposition. Real estate is
reviewed quarterly to determine whether recorded costs are recoverable. In such
cases, amounts are carried at the lower of cost or estimated fair value less
disposal costs. During 2006, we recorded
a $23.7 million impairment charge related to real estate inventories. Additionally, we wrote off $54.6 million
of deposits and pre-acquisition costs relating to projects that were no longer
feasible. These changes are included in cost of home closings.
Deposits. Deposits
paid related to land options and contracts to purchase land are capitalized
when incurred and classified as deposits on real estate under option or
contract until the related land is purchased. The deposits are then transferred to real estate at the time
the lots are acquired. To the extent they are non-refundable, deposits are
charged to expense if the land acquisition is terminated or no longer
considered probable.
Property and Equipment,
net. Property and
equipment, net, at December 31, 2006 and 2005 consists of approximately
$20.4 million and $17.9 million, respectively, of computer and office
equipment and approximately $20.3 million and $18.3 million,
respectively, of model home furnishings, and is stated at cost less accumulated
depreciation. Accumulated depreciation related to these assets amounted to
approximately $33.6 million and $24.4 million at December 31, 2006 and 2005,
respectively. Depreciation is generally calculated using the straight-line
method over the estimated useful lives of the assets, which range from three to
seven years. Maintenance and repair costs are expensed as incurred.
Deferred Costs. At
December 31, 2006 and 2005, deferred costs representing financing fees totaled
approximately $7.1 million, net of accumulated amortization of
approximately $3.8 million and $2.4 million, respectively, and are included
42
on our
consolidated balance sheets within prepaid expenses and other assets. The costs
are primarily amortized using the straight line method which approximates the
effective interest method. Additionally, in 2005, we wrote off approximately
$5.0 million of deferred costs related to our 9.75% senior notes of which
$278.8 million in aggregate principal amount was repurchased during 2005.
Investments in Unconsolidated
Entities. We use the equity method of accounting for investments in
unconsolidated entities over which we exercise significant influence but do not
have a controlling interest. Under the equity method, our share of the
unconsolidated entities’ earnings or loss is included in earnings from
unconsolidated entities, net. We use the cost method of accounting for
investments in unconsolidated entities over which we do not have significant
influence. See Note 4 for further
discussion.
Intangibles, net. Intangible assets consist primarily of non-compete
agreements, tradenames and floor plan designs acquired in connection with our
February 2005 acquisition of Colonial Homes and our September 2005 acquisition
of Greater Homes. These intangible assets were valued at the acquisition dates
utilizing accepted valuation procedures. The non-compete agreements, tradenames
and floorplan designs are being amortized over their estimated useful lives.
The acquired cost and accumulated amortization of our intangible assets was
$8.5 million and $4.6 million, respectively, at December 31, 2006. During 2006,
we wrote off $3.0 million of trade names that we no longer expect to use. The amortization expense in 2006 was $2.7
million and is expected to be approximately $1.2 million in 2007 and $1.1, $1.1
and $0.5 million per year in 2008, 2009 and 2010, respectively.
We
have capitalized software costs at December 31, 2006 and 2005, in accordance
with AICPA Statement of Position (SOP) 98-1 “Accounting for Costs of Computer
Software Development or Obtained for Internal Use” with a cost basis of $9.8
and $6.9 million, respectively, net of accumulated amortization of $5.4
and $2.5 million, respectively. In 2006,
amortization expense was approximately $2.9 million related to the capitalized
software costs and is expected to be approximately $1.8, $0.7, $0.7, $0.7 and
$0.5 million in 2007, 2008, 2009, 2010 and 2011, respectively. Additionally, we have $1.2 million of
capitalized software costs that have not begun to amortize.
Accrued Liabilities.
Accrued liabilities at December 31, 2006 and 2005 consisted of the following
(in thousands):
|
|
|
At December 31,
|
|
|
|
|
2006
|
|
2005
|
|
|
Accruals related
to real estate development and construction activities
|
|
$
|
120,604
|
|
$
|
135,953
|
|
|
Payroll and
other benefits
|
|
54,893
|
|
51,382
|
|
|
Accrued taxes
|
|
9,112
|
|
48,941
|
|
|
Warranty
reserves
|
|
28,437
|
|
25,168
|
|
|
Other accruals
|
|
53,637
|
|
27,863
|
|
|
Total
|
|
$
|
266,683
|
|
$
|
289,307
|
|
Revenue Recognition. Revenue
from closings of residential real estate is recognized when closings have
occurred, the buyer has made the required minimum down payment, obtained
necessary financing, the risks and rewards of ownership are transferred to the
buyer, and we have no continuing involvement with the property, which is
generally the close of escrow.
Cost of Home Closings.
Cost of home closings includes direct home construction costs, closing
costs, land acquisition and development costs, development period interest and
common costs. Direct construction costs are accumulated during the period of
construction and charged to cost of closings under specific identification
methods, as are closing costs.
Estimated future warranty costs are charged to cost of
home closings in the period when the revenues from the related home closings
are recognized. Costs are accrued based upon historical experience and
generally range from 0.42% to 0.83% of the home’s sales price (see Note 14).
Income Taxes. We account for income taxes in accordance with Statement of
Financial Accounting Standards (SFAS) No. 109, “Accounting for Income Taxes.” Under the asset and liability method of SFAS
No. 109, deferred tax assets and liabilities are recognized for the future tax
consequences attributable to differences between the financial statement
carrying amounts of existing assets and liabilities and their respective tax
basis. Deferred tax assets and liabilities are measured using the enacted tax
rates expected to apply to taxable income in future years and are subsequently
adjusted for changes in the rates. The effect on deferred tax assets and
liabilities of a change in tax rates is a charge or credit to deferred tax
expense in the period of enactment. See
Note 10 for further discussion.
43
Advertising Costs. The
Company expenses advertising costs as they are incurred. Advertising expense
was approximately $35.6 million, $21.7 million and $14.4 million in fiscal
2006, 2005 and 2004, respectively.
Stock Splits. In
April 2002 and in January 2005, we completed two-for-one splits of our common
stock in the form of stock dividends. All share and per share amounts have been
restated to reflect the stock splits.
Earnings Per Share. We compute basic earnings per share by dividing net earnings
available to common stockholders by the weighted average number of common
shares outstanding during the period. Diluted earnings per share gives effect
to the potential dilution that could occur if securities or contracts to issue
common stock that are dilutive were exercised or converted into common stock or
resulted in the issuance of common stock that then shared in our earnings.
Stock-Based Compensation.
In the first quarter of 2006, we
adopted Statement SFAS No. 123R, Share-Based Payment (“SFAS
No. 123R”), which revises SFAS No. 123, Accounting for Stock-Based
Compensation. Prior to 2006,
we accounted for stock awards granted to employees under the recognition and
measurement principles of Accounting Principles Board Opinion No. 25, Accounting for Stock Issued to Employees, and Related Interpretations. As a result, in periods prior to fiscal year
2006, no compensation expense was recognized for stock options granted to
employees because we did not grant stock options with exercise prices below the
market price of the underlying stock on the date of the grant.
SFAS No. 123R applies to new awards and to awards
modified, repurchased or cancelled after the required effective date, as well
as to the unvested portion of awards outstanding as of the required effective
date. We use the Black-Scholes model to
value new stock option grants under SFAS No. 123R. We have applied the “modified prospective
method” for existing grants, which requires us to value stock options prior to
our adoption of SFAS No. 123R under the fair value method and expense the
unvested portion over the remaining vesting period. SFAS No. 123R also requires us to estimate
forfeitures in calculating the expense related to stock-based compensation and
to reflect the benefits of tax deductions in excess of recognized compensation
expense as both a financing inflow and an operating cash outflow upon adoption.
Goodwill. Upon
our January 1, 2002 adoption of SFAS No. 142, “Goodwill and Other Intangible
Assets,” goodwill is no longer subject to amortization, though it is subject to
at least an annual assessment for impairment by applying a fair value-based
test. If the carrying amount of the net assets of an identified reporting unit
exceeds the fair value of that reporting unit, goodwill is considered to be
impaired. Our operations in each state are considered a reporting unit. We continually evaluate whether events and
circumstances have occurred that indicate the remaining balance of goodwill of
each reporting unit may not be recoverable. In determining fair value, we use
various valuation methodologies, including discounted cash flow models and
enterprise value computations.
Inherent
in our fair value determinations are certain judgements and estimates,
including projections of future cash flows, the discount rate reflecting the
risk inherent in future cash flows, the interpretation of current economic
indicators and market valuations and our strategic plans with regard to our
operations. A change in these underlying
assumptions may cause a change in the results of our analysis, which could
result in the fair value of one or more reporting units to be less than their
respective carrying amounts. In
addition, to the extent that there are significant changes in market conditions
or overall economic conditions or our strategic plans change, it is possible
that our conclusion regarding goodwill impairment could change, which could
have a material adverse effect on our financial position and results of
operations.
Fair Value of Financial
Instruments. We determine fair value of financial
instruments as required by SFAS No. 107, “Disclosures About Fair Value of
Financial Instruments.”
The estimated fair value of our 7.0% senior notes at
December 31, 2006 and 2005 was $128.1 and $123.5 million, respectively, based
on quoted market prices by independent dealers. The aggregate principal amount
of these notes at December 31, 2006 and 2005 was $130.0 million.
The estimated fair value of our 6.25% senior notes at
December 31, 2006 and 2005 was $332.5 million and $320.3 million, respectively,
based on quoted market prices by independent dealers. The aggregate principal
amount of these notes at December 31, 2006 and 2005 was $350.0 million.
Our revolving credit facility and liabilities related
to our model lease program carry interest rates that are variable and/or
comparable to current market rates based on the nature of the obligations,
their terms and remaining maturity, and therefore, the cost basis approximates
fair value.
44
Due to the short-term nature of other financial assets
and liabilities, we consider the carrying amounts of our short-term financial
instruments to approximate fair value.
Recently Issued
Accounting Pronouncements.
In September 2006, the Securities and Exchange Commission (“SEC”)
issued Staff Accounting Bulletin No. 108 (“SAB No. 108”). Due to diversity in practice among
registrants, SAB No. 108 expresses SEC staff views regarding the process by
which misstatements in financial statements are evaluated for purposes of
determining whether financial statement restatement is necessary. SAB No. 108 is effective for fiscal years
ending after November 15, 2006. The
adoption of SAB No. 108 did not have a material impact on our consolidated
financial statements.
In September 2006, the Financial Accounting Standards
Board (“FASB”) issued Statement of Financial Accounting Standard (“SFAS”) No.
157, Fair Value Measurements (“SFAS No. 157”). SFAS No. 157 defines fair value, establishes
a framework for measuring fair value in generally accepted accounting
principles and expands disclosures about fair value measurements. SFAS No. 157 is effective for financial
statements issued for fiscal years beginning after November 15, 2007, and
interim periods within those fiscal years.
We are currently reviewing the effect of SFAS No. 157, if any, on our
consolidated financial statements.
In June 2006, the FASB issued FASB Interpretation No.
48, Accounting for Uncertainty in Income Taxes, an
interpretation of SFAS No. 109 (“FIN 48”). FIN 48 clarifies the accounting for
uncertainty in income taxes recognized in an enterprise’s financial statements
in accordance with SFAS No. 109, Accounting for Income
Taxes. FIN 48 prescribes a
recognition threshold and measurement attribute for the financial statement
recognition and measurement of a tax position taken or expected to be taken in
a tax return. FIN 48 also provides
guidance on derecognition, classification, interest and penalties, accounting
in interim periods, disclosure and transition.
FIN 48 is effective for fiscal years beginning after December 15,
2006. Upon adoption, FIN 48 requires an
adjustment to retained earnings for the initial cumulative effect of the
interpretation. We are continuing to
review and evaluate the impact of FIN 48 on our retained earnings.
Reference is made to Note 9 regarding our adoption of
SFAS No. 123R, “Share-based Payment.”
NOTE 2 -
REAL ESTATE AND CAPITALIZED INTEREST
Real
estate at December 31 consists of the following (in thousands):
|
|
|
2006
|
|
2005
|
|
|
Homes under
contract under construction
|
|
$
|
589,241
|
|
$
|
815,925
|
|
|
Finished home
sites and home sites under development
|
|
592,949
|
|
370,921
|
|
|
Unsold homes,
completed and under construction
|
|
271,559
|
|
116,088
|
|
|
Model homes
|
|
39,131
|
|
45,060
|
|
|
Model home lease
program
|
|
26,831
|
|
39,336
|
|
|
Land held for
development
|
|
10,891
|
|
3,473
|
|
|
|
|
$
|
1,530,602
|
|
$
|
1,390,803
|
|
Subject to sufficient qualifying assets, we capitalize
all development period interest costs incurred in connection with the
development and construction of real estate. Capitalized interest is allocated
to real estate when incurred and charged to cost of closings when the related
property is delivered. Certain information regarding interest follows (in
thousands):
|
|
|
Years Ended December 31,
|
|
|
|
|
2006
|
|
2005
|
|
|
Capitalized
interest, beginning of year
|
|
$
|
23,939
|
|
$
|
19,701
|
|
|
Interest
incurred and capitalized
|
|
52,063
|
|
43,034
|
|
|
Amortization to
cost of home and land closings
|
|
(42,986
|
)
|
(38,796
|
)
|
|
Capitalized interest,
end of year
|
|
$
|
33,016
|
|
$
|
23,939
|
|
NOTE 3 –
VARIABLE INTEREST ENTITIES AND CONSOLIDATED REAL ESTATE NOT OWNED
FASB Interpretation No. 46 (revised December 2003), “Consolidation of Variable Interest Entities” (“FIN 46R”)
requires the consolidation of entities in which an enterprise absorbs a majority
of the entity’s expected losses, receives a majority of the entity’s expected
residual returns, or both, as a result of ownership, contractual or other
financial interests in the entity. Prior to the issuance of FIN 46R, entities
were generally consolidated by an enterprise when it had a controlling
45
financial
interest through ownership of a majority voting interest in the entity.
Under FIN 46R, a variable interest entity, or VIE, is created when any
of the following factors are present: (i) the equity investment at risk is not
sufficient to permit the entity to finance its activities without additional
subordinated financial support from other parties, (ii) equity holders either
(a) lack direct or indirect ability to make decisions about the entity, (b) are
not obligated to absorb expected losses of the entity, or (c) do not have the
right to receive expected residual returns of the entity or (iii) the equity
investors as a group are considered to lack the direct or indirect ability to
make decisions about the entity if (x) the voting rights of some investors are
not proportional to their obligations to absorb the expected losses of the
entity, their rights to receive the expected residual returns of the entity, or
both, and (y) substantially all of the entity’s activities either involve or
are conducted on behalf of an investor that has disproportionately fewer voting
rights.
Based on the provisions of FIN 46R, we have concluded
that when we enter into option or purchase agreements to acquire land or lots
from an entity and pay a non-refundable deposit, a VIE is created because we
are deemed to have provided subordinated financial support, which refers to
variable interests that will absorb some or all of an entity’s expected losses
if they occur. For each VIE created, we compute expected losses and residual
returns based on the probability of future cash flows as outlined in FIN 46R.
If we are deemed to be the primary beneficiary of the VIE, because we are
obligated to absorb the majority of the expected losses, receive the majority
of the residual returns, or both, we will consolidate the VIE in our
consolidated financial statements. Not all of our purchase or option agreements
are determined to be VIEs.
We have
applied FIN 46R by developing a methodology to determine whether or not we are
the primary beneficiary of the VIE. Part of this methodology requires the use
of estimates in assigning probabilities to various future cash flow
possibilities relative to changes in the fair value and changes in the development
costs associated with the property. Although we believe that our accounting
policy properly identifies our primary beneficiary status with these VIEs,
changes in the probability estimates could produce different conclusions
regarding our primary beneficiary status.
We
generally do not have any ownership interest in the VIEs that hold the lots and
land under option or contract, and accordingly, we generally do not have legal
or other access to the VIEs’ books or records. Therefore, it is not possible
for us to compel the VIEs to provide financial or other data to us in
performing our primary beneficiary evaluation. Accordingly, this lack of
information from the VIEs may result in our evaluation being conducted
primarily based on management’s judgments and estimates.
In most cases, creditors, if any, of the entities with which we have
option agreements have no recourse against us and the maximum exposure to loss
in our option agreements is limited to our option deposit. Often, we are at
risk for items over budget related to land development on property we have
under option. In these cases, we have contracted to complete development at a
fixed cost on behalf of the land owner. Some of our option deposits may be
refundable if certain contractual conditions are not performed by the party
selling the lots.
46
The table below presents a summary of our lots under option at December
31, 2006 (dollars in thousands):
|
|
|
|
|
|
|
|
|
Option/Earnest
Money Deposits
|
|
|
|
|
Number
of Lots
|
|
Fair
Value
|
|
Purchase
Price
|
|
Cash
|
|
Letters
of Credit
|
|
|
Options recorded
on balance sheet as real estate not owned (1) (3)
|
|
170
|
|
$
|
5,269
|
|
$
|
—
|
|
$
|
1,000
|
|
$
|
—
|
|
|
|
|
|
|
|
|
|
|
|
|
|
|
|
Option contracts
not recorded on balance sheet –
non-refundable deposits (1)
|
|
29,072
|
|
N/A
|
|
$
|
1,673,046
|
|
$
|
133,393
|
|
$
|
63,501
|
|
|
Purchase
contracts not recorded on balance sheet –
non-refundable deposits (1)
|
|
7,279
|
|
N/A
|
|
261,962
|
|
32,939
|
|
803
|
|
|
Purchase
contracts not recorded on balance sheet – refundable deposits (2)
|
|
3,720
|
|
N/A
|
|
126,515
|
|
800
|
|
—
|
|
|
Total options not recorded on balance sheet
|
|
40,071
|
|
N/A
|
|
2,061,523
|
|
167,132
|
|
64,304
|
|
|
Total lots under
option or contract
|
|
40,241
|
|
$
|
5,269
|
|
$
|
2,061,523
|
|
$
|
168,132
|
|
$
|
64,304
|
|
(1) Deposits are
non-refundable except if certain contractual conditions are not performed by
the selling party.
(2) Deposits are
refundable at our sole discretion. We
have not completed our acquisition evaluation process on these lots and we have
not internally committed to purchase them.
(3) The purpose and
nature of these consolidated lot option contracts (VIEs) is to provide the
Company with the option to purchase the lots in anticipation of building homes
on the lots in the future.
Note: Our option to purchase lots
remains effective so long as we purchase a pre-established minimum number of
lots each month or quarter, as determined by the agreement. The pre-established
number of lots typically is structured to approximate our expected rate of home
orders at the inception of the option.
Generally, our options to purchase lots remain
effective so long as we purchase a pre-established minimum number of lots each
month or quarter, as determined by the respective agreement. Although the
pre-established number is typically structured to approximate our expected rate
of home construction starts, during a weakened homebuilding market, as we are
currently experiencing, we may purchase lots at an absorption level that
exceeds our sales pace.
NOTE 4 – INVESTMENTS IN UNCONSOLIDATED ENTITIES
We participate in homebuilding and land development
joint ventures from time to time as a means of accessing larger parcels of land
and lot positions, expanding our market opportunities, managing our risk
profile and leveraging our capital base.
Based on the structure of these joint ventures, they may or may not be
consolidated into our results. Our joint
venture partners generally are other homebuilders, land sellers or real estate
investors. We also enter into mortgage
and title business joint ventures from time to time. These unconsolidated entities follow
accounting principles generally accepted in the United States of America and we
generally share in their profits and losses in accordance with our ownership
interests.
For land development joint ventures, we, and in some
cases our joint venture partners, usually receive an option or other similar
arrangement to purchase portions of the land held by the joint venture. Option prices are generally negotiated prices
that approximate market value when we enter into the option contract. For homebuilding and land development joint
ventures, our share of the joint venture earnings relating to lots we purchase
from the joint ventures is deferred until homes are delivered by us and title
passes to a homebuyer. At such time, we
allocate our joint venture earnings to the land acquired by us as a reduction
in the basis of the property.
47
We and/or our joint venture partners occasionally
provide limited repayment guarantees on a pro rata basis on the debt of certain
unconsolidated land acquisition and development joint ventures. At December 31, 2006, our share of these
limited pro rata repayment guarantees was approximately $38.6 million.
In addition, we and/or our joint venture partners
occasionally provide guarantees that are only applicable if and when the joint
venture directly, or indirectly through agreement with its joint venture
partners or other third parties, causes the joint venture to voluntarily file a
bankruptcy or similar liquidation or reorganization action or take other
actions that are fraudulent or improper (commonly referred to as “bad boy
guarantees”). These types of guarantees
typically are on a pro rata basis and are designed to protect the respective
secured lender’s remedies with respect to its mortgage or other secured lien on
the joint venture’s underlying property.
To date, no such guarantees have been invoked and we believe it is
unlikely that such a guarantee would be invoked in the future as it would
require us to voluntarily take actions that would generally be disadvantageous
to the joint venture and to us. At December
31, 2006, we had outstanding guarantees of this type totaling approximately
$82.3 million. By definition, these
guarantees, unless invoked as described above, are not considered guarantees or
indebtedness under our revolving credit facility or senior note indentures.
We believe that the equity method of accounting is
appropriate for our invements in unconsolidated entities where we are not the
primary beneficiary, we do not have a controlling interest, and our ownership
interest exceeds 20%. Summarized
condensed financial information related to unconsolidated joint ventures that
are accounted for using the equity method was as follows:
|
|
|
At December 31,
|
|
|
|
|
2006
|
|
2005
|
|
|
|
|
(in thousands)
|
|
|
Assets:
|
|
|
|
|
|
|
Cash
|
|
$
|
14,392
|
|
$
|
10,337
|
|
|
Real estate
|
|
723,753
|
|
524,775
|
|
|
Other assets
|
|
25,722
|
|
22,373
|
|
|
Total assets
|
|
$
|
763,867
|
|
$
|
557,485
|
|
|
|
|
|
|
|
|
|
Liabilities
and equity:
|
|
|
|
|
|
|
Accounts payable
and other liabilities
|
|
$
|
26,639
|
|
$
|
32,244
|
|
|
Notes and
mortgages payable
|
|
471,197
|
|
299,498
|
|
|
Equity of:
|
|
|
|
|
|
|
Meritage
|
|
93,792
|
|
72,362
|
|
|
Other
|
|
172,239
|
|
153,381
|
|
|
Total
liabilities and equity
|
|
$
|
763,867
|
|
$
|
557,485
|
|
|
|
|
Years Ended December 31,
|
|
|
|
|
2006
|
|
2005
|
|
2004
|
|
|
|
|
(in thousands)
|
|
|
|
|
|
|
|
|
|
|
|
Revenue
|
|
$
|
100,322
|
|
$
|
145,580
|
|
$
|
29,130
|
|
|
Costs and
expenses
|
|
(51,717
|
)
|
(91,289
|
)
|
(21,917
|
)
|
|
Net earnings of
unconsolidated entities
|
|
$
|
48,605
|
|
$
|
54,291
|
|
$
|
7,213
|
|
|
Meritage’s share of
pre-tax earnings *
|
|
$
|
21,170
|
|
$
|
19,420
|
|
$
|
2,788
|
|
* Our share of net earnings is recorded in “Earnings
from unconsolidated entities, net” on our consolidated statements of earnings.
Our share of net earnings excludes joint venture earnings related to lots we
purchased from the joint ventures. Those earnings are deferred until homes are
delivered by us and title passes to a homebuyer.
At December 31, 2006 and December 31, 2005, our
investments in unconsolidated entities includes $2.8 million and $1.5
million, respectively, related to the difference between the amounts at which
our investments are carried and the amount of underlying equity in net assets.
These amounts are amortized to earnings of unconsolidated entities as the assets
of the respective joint ventures are sold. We amortized approximately $0.8
million and $1.1 million to our equity of the joint venture earnings in 2006
and 2005, respectively. There was no
such amortization in 2004.
In addition to joint ventures accounted for under the
equity method summarized in the above table, at December 31,
48
2006,
our investments in unconsolidated entities included joint ventures recorded
under the cost method. These joint ventures were formed to obtain large parcels
of land, to perform off-site development work and to sell lots to the joint venture
members. As of December 31, 2006 and 2005, our investments in unconsolidated
entities recorded under the cost method were $17.7 and $14.9 million,
respectively. For the years ended
December 31, 2006, 2005 and 2004, we have not recorded any income or
distributions from these joint ventures.
As of December 31, 2006, our total investment in
unconsolidated joint ventures of $114.3 million was primarily comprised of
$35.2 million in our West Region and $74.7 million in our Central Region. As of December 31, 2005, our total investment
in unconsolidated joint ventures of $88.7 million was primarily comprised of
$28.5 million in our West Region and $59.4 million in our Central Region.
NOTE 5 –
LOANS PAYABLE AND OTHER BORROWINGS
Loans payable at
December 31 consist of the following (in thousands):
|
|
|
2006
|
|
2005
|
|
|
$850 million
unsecured revolving credit facility maturing May 2010 with extension
provisions, with interest payable monthly approximating LIBOR (approximately
5.32% at December 31, 2006) plus 1.25% or Prime (8.25% at December 31, 2006).
|
|
$
|
226,500
|
|
$
|
72,600
|
|
|
|
|
|
|
|
|
|
Model home lease
program, with interest in the form of lease payments payable monthly
approximating 7.85% at December 31, 2006
|
|
26,831
|
|
39,336
|
|
|
|
|
|
|
|
|
|
Other
borrowings, acquisition and development financing
|
|
1,309
|
|
462
|
|
|
|
|
|
|
|
|
|
Total loans
payable and other borrowings
|
|
$
|
254,640
|
|
$
|
112,398
|
|
We have determined that the construction costs and
related debt associated with certain model homes which are owned and leased to
us by others and that we use to market our communities are required to be
included on our balance sheet. We do not legally own the model homes, but we
are reimbursed by the owner for our construction costs and we have the right,
but not the obligation, to purchase these homes. Although we have no legal
obligation to repay any amounts received from the third-party owner, such
amounts are recorded as debt and are typically deemed repaid when we
simultaneously exercise our option to purchase the model home and sell such
model home to a third-party home buyer. Should we elect not to exercise our
rights to purchase these model homes, the model home costs and related debt
under the model lease program will be eliminated upon the termination of the
lease, which is generally between one and three years from the origination of
the lease. During 2006, $12.5 million of such leases were exercised or
terminated.
On May
16, 2006, we amended and restated our senior unsecured revolving credit
facility (“New Credit Agreement”). Under
the New Credit Agreement, our credit facility was increased from $600 million
to $800 million, and the term was extended from May 2009 to May 2010. On June 30, 2006, we amended our New Credit
Agreement to increase our borrowing capacity under the Credit Agreement by $50
million and to make certain other minor changes. The total borrowing capacity of the credit
facility is now $850 million. The
increase in capacity was made pursuant to an accordion feature contained in the
Credit Agreement. Under this accordion feature,
we may request from time to time an aggregate increase of up to $250 million in
the maximum borrowing commitment, of which $200 million remained available at
December 31, 2006. Each member of the lending group may elect to participate or
not participate in any request we make. In addition, any increase in the
borrowing capacity pursuant to this accordion feature is subject to certain
terms and conditions, including the absence of an event of default.
49
NOTE 6 –
SENIOR NOTES
Senior notes at
December 31 consist of the following (in thousands):
|
|
|
2006
|
|
2005
|
|
|
6.25% senior
notes due 2015. At December 31, 2006 and 2005, there was approximately $1.4
and $1.6 million in unamortized discount, respectively
|
|
$
|
348,571
|
|
$
|
348,396
|
|
|
7.0% senior
notes due 2014. At December 31, 2006 and 2005, there was approximately $0.1
million in unamortized premium.
|
|
130,065
|
|
130,074
|
|
|
9.75% senior
notes due 2011
|
|
—
|
|
1,256
|
|
|
|
|
$
|
478,636
|
|
$
|
479,726
|
|
In March 2005, we used a portion of the proceeds from the $350 million
sale of our 6.25% senior notes to repurchase pursuant to a tender offer and
consent solicitation approximately $276.8 million of our outstanding 9.75%
senior notes due 2011. In connection with this tender offer and repurchase, we
reported a one-time pre-tax charge of approximately $31.5 million for premiums,
commissions and expenses associated with the tender offer and the write-off of
existing offering costs associated with the 9.75% senior notes, net of the
accretion of existing note premiums on the 9.75% senior notes. In 2006, we repurchased the remaining $1.3
million of our outstanding 9.75% senior notes.
The bank facility and indentures for the 7% senior notes due 2014 and
the 6.25% senior notes due 2015 contain covenants which require maintenance of
certain levels of tangible net worth and compliance with certain minimum
financial ratios, place limitations on the payment of dividends and redemptions
of equity, and limit the incurrence of additional indebtedness, asset
dispositions, mergers, certain investments and creations of liens, among other
items. As of and for the year ended December 31, 2006, we were in compliance
with these covenants. After considering our most restrictive bank covenants,
our borrowing availability under the bank credit facility was approximately
$449 million at December 31, 2006 as determined by borrowing base limitations
defined by our agreement with the lending banks. The senior notes restrict our
ability to pay dividends, and at December 31, 2006, our maximum permitted
amount available to pay dividends was $344.1 million.
Obligations to pay principal and interest on the bank credit facility
and senior notes are guaranteed by all of our subsidiaries (collectively, the
Guarantor Subsidiaries), each of which is directly or indirectly 100% owned by
Meritage Homes Corporation. Such guarantees are full and unconditional, and
joint and several. Separate financial statements of the Guarantor Subsidiaries
are not provided because Meritage (the parent company) has no independent
assets or operations, the guarantees are full and unconditional and joint and
several. There are no significant restrictions on the ability of the parent
company or any guarantor to obtain funds from its subsidiaries by dividend or
loan.
Scheduled principal maturities of loans payable and other borrowings
and senior notes as of December 31, 2006 follow (in thousands):
|
Year Ended December 31,
|
|
|
|
|
2007
|
|
$
|
27,964
|
|
|
2008
|
|
176
|
|
|
2009
|
|
—
|
|
|
2010
|
|
226,500
|
|
|
2011
|
|
—
|
|
|
Thereafter
|
|
480,000
|
|
|
|
|
$
|
734,640
|
|
NOTE 7 –
ACQUISITIONS AND GOODWILL
Greater Homes. In September 2005 we purchased all of the
outstanding stock of Greater Homes, Inc. (“Greater Homes”), a builder of
single-family homes in Orlando, Florida. The purchase price was approximately
$86.2 million in cash, including the repayment of existing debt of
approximately $27.7 million. The results of Greater Homes’ operations have been
included in our financial statements since September 1, 2005, the effective
date of the acquisition.
Colonial Homes. In February 2005, we purchased the
homebuilding and related assets of Colonial Homes of Florida (“Colonial Homes”),
which operates primarily in the Ft. Myers/Naples area. The purchase price was
approximately $66.2
50
million in cash. The results of Colonial Homes’
operations have been included in our consolidated financial statements as of
the effective date of acquisition, February 1, 2005.
Goodwill. Goodwill represents the excess of the purchase price
of our acquisitions over the fair value of the assets acquired. The
acquisitions of Colonial Homes and Greater Homes were recorded using the
purchase method of accounting. The purchase prices were allocated based on
estimated fair value of the assets and liabilities assumed at the date of the
acquisition. The excess purchase price over the fair value of the net assets,
of $27.9 million and $10.1 million for Colonial Homes and Greater Homes,
respectively, were recorded as goodwill, which is included on our consolidated
balance sheets. We expect that substantially all of the goodwill recorded for
the Colonial Homes acquisition will be deductible for tax purposes.
The changes in the carrying amount of goodwill for the years ended
December 31, 2006 and 2005 were as follows (in thousands):
|
|
|
Corporate
|
|
West
|
|
Central
|
|
East
|
|
Total
|
|
|
Balance at
January 1, 2005
|
|
$
|
1,323
|
|
$
|
36,036
|
|
$
|
54,116
|
|
$
|
—
|
|
$
|
91,475
|
|
|
Goodwill
acquired during the year
|
|
—
|
|
—
|
|
—
|
|
37,802
|
|
37,802
|
|
|
Increase due to
earn-out agreements
|
|
—
|
|
1,476
|
|
—
|
|
—
|
|
1,476
|
|
|
Amortization of
excess tax basis
|
|
—
|
|
(117
|
)
|
(73
|
)
|
(341
|
)
|
(531
|
)
|
|
Balance at
December 31, 2005
|
|
1,323
|
|
37,395
|
|
54,043
|
|
37,461
|
|
130,222
|
|
|
Amortization of
excess tax basis
|
|
—
|
|
(118
|
)
|
(73
|
)
|
(372
|
)
|
(563
|
)
|
|
Balance at December 31,
2006
|
|
$
|
1,323
|
|
$
|
37,277
|
|
$
|
53,970
|
|
$
|
37,089
|
|
$
|
129,659
|
|
From time to time, we may acquire companies that are determined to have
a tax basis goodwill in excess of book basis goodwill. Current tax law provides
for the amortization of purchased goodwill. Under this circumstance, SFAS No.
109 requires that the goodwill be separated into two components. The first
component is equivalent to book goodwill and future tax amortization of this
component is treated as a temporary difference, for which a deferred tax
liability is established. The second component is the excess tax goodwill over
the book goodwill, for which no deferred taxes are recognized. The tax benefit
from the recognition on the tax return of the amortization of the second
component is treated as a reduction in the book basis of goodwill.
Under the guidelines contained in SFAS No. 142, “Goodwill and
Other Intangible Assets,” management selected January 1 as the date
of our annual goodwill impairment test. During 2006 and 2005, management
performed an analysis of potential impairment of goodwill carried and
determined that no impairment existed. We completed our analysis of potential
impairment of goodwill carried on our balance sheet at December 31, 2006, and determined
that no impairment existed.
See Note 11 for a summary of the allocation of the purchase price to
acquired assets and liabilities.
51
NOTE
8 – EARNINGS PER SHARE
Basic and diluted earnings per share for the years
ended December 31, were calculated as follows (in thousands, except per share
amounts):
|
|
|
2006
|
|
2005
|
|
2004
|
|
|
|
|
|
|
|
|
|
|
|
Basic average
number of shares outstanding
|
|
26,448
|
|
26,977
|
|
26,066
|
|
|
|
|
|
|
|
|
|
|
|
Effect of
dilutive securities:
|
|
|
|
|
|
|
|
|
Options to acquire common stock
|
|
654
|
|
1,810
|
|
1,544
|
|
|
Diluted average shares outstanding
|
|
27,102
|
|
28,787
|
|
27,610
|
|
|
|
|
|
|
|
|
|
|
|
Net earnings
|
|
$
|
225,354
|
|
$
|
255,665
|
|
$
|
138,968
|
|
|
|
|
|
|
|
|
|
|
|
Basic earnings
per share
|
|
$
|
8.52
|
|
$
|
9.48
|
|
$
|
5.33
|
|
|
|
|
|
|
|
|
|
|
|
Diluted earnings
per share
|
|
$
|
8.32
|
|
$
|
8.88
|
|
$
|
5.03
|
|
|
|
|
|
|
|
|
|
|
|
Antidilutive stock
options not included in the calculation of diluted earnings per share
|
|
657
|
|
52
|
|
—
|
|
NOTE 9 –
INCENTIVE AWARDS AND RETIREMENT PLAN
Stock Based Compensation
In the first quarter of 2006, we adopted Statement
SFAS No. 123R, Share-Based Payment (“SFAS No.
123R”), which revised SFAS No. 123, Accounting for Stock-Based
Compensation. Prior to 2006,
we accounted for stock awards granted to employees under the recognition and
measurement principles of Accounting Principles Board Opinion No. 25, Accounting for Stock Issued to Employees, and Related Interpretations. As a result, in periods prior to fiscal year
2006, no compensation expense was recognized for stock options granted to
employees because we did not grant stock options with exercise prices below the
market price of the underlying stock on the date of the grant.
SFAS No. 123R applies to new awards and to awards
modified, repurchased or cancelled after the required effective date, as well
as to the unvested portion of awards outstanding as of the required effective
date. We use the Black-Scholes model to
value new stock option grants under SFAS No. 123R. We have applied the “modified prospective
method” for existing grants, which requires us to value stock options prior to
our adoption of SFAS No. 123R under the fair value method and expense the
unvested portion over the remaining vesting period. SFAS No. 123R also requires us to estimate
forfeitures in calculating the expense related to stock-based compensation and
to reflect the benefits of tax deductions in excess of recognized compensation
expense as both a financing inflow and an operating cash outflow upon adoption.
We have two stock compensation plans, the Meritage
Stock Option Plan, which was adopted in 1997 and has been amended from time to
time (the “1997 Plan”), and the Stock Incentive Plan (the “2006 Plan” and
together with the 1997 Plan, the “Plans”).
The Plans, which were approved by our stockholders, are administered by
our Board of Directors. The provisions
of the Plans are generally consistent with the exception that the 2006 Plan
allows for the grant of stock appreciation rights, restricted stock awards,
performance share awards and performance-based awards in addition to the
non-qualified and incentive stock options allowed under the 1997 Plan. The Plans authorize awards to officers, key
employees, non-employee directors and consultants for up to 6,600,000 shares of
common stock, of which 1,042,701 shares remain available for grant at December
31, 2006. We believe that such awards provide
a means of performance-based compensation to attract and retain qualified
employees and better align the interests of our employees with those of our
stockholders. Option awards are granted
with an exercise price equal to the market price of Meritage stock at the date
of grant, and generally have a five-year ratable vesting period and a
seven-year contractual term.
The fair values of option awards are estimated using a
Black-Scholes option pricing model that uses the assumptions noted in the
following table. Beginning January 1,
2006, expected volatilities are based on a combination of implied volatilities
from traded options on our stock and historical volatility of our stock. Expected term, which represents the period of
time that options granted are expected to be outstanding, is estimated using
historical data. Groups of employees
that have
52
similar
historical exercise behavior are considered separately for valuation
purposes. The risk-free interest rate
for periods within the contractual life of the option is based on the U.S.
Treasury yield curve.
|
|
|
2006
|
|
2005
|
|
2004
|
|
|
Expected
dividend yield
|
|
0
|
%
|
0
|
%
|
0
|
%
|
|
Risk-free
interest rate
|
|
5.01
|
%
|
4.41
|
%
|
4.39
|
%
|
|
Expected
volatility
|
|
46.26
|
%
|
52.10
|
%
|
55.50
|
%
|
|
Expected life
(in years)
|
|
5
|
|
7
|
|
7
|
|
|
Weighted average fair
value of options
|
|
$
|
24.28
|
|
$
|
35.13
|
|
$
|
19.37
|
|
|
|
|
|
|
|
|
|
|
|
|
The following table illustrates the effect on net
income and earnings per share for the years ended December 31, 2005 and 2004,
respectively, as if our stock-based compensation had been determined based on
the fair value at the grant dates for awards made prior to 2006, under the
Plans and consistent with SFAS No. 123R (in thousands, except per share
amounts):
|
|
|
Years Ended December 31,
|
|
|
|
|
(in thousands, except per share amounts)
|
|
|
|
|
2005
|
|
2004
|
|
|
|
|
|
|
|
|
|
Net
earnings
|
|
|
|
|
|
|
As reported
|
|
$
|
255,665
|
|
$
|
138,968
|
|
|
Deduct*
|
|
(7,501
|
)
|
(4,357
|
)
|
|
Pro forma
|
|
$
|
248,164
|
|
$
|
134,611
|
|
|
|
|
|
|
|
|
|
Basic
earnings per share
|
|
|
|
|
|
|
As reported
|
|
$
|
9.48
|
|
$
|
5.33
|
|
|
Pro forma
|
|
$
|
9.20
|
|
$
|
5.16
|
|
|
|
|
|
|
|
|
|
Diluted
earnings per share
|
|
|
|
|
|
|
As reported
|
|
$
|
8.88
|
|
$
|
5.03
|
|
|
Pro forma
|
|
$
|
8.62
|
|
$
|
4.88
|
|
* Deduct: Total
stock-based employee compensation expense determined under fair value based
method for awards, net of related tax effects.
53
Summary of stock option activity:
|
|
|
Years Ended December 31,
|
|
|
|
|
2006
|
|
|
|
|
Options
|
|
Weighted
Average
Exercise
Price
|
|
Weighted
Average
Remaining
Contractual
Life
|
|
Aggregate
Intrinsic Value
(In thousands)
|
|
|
|
|
|
|
|
|
|
|
|
|
|
Options
outstanding at beginning of year:
|
|
2,799,282
|
|
$
|
27.90
|
|
|
|
|
|
|
Granted
|
|
662,000
|
|
$
|
52.70
|
|
|
|
|
|
|
Exercised
|
|
(922,726
|
)
|
$
|
14.67
|
|
|
|
|
|
|
Cancelled
|
|
(615,502
|
)
|
$
|
41.26
|
|
|
|
|
|
|
Outstanding at
end of year
|
|
1,923,054
|
|
$
|
38.51
|
|
4.6
|
|
$
|
74,048
|
|
|
|
|
|
|
|
|
|
|
|
|
|
Vested and
expected to vest at end of year
|
|
1,682,017
|
|
$
|
36.99
|
|
4.3
|
|
$
|
23,961
|
|
|
|
|
|
|
|
|
|
|
|
|
|
Exercisable at
end of year
|
|
676,854
|
|
$
|
25.07
|
|
3.1
|
|
$
|
16,970
|
|
|
|
|
|
|
|
|
|
|
|
|
|
Price range of
options exercised
|
|
$
|
1.41 - $55.92
|
|
|
|
|
|
|
|
|
|
|
|
|
|
|
|
|
|
|
|
Price range of
options outstanding
|
|
$
|
3.59 - $81.96
|
|
|
|
|
|
|
|
|
|
|
|
|
|
|
|
|
|
|
|
Total shares
reserved for existing or future grants at end of year
|
|
2,965,755
|
|
|
|
|
|
|
|
|
|
|
Years Ended December 31,
|
|
|
|
|
2005
|
|
2004
|
|
|
|
|
Options
|
|
Weighted
Average
Exercise
Price
|
|
Options
|
|
Weighted
Average
Exercise
Price
|
|
|
|
|
|
|
|
|
|
|
|
|
|
Options
outstanding at beginning of year:
|
|
2,901,030
|
|
$
|
17.73
|
|
2,693,024
|
|
$
|
11.37
|
|
|
Granted
|
|
588,750
|
|
$
|
60.40
|
|
880,500
|
|
$
|
31.86
|
|
|
Exercised
|
|
(617,298
|
)
|
$
|
11.33
|
|
(500,974
|
)
|
$
|
8.22
|
|
|
Cancelled
|
|
(73,200
|
)
|
$
|
26.03
|
|
(171,520
|
)
|
$
|
18.21
|
|
|
Outstanding at
end of year
|
|
2,799,282
|
|
$
|
27.90
|
|
2,901,030
|
|
$
|
17.73
|
|
|
|
|
|
|
|
|
|
|
|
|
|
Exercisable at
end of year
|
|
961,130
|
|
|
|
855,708
|
|
|
|
|
|
|
|
|
|
|
|
|
|
|
|
Price range of
options exercised
|
|
$
|
1.41 - $36.91
|
|
|
|
$
|
2.50 - $26.24
|
|
|
|
|
|
|
|
|
|
|
|
|
|
|
|
Price range of
options outstanding
|
|
$
|
1.41 - $81.96
|
|
|
|
$
|
1.41 - 44.29
|
|
|
|
|
|
|
|
|
|
|
|
|
|
|
|
Total shares
reserved for existing or future grants at end of year
|
|
3,289,872
|
|
|
|
3,907,170
|
|
|
|
Summary of Nonvested Shares Activity:
|
Nonvested Shares
|
|
Shares
|
|
Weighted Average
Grant Date Fair Value
|
|
|
|
|
|
|
|
|
|
Nonvested at
January 1, 2006
|
|
—
|
|
—
|
|
|
Granted
|
|
93,886
|
|
$
|
48.54
|
|
|
Vested
|
|
—
|
|
|
|
|
Cancelled
|
|
(20,443
|
)
|
$
|
54.87
|
|
|
Nonvested at December
31, 2006
|
|
73,443
|
|
$
|
46.78
|
|
Stock options outstanding at December 31, 2006, were:
|
|
|
Stock Options Outstanding
|
|
Stock Options Exercisable
|
|
|
Range of
Exercise Prices
|
|
Number
Outstanding
|
|
Weighted
Average
Contractual
Life
|
|
Weighted
Average
Exercise Price
|
|
Number
Exercisable
|
|
Weighted
Average
Exercise Price
|
|
|
|
|
|
|
|
|
|
|
|
|
|
|
|
$ 0.00
- $16.39
|
|
359,904
|
|
2.4
|
|
$
|
12.44
|
|
252,384
|
|
$
|
10.92
|
|
|
$16.40 - $32.78
|
|
588,000
|
|
3.6
|
|
$
|
27.23
|
|
307,720
|
|
$
|
25.01
|
|
|
$32.79 - $49.17
|
|
117,500
|
|
5.9
|
|
$
|
40.46
|
|
24,000
|
|
$
|
37.09
|
|
|
$49.18 - $65.56
|
|
801,650
|
|
5.9
|
|
$
|
55.81
|
|
79,550
|
|
$
|
58.54
|
|
|
$65.57 - $81.96
|
|
56,000
|
|
5.5
|
|
$
|
72.61
|
|
13,200
|
|
$
|
73.58
|
|
|
|
|
|
|
|
|
|
|
|
|
|
|
|
|
|
1,923,054
|
|
4.5
|
|
$
|
38.51
|
|
676,854
|
|
$
|
25.07
|
|
The total intrinsic value of options exercises for the
years ended December 31, 2006, 2005 and 2004 was $35.2, $36.3 and $14.0,
respectively. The intrinsic value of a
stock option is the amount by which the market value of the underlying stock
exceeds the exercise price of the stock option.
54
As of December 31, 2006, we
had $27.5 million of total unrecognized compensation cost related to non-vested
stock-based compensation arrangements granted under the Plans that will be
recognized on a straight-line basis over the remaining vesting periods. That cost is expected to be recognized over a
weighted-average period of 3.42 years.
For the year ended December 31, 2006, our total stock-based compensation
expense was $11.5 million ($8.5 million net of tax). Stock compensation expense net of tax for the
year ended December 31, 2006, was $0.32 and $0.31 per basic and diluted share,
respectively.
Cash received from option
exercises under the Plans for the years ended December 31, 2006, 2005 and 2004
was $13.5 million, $7.0 million and $4.1 million, respectively. The actual tax benefit realized for the tax
deductions from option exercises totaled $10.8 million, $10.5 million and $3.0
million for the years ended December 31, 2006, 2005 and 2004, respectively.
401(k) Retirement Plan
We have a 401(k) plan for
all full-time Meritage employees who have been with the Company for a period of
six months or more. We match portions of employees’ voluntary contributions,
and contributed to the plan approximately $2.0 million, $1.4 million and $1.2
million for the years ended 2006, 2005 and 2004, respectively.
NOTE 10 –
INCOME TAXES
Components of income tax expense (benefit) follow (in
thousands):
|
|
|
Years Ended December 31,
|
|
|
|
|
2006
|
|
2005
|
|
2004
|
|
|
Current taxes:
|
|
|
|
|
|
|
|
|
Federal
|
|
$
|
165,274
|
|
$
|
144,287
|
|
$
|
74,819
|
|
|
State
|
|
22,365
|
|
22,238
|
|
10,362
|
|
|
|
|
187,639
|
|
166,525
|
|
85,181
|
|
|
Deferred taxes:
|
|
|
|
|
|
|
|
|
Federal
|
|
(44,870
|
)
|
(5,170
|
)
|
524
|
|
|
State
|
|
(4,114
|
)
|
(795
|
)
|
85
|
|
|
|
|
(48,984
|
)
|
(5,965
|
)
|
609
|
|
|
|
|
|
|
|
|
|
|
|
Total
|
|
$
|
138,655
|
|
$
|
160,560
|
|
$
|
85,790
|
|
Income taxes differ for the years ended December 31,
2006, 2005 and 2004, from the amounts computed using the expected federal
statutory income tax rate of 35% as a result of the following (in thousands):
|
|
|
Years Ended December 31,
|
|
|
|
|
2006
|
|
2005
|
|
2004
|
|
|
Expected taxes at
current federal statutory income tax rate
|
|
$
|
127,403
|
|
$
|
145,679
|
|
$
|
78,665
|
|
|
State income taxes, net
of federal tax benefit
|
|
11,863
|
|
13,938
|
|
6,791
|
|
|
Non-deductible costs
and other
|
|
(611
|
)
|
943
|
|
334
|
|
|
Income tax expense
|
|
$
|
138,655
|
|
$
|
160,560
|
|
$
|
85,790
|
|
55
Deferred tax assets and liabilities have been
recognized in the consolidated balance sheets due to the following temporary
differences at December 31 (in thousands):
|
|
|
2006
|
|
2005
|
|
|
Deferred tax assets:
|
|
|
|
|
|
|
Real estate
|
|
$
|
13,904
|
|
$
|
—
|
|
|
Warranty reserve
|
|
11,678
|
|
7,859
|
|
|
Wages payable
|
|
6,599
|
|
1,828
|
|
|
Reserves and
allowances
|
|
3,856
|
|
1,685
|
|
|
Deferred revenue
|
|
3,182
|
|
—
|
|
|
Equity-based
compensation
|
|
2,530
|
|
—
|
|
|
Accrued expenses
|
|
1,115
|
|
1,770
|
|
|
Other
|
|
1,086
|
|
450
|
|
|
Total deferred
tax assets
|
|
43,950
|
|
13,592
|
|
|
|
|
|
|
|
|
|
Deferred tax
liabilities:
|
|
|
|
|
|
|
Goodwill
|
|
12,024
|
|
8,607
|
|
|
Intangibles
|
|
1,471
|
|
3,681
|
|
|
Prepaids
|
|
1,353
|
|
1,959
|
|
|
Fixed assets
|
|
924
|
|
1,882
|
|
|
Other
|
|
59
|
|
565
|
|
|
Real estate
|
|
—
|
|
17,763
|
|
|
Total deferred
tax liabilities
|
|
15,831
|
|
34,457
|
|
|
|
|
|
|
|
|
|
Net deferred tax asset
(liability)
|
|
$
|
28,119
|
|
$
|
(20,865
|
)
|
On an annual basis, we review our deferred tax assets
based on open tax years, the status of refund claims filed and other factors.
As a result of our acquisitions of Colonial Homes and Greater Homes, we
recorded deferred tax liabilities of approximately $25.3 million in 2005 with a
corresponding increase to goodwill.
NOTE 11 –
SUPPLEMENTAL DISCLOSURE OF CASH FLOW INFORMATION
The 2005 acquisitions of
Greater Homes and Colonial Homes (East Region) and the 2004 acquisition of
Citation Homes (West Region) resulted in the following changes in assets and
liabilities (in thousands):
|
|
|
2005
|
|
2004
|
|
|
Increase in real estate
|
|
$
|
(140,538
|
)
|
$
|
(12,036
|
)
|
|
Increase in deposits on
real estate under option or contract
|
|
(5,170
|
)
|
(1,870
|
)
|
|
Increase in receivables
and other assets
|
|
(7,640
|
)
|
(747
|
)
|
|
Increase in goodwill
|
|
(37,802
|
)
|
(11,214
|
)
|
|
Increase in intangibles
|
|
(11,493
|
)
|
—
|
|
|
Increase in property
and equipment
|
|
(826
|
)
|
(89
|
)
|
|
Increase in accounts
payable and accrued liabilities
|
|
12,172
|
|
1,704
|
|
|
Increase in home sale
deposits
|
|
12,809
|
|
87
|
|
|
Increase in deferred
tax liability
|
|
26,063
|
|
—
|
|
|
Net cash paid for acquisitions
|
|
$
|
(152,425
|
)
|
$
|
(24,165
|
)
|
There were no acquisitions in 2006.
|
|
|
2006
|
|
2005
|
|
2004
|
|
|
Cash paid during the
year for:
|
|
|
|
|
|
|
|
|
Interest
|
|
$
|
48,802
|
|
$
|
35,820
|
|
$
|
36,728
|
|
|
Income taxes
|
|
$
|
216,818
|
|
$
|
125,026
|
|
$
|
70,916
|
|
|
|
|
|
|
|
|
|
|
|
Non-cash lot distributions from unconsolidated entities
|
|
$
|
8,946
|
|
$
|
33,007
|
|
$
|
16,291
|
|
56
NOTE 12 –
RELATED PARTY TRANSACTIONS
We have transacted business
with related or affiliated companies and with certain officers and directors of
the Company. We believe that the terms and fees negotiated for all transactions
listed below are no less favorable than those that could be negotiated in arm’s
length transactions.
Since 1997, we have leased office space in Plano,
Texas from Home Financial Services, a Texas partnership owned by John Landon,
our former co-chief executive officer, and his wife. During 2006, this lease
was renewed for a three-year period.
Rents paid to the partnership were approximately $225,836, $268,000 and
$255,000 in 2006, 2005 and 2004, respectively. The office rent is included
within general and administrative expenses on our consolidated statements of
earnings.
We
paid legal fees of approximately $1,643,000 and $783,000 to law firms in 2005
and 2004, respectively, of which C. Timothy White was a partner. Mr. White
served on our board of directors until October 1, 2005, at which time he joined
the Company as our General Counsel. Of these fees, approximately $1,136,000 and
$722,000 were real estate project related and capitalized to real estate on our
balance sheet in 2005 and 2004, respectively. The remaining amounts are
recorded within general and administrative expenses on our consolidated
statements of earnings.
During 2004, we contracted with a landbanker to acquire property in the
Tucson, Arizona area for $4.6 million. Robert Sarver, one of our directors, has
a 3.8% ownership interest in the entity that sold this property to the
landbanker. During 2006 and 2005, we had purchases totaling approximately $1.5
million and $1.2 million from the landbanker related to this property. In
addition, during 2006 and 2005, we made purchases of approximately $1.3 million
and $64,800 directly from the entity in which Mr. Sarver has the ownership
interest. We expect to complete the full acquisition of this property during
fiscal 2007.
During 2004 the Company
entered into an advertising/sponsorship agreement with the National Basketball
Association’s Phoenix Suns organization. One of our directors, Robert Sarver is
the Controlling Owner and Vice Chairman of the Phoenix Suns, and our CEO,
Steven Hilton, is a minority owner of the team. In 2006 and 2005 we paid
approximately $714,000 and $392,000 in advertising/sponsorship costs related to
the agreement. These amounts are recorded as general and administrative
expenses on our consolidated statement of earnings.
NOTE 13 –
OPERATING AND REPORTING SEGMENTS
As required by SFAS No. 131, “Disclosure About
Segments of an Enterprise and Related Information”, we have analyzed our
operating segments to determine if they may be further aggregated into
reporting segments. Our operating
segments that are aggregating into each reporting segment have been determined
to have similar economic characteristics such as: historical and projected
future operating results, employment trends, land acquisition and land
constraints, municipality behavior as well as meeting the other qualitative
aggregation criteria. The reportable
homebuilding segments are aggregated as follows:
|
|
|
West:
|
California and Nevada
|
|
|
|
Central:
|
Texas, Arizona and Colorado
|
|
|
|
East:
|
Florida
|
57
Management’s evaluation of segment performance is
based on segment operating income, which we define as homebuilding and land
revenues less cost of home construction, commissions and other sales costs,
land development and other land sales costs and other costs incurred by or
allocated to each segment. Each
reportable segment follows the same accounting policies described in Note 1, “Business
and Summary of Significant Accounting Policies.” Operating results for each segment may not be
indicative of the results for such segment had it been an independent,
stand-alone entity for the periods presented.
The following segment information is in thousands:
|
|
|
Year Ended December 31,
|
|
|
|
|
2006
|
|
2005
|
|
2004
|
|
|
Revenue (a):
|
|
|
|
|
|
|
|
|
West
|
|
$
|
1,076,401
|
|
$
|
1,149,135
|
|
$
|
769,085
|
|
|
Central
|
|
2,145,835
|
|
1,667,305
|
|
1,270,919
|
|
|
East
|
|
239,084
|
|
184,662
|
|
—
|
|
|
Consolidated
total
|
|
3,461,320
|
|
3,001,102
|
|
2,040,004
|
|
|
|
|
|
|
|
|
|
|
|
Operating income (loss)(b):
|
|
|
|
|
|
|
|
|
West
|
|
114,162
|
|
247,809
|
|
127,407
|
|
|
Central
|
|
290,530
|
|
203,642
|
|
115,045
|
|
|
East
|
|
(6,717
|
)
|
24,606
|
|
(100
|
)
|
|
Segment operating
income
|
|
397,975
|
|
476,057
|
|
242,352
|
|
|
Corporate and
unallocated costs (c)
|
|
(66,163
|
)
|
(54,160
|
)
|
(29,666
|
)
|
|
Earnings from
unconsolidated entities, net
|
|
20,364
|
|
18,337
|
|
2,788
|
|
|
Other income, net
|
|
11,833
|
|
7,468
|
|
9,284
|
|
|
Loss on extinguishment
of debt
|
|
—
|
|
(31,477
|
)
|
—
|
|
|
|
|
|
|
|
|
|
|
|
Earnings before
provision for income tax
|
|
$
|
364,009
|
|
$
|
416,225
|
|
$
|
224,758
|
|
|
|
|
At December 31,
|
|
|
|
|
2006
|
|
2005
|
|
|
Assets:
|
|
|
|
|
|
|
West
|
|
$
|
602,039
|
|
$
|
587,236
|
|
|
Central
|
|
1,183,533
|
|
1,003,839
|
|
|
East
|
|
168,010
|
|
207,692
|
|
|
Corporate and
unallocated (d)
|
|
216,943
|
|
172,590
|
|
|
Consolidated total
|
|
$
|
2,170,525
|
|
$
|
1,971,357
|
|
(a) Revenue includes the following land closing
revenue, by segment (in thousands): 2006 – $11,475 in West Region and $5,559 in
Central Region; 2005 - $4,156 in Central Region; 2004 - $20,185 in West Region
and $4,077 in Central Region.
(b) Balances include the following inventory
impairments and write-offs of options and pre-acquisition charges during 2006:
$36,876 in West Region, $13,681 in Central Region and $27,711 in East Region. There
were no such charges in 2005 or 2004.
(c) Balance consists primarily of corporate costs and
numerous shared service functions such as finance, legal and treasury that are
not allocated to the operating segments.
(d) Balance consists primarily of goodwill and
intangibles and other corporate assets not allocated to the segments.
See
additional segment discussions in Notes 4, 7, and 11 to these consolidated
financial statements.
NOTE 14 -
COMMITMENTS AND CONTINGENCIES
We are involved in
various routine legal proceedings incidental to our business, some of which are
covered by insurance. With respect to the majority of pending litigation
matters, our ultimate legal and financial responsibility, if any, cannot be
estimated with certainty and, in most cases, any potential losses related to
those matters are not considered probable. We have reserved approximately $2.4
million for losses related to litigation and asserted claims where our ultimate
exposure is considered probable and the potential loss can be reasonably
estimated, which is classified within accrued liabilities on our December 31,
2006 balance sheet. Most of the matters relate to the correction of home
construction defects, foundation issues and general customer claims. We believe
that none of these matters will have a material adverse impact upon our
consolidated financial condition, results of operations or cash flows.
58
From
time to time, the United States Environmental Protection Agency and Maricopa
County (Arizona) Air Quality Department have assessed fines against us for
violating dust control regulations. While we strive to maintain practices that
comply with such regulations, dust control violations are common to the
residential homebuilding industry in desert regions such as Arizona. We do not
believe that such fines will have a material adverse effect on our business,
financial position or results of operations.
In the normal course of business, we provide standby letters of credit
and performance bonds issued to third parties to secure performance under
various contracts. At December 31, 2006, we had outstanding letters of credit
of $102.6 million and performance bonds of $317.9 million. We do not believe it
is probable that these letters of credit or bonds will be drawn upon.
We
also enter into land acquisition and development joint ventures. We believe our participation in such joint
ventures provides us a means of accessing larger parcels and lot positions and
helps us expand our market opportunities and manage our risk profile. Our participation in joint ventures is an
important part of our business model and we expect to continue to use joint
ventures in the future. We and/or our
joint venture partners occasionally provide limited repayment guarantees on a
pro rata basis on debt of certain unconsolidated land acquisition and
development joint ventures. At December
31, 2006, we had limited repayment guarantees of $38.6 million.
In
addition, we and/or our joint venture partners occasionally provide guarantees
that are only applicable if and when the joint venture directly, or indirectly
through agreement with its joint venture partners or other third parties,
causes the joint venture to voluntarily file a bankruptcy or similar
liquidation or reorganization action (commonly referred to as “bad boy
guarantees”). These types of guarantees typically are on a pro rata basis and
are designed to protect the secured lender from the joint venture filing
voluntary bankruptcy to impede the lender’s remedies with respect to its mortgage
or other secured lien on the joint venture’s underlying property. To date, no
such guarantees have been invoked and we believe it is unlikely that such a
guarantee would be invoked in the future as it would generally require us to
voluntarily take actions that would generally be disadvantageous to the joint
venture and to us. At December 31, 2006, we had outstanding guarantees of this
type totaling approximately $82.3 million. By definition, guarantees of this
type, unless invoked as described above, are not considered guarantees or
indebtedness under our revolving credit facility or senior note indentures.
We lease office
facilities, model homes and equipment under various operating lease agreements.
Approximate future minimum lease payments for non-cancelable operating leases
as of December 31, 2006, are as follows (in thousands):
|
Years Ended December 31,
|
|
|
|
|
2007
|
|
$
|
18,462
|
|
|
2008
|
|
12,986
|
|
|
2009
|
|
10,102
|
|
|
2010
|
|
6,717
|
|
|
2011
|
|
3,367
|
|
|
Thereafter
|
|
6,456
|
|
|
|
|
$
|
58,090
|
|
Rent expense approximated $14.0 million, $11.7 million and $8.7 million
in 2006, 2005 and 2004, respectively, and is included within general and
administrative expense or in commissions and other sales costs on our
consolidated statements of earnings.
We have certain obligations related to post-construction warranties and
defects related to homes closed. We have estimated these reserves based on
historical data and trends with respect to similar product types and
geographical areas. A summary of changes in our warranty reserve follows (in
thousands):
|
|
|
Years Ended December 31,
|
|
|
|
|
2006
|
|
2005
|
|
|
|
|
|
|
|
|
|
Warranty reserve,
beginning of year
|
|
$
|
25,168
|
|
$
|
14,967
|
|
|
Additions to reserve
|
|
23,949
|
|
21,681
|
|
|
Warranty claims
|
|
(20,680
|
)
|
(11,480
|
)
|
|
Warranty reserve, end of year
|
|
$
|
28,437
|
|
$
|
25,168
|
|
59
Warranty reserves are
included in accrued liabilities within the accompanying consolidated balance
sheets. Additions to warranty reserves are included in cost of sales within the
accompanying consolidated statements of earnings.
NOTE 15 – OTHER EVENTS
On May 17, 2006, John R.
Landon, the Company’s Co-CEO, resigned.
In connection with Mr. Landon’s departure, both his employment and
change of control agreement terminated (other than certain provisions in the
Employment Agreement that survive termination).
Under the terms of the Employment Agreement, subject to his compliance
with certain restrictive covenants and other requirements therein, Mr. Landon
is entitled to a payment of $10,000,000, payable in equal monthly installments
over the course of 24 months, and acceleration of all outstanding stock options
that were granted to him after the effective date of the employment agreement,
which was July 1, 2003. During the
quarter ended June 30, 2006, the Company expensed approximately $10.0 million
related to the obligations owed to Mr. Landon pursuant to the terms of his
employment agreement and also recorded stock-based compensation expense of
approximately $2.3 million related to the accelerated vesting of certain of his
outstanding stock options. On June 12,
2006, the Company entered into a Stock Purchase Agreement with Mr. Landon,
pursuant to which the Company acquired 1,000,000 shares of the Company’s common
stock from Mr. Landon at a price of $52.19 per share, or an aggregate purchase
price of $52.2 million.
NOTE 16 -
SELECTED QUARTERLY FINANCIAL DATA (UNAUDITED)
Quarterly results for the years ended December 31, 2006 and 2005 follow
(in thousands, except per share amounts):
|
|
|
First
|
|
Second
|
|
Third
|
|
Fourth
|
|
|
2006
|
|
|
|
|
|
|
|
|
|
|
Revenue
|
|
$
|
847,271
|
|
$
|
914,660
|
|
$
|
878,196
|
|
$
|
821,193
|
|
|
Gross profit
|
|
$
|
214,041
|
|
$
|
220,618
|
|
$
|
178,008
|
|
$
|
99,963
|
|
|
Earnings before
provision for income taxes
|
|
$
|
130,791
|
|
$
|
125,150
|
|
$
|
94,447
|
|
$
|
13,621
|
|
|
Net earnings
|
|
$
|
79,736
|
|
$
|
77,055
|
|
$
|
59,539
|
|
$
|
9,024
|
|
|
Per Share Data:
|
|
|
|
|
|
|
|
|
|
|
Basic earnings
per share
|
|
$
|
2.96
|
|
$
|
2.90
|
|
$
|
2.28
|
|
$
|
0.35
|
|
|
Diluted earnings
per share
|
|
$
|
2.86
|
|
$
|
2.82
|
|
$
|
2.25
|
|
$
|
0.34
|
|
|
|
|
|
|
|
|
|
|
|
|
|
2005
|
|
|
|
|
|
|
|
|
|
|
Revenue
|
|
$
|
551,168
|
|
$
|
653,571
|
|
$
|
755,450
|
|
$
|
1,040,913
|
|
|
Gross profit
|
|
$
|
119,334
|
|
$
|
153,165
|
|
$
|
178,068
|
|
$
|
256,423
|
|
|
Earnings before
provision for income taxes
|
|
$
|
38,721
|
|
$
|
94,796
|
|
$
|
112,502
|
|
$
|
170,206
|
|
|
Net earnings
|
|
$
|
24,196
|
|
$
|
59,239
|
|
$
|
70,253
|
|
$
|
101,977
|
|
|
Per Share Data:
|
|
|
|
|
|
|
|
|
|
|
Basic earnings
per share
|
|
$
|
0.92
|
|
$
|
2.19
|
|
$
|
2.57
|
|
$
|
3.74
|
|
|
Diluted earnings per
share
|
|
$
|
0.86
|
|
$
|
2.05
|
|
$
|
2.40
|
|
$
|
3.53
|
|
We typically experience seasonal variability in our
quarterly oprating results and capital requirements. Historically, we sell more homes in the first
half of the year, which results in more working capital requirements and home
closings in the third and fourth quarters.
However, in 2006, due to the softening market conditions in many of our
markets, the fourth quarter had the lowest revenue and net income for the
fiscal year.
In accordance with SFAS No. 144 and as further
discussed in Note 1, in the fourth quarter of 2006 we recorded $15.6 million of
inventory impairments and an additional $47.1 million of option deposit and
pre-acquisition cost write-offs. These
charges reduced gross profit and net income by $62.7 million and $41.5 million,
respectively, during the fourth quarter of 2006. We had no such charges during 2005.
NOTE 17 –
SUBSEQUENT EVENT
On February 23, 2007, we completed the sale of an
aggregate principal amount of $150 million of 7.73% senior subordinated notes
due 2017 in a private placement. The notes were issued at par and
resulted in net proceeds to us of $147.2 million, after deduction of fees,
commmissions and expenses. We used the proceeds from the sale of these
senior subordinated notes to paydown our revolving credit facility.
60
Item 9. Changes in and Disagreements With
Accountants on Accounting and Financial Disclosure
None
Item 9A. Controls and Procedures
As of
the end of the period covered by this report, management, including our Chief
Executive Officer (“CEO”) and Chief Financial Officer (“CFO”), evaluated the
effectiveness of the design and operation of our disclosure controls and
procedures (as defined in Rules 13a-15(e) and 15d-15(e) under the
Securities Exchange Act of 1934, as amended). Based upon, and as of the date of
that evaluation, our CEO and CFO concluded that the disclosure controls and
procedures were effective, in all material respects, to ensure that information
required to be disclosed in the reports we file and submit under the Exchange
Act is recorded, processed, summarized and reported as and when required.
Further, our CEO and CFO concluded that our disclosure controls and procedures
were effective to ensure that information required to be disclosed in reports
filed by us under the Exchange Act as amended, is accumulated and communicated
to management, including the CEO and CFO, in a manner to allow timely decisions
regarding the required disclosure.
There
were no changes in our internal control over financial reporting (as defined in
Rules 13a-15(f) and 15d-15(f) under the Exchange Act) identified in connection
with the foregoing evaluation that occurred during our last fiscal quarter that
have materially affected, or are reasonably likely to materially affect, our
internal control over financial reporting.
Management’s Annual Report on Internal Control
over Financial Reporting
Our
management is responsible for establishing and maintaining adequate internal
control over financial reporting, as such term is defined in Exchange Act Rule
13a-15(f). Under the supervision and
with the participation of our management, including our Chief Executive Officer
and Chief Financial Officer, we conducted an evaluation of the effectiveness of
our internal control over financial reporting based on the framework in Internal Control — Integrated Framework issued by the
Committee of Sponsoring Organizations of the Treadway Commission. Based on our evaluation under the framework
in Internal Control – Integrated Framework,
our management concluded that our internal control over financial reporting was
effective as of December 31, 2006. Our
management’s assessment of the effectiveness of our internal control over
financial reporting as of December 31, 2006 has been audited by Deloitte &
Touche LLP, the independent registered public accounting firm that audited the
financial statements included in this report, as stated in their attestation
report, which is included herein.
61
REPORT OF INDEPENDENT REGISTERED PUBLIC ACCOUNTING
FIRM
To the
Board of Directors and Stockholders
Meritage Homes Corporation
We
have audited management’s assessment, included in the accompanying Management’s
Annual Report on Internal Control Over Financial Reporting, that Meritage Homes
Corporation and subsidiaries (the “Company”) maintained effective internal
control over financial reporting as of December 31, 2006, based on criteria
established in Internal Control—Integrated Framework issued by the Committee of
Sponsoring Organizations of the Treadway Commission. The Company’s management is responsible for
maintaining effective internal control over financial reporting and for its
assessment of the effectiveness of internal control over financial
reporting. Our responsibility is to
express an opinion on management’s assessment and an opinion on the
effectiveness of the Company’s internal control over financial reporting based
on our audit.
We
conducted our audit in accordance with the standards of the Public Company
Accounting Oversight Board (United States).
Those standards require that we plan and perform the audit to obtain
reasonable assurance about whether effective internal control over financial
reporting was maintained in all material respects. Our audit included obtaining an understanding
of internal control over financial reporting, evaluating management’s
assessment, testing and evaluating the design and operating effectiveness of
internal control, and performing such other procedures as we considered necessary
in the circumstances. We believe that
our audit provides a reasonable basis for our opinions.
A
company’s internal control over financial reporting is a process designed by,
or under the supervision of, the company’s principal executive and principal
financial officers, or persons performing similar functions, and effected by
the company’s board of directors, management, and other personnel to provide
reasonable assurance regarding the reliability of financial reporting and the
preparation of financial statements for external purposes in accordance with
generally accepted accounting principles.
A company’s internal control over financial reporting includes those
policies and procedures that (1) pertain to the maintenance of records that, in
reasonable detail, accurately and fairly reflect the transactions and
dispositions of the assets of the company; (2) provide reasonable assurance
that transactions are recorded as necessary to permit preparation of financial
statements in accordance with generally accepted accounting principles, and
that receipts and expenditures of the company are being made only in accordance
with authorizations of management and directors of the company; and (3) provide
reasonable assurance regarding prevention or timely detection of unauthorized
acquisition, use, or disposition of the company’s assets that could have a
material effect on the financial statements.
Because
of the inherent limitations of internal control over financial reporting,
including the possibility of collusion or improper management override of
controls, material misstatements due to error or fraud may not be prevented or
detected on a timely basis. Also,
projections of any evaluation of the effectiveness of the internal control over
financial reporting to future periods are subject to the risk that the controls
may become inadequate because of changes in conditions, or that the degree of
compliance with the policies or procedures may deteriorate.
In our
opinion, management’s assessment that the Company maintained effective internal
control over financial reporting as of December 31, 2006, is fairly stated, in
all material respects, based on the criteria established in Internal
Control—Integrated Framework issued by the Committee of Sponsoring
Organizations of the Treadway Commission.
Also in our opinion, the Company maintained, in all material respects,
effective internal control over financial reporting as of December 31, 2006,
based on the criteria established in Internal Control—Integrated Framework
issued by the Committee of Sponsoring Organizations of the Treadway Commission.
We
have also audited, in accordance with the standards of the Public Company
Accounting Oversight Board (United States), the consolidated financial
statements as of and for the year ended December 31, 2006 of the Company and
our report dated February 26, 2007 expressed an unqualified opinion on those
consolidated financial statements and included an explanatory paragraph
regarding the adoption of Financial Accounting Standard No. 123(R), Share-Based Payments, using
the modified prospective method.
/s/ DELOITTE & TOUCHE LLP
Phoenix,
Arizona
February 26, 2007
62
Item 9B. Other Information
None.
PART III
Item 10. Directors, Executive
Officers and Corporate Governance
Except as set forth herein, the information
required by this item regarding our directors and compliance with Section 16 of
the Exchange Act is incorporated by reference from the information contained in
our 2007 Proxy Statement (which will be filed with the Securities and Exchange
Commission no later than 120 days following the Company’s fiscal year end). The
information required by Item 10 regarding our executive officers appears under
Item 4 of Part I of this Annual Report as permitted by General Instruction
G(3).
The Company has adopted a code of ethics that
applies to all directors, officers and employees of the Company, including our
Chief Executive Officer, Chief Financial Officer and Chief Accounting Officer.
A copy of our Code of Ethics has been filed as an exhibit hereto and is also
available on our website at www.meritagehomes.com.
Item 11. Executive Compensation
Information required in response to this item
is incorporated by reference to our definitive proxy statement, which will be
filed with the SEC within 120 days following the Company’s fiscal year end.
Item 12. Security Ownership of
Certain Beneficial Owners and Management and Related Stockholder Matters
Information required in
response to this item is incorporated by reference from our definitive proxy
statement, which will be filed with the SEC within 120 days following the
Company’s fiscal year end.
Item 13. Certain Relationships
and Related Transactions, and Director Independence
Information required in response to this item
is incorporated by reference from our definitive proxy statement, which will be
filed with the SEC within 120 days following the Company’s fiscal year end.
Item 14. Principal Accountant
Fees and Services
Information required in response to this item
is incorporated by reference from our definitive proxy statement, which will be
filed with the SEC within 120 days following the Company’s fiscal year end.
Each year, the
audit committee approves the annual audit engagement in advance. The committee
has also established procedures to pre-approve all non-audit services provided
by the principal independent accountants. All 2006 and 2005 non-audit services
listed above were pre-approved.
63
PART IV
Item 15. Exhibits and Financial Statement
Schedules
(a) Financial Statements and Schedules
|
(i)
|
Financial Statements:
|
|
|
|
|
(1)
|
Report of Deloitte & Touche LLP
|
|
|
|
|
(3)
|
Consolidated Financial Statements and Notes to
Consolidated Financial Statements of the Company, including Consolidated
Balance Sheets as of December 31, 2006 and 2005 and related Consolidated
Statements of Earnings, Stockholders’ Equity and Cash Flows for each of the
years in the three-year period ended December 31, 2006
|
|
|
|
|
|
|
|
|
|
(ii)
|
Financial Statement Schedules:
|
|
|
|
|
|
Schedules have been omitted because of the absence
of conditions under which they are required or because the required
information is included in the Consolidated Financial Statements or Notes
thereto.
|
|
|
(b) Exhibits
|
Exhibit
Number
|
|
Description
|
|
Page or Method of Filing
|
|
2.1
|
|
Agreement and Plan of Reorganization, dated as of
September 13, 1996, by and among Homeplex, the Monterey Merging Companies and
the Monterey Stockholders
|
|
Incorporated by reference to Appendix A of Form S-4
Registration Statement No. 333-15937.
|
|
|
|
|
|
|
|
3.1
|
|
Restated Articles of Incorporation of Meritage Homes
Corporation
|
|
Incorporated by reference to Exhibit 3 of Form 8-K
dated June 20, 2002.
|
|
|
|
|
|
|
|
3.1.1
|
|
Amendment to Articles of Incorporation of Meritage
Homes Corporation
|
|
Incorporated by reference to Exhibit 3.1 of Form 8-K
dated September 15, 2004.
|
|
|
|
|
|
|
|
3.2
|
|
Amended and Restated Bylaws of Meritage Homes
Corporation
|
|
Incorporated by reference to Exhibit 3.3 of Form S-3
Registration Statement No. 333-58793.
|
|
|
|
|
|
|
|
4.1
|
|
Form of Specimen of Common Stock Certificate
|
|
Incorporated by reference to Exhibit 4.2 of Form S-3
Registration Statement No. 333-87398.
|
|
|
|
|
|
|
|
4.2
|
|
Indenture, dated May 30, 2001 (re 9¾% Senior Notes
due 2011)
|
|
Incorporated by reference to Exhibit 4.1 of Form 8-K
dated June 6, 2001.
|
|
|
|
|
|
|
|
4.2.1
|
|
First Supplemental Indenture, dated September 20,
2001 (re 9¾% Senior Notes due 2011)
|
|
Incorporated by reference to Exhibit 4.3.1 of
Form 10-K for the year ended December 31, 2002.
|
|
|
|
|
|
|
|
4.2.2
|
|
Second Supplemental Indenture, dated July 12, 2002
(re 9¾% Senior Notes due 2011)
|
|
Incorporated by reference to Exhibit 4.3.2 of
Form 10-K for the year ended December 31, 2002.
|
|
|
|
|
|
|
|
4.2.3
|
|
Third Supplemental Indenture, dated October 21, 2002
(re 9¾% Senior Notes due 2011)
|
|
Incorporated by reference to Exhibit 4.3.3 of
Form 10-K for the year ended December 31, 2002.
|
|
|
|
|
|
|
|
4.2.4
|
|
Fourth Supplemental Indenture, dated February 19,
2003 (re 9¾% Senior Notes due 2011)
|
|
Incorporated by reference to Exhibit 4.3.4 of
Form 10-K for the year ended December 31, 2002.
|
|
|
|
|
|
|
|
4.2.5
|
|
Fifth Supplemental Indenture, dated August 22, 2003
(re 9¾% Senior Notes due 2011)
|
|
Incorporated by reference to Exhibit 4.2.5 of
Form S-4 Registration Statement No. 333-109933.
|
64
|
4.2.6
|
|
Sixth Supplemental Indenture, dated May 14, 2004 (re
9¾% Senior Notes due 2011)
|
|
Incorporated by reference to Exhibit 4.2.6 of Form
S-4 Registration Statement 333-115610.
|
|
|
|
|
|
|
|
4.2.7
|
|
Seventh Supplemental Indenture, dated December 20,
2004 (re 9¾% Senior Notes due 2011)
|
|
Incorporated by reference to Exhibit 4.2.7 of
Form 10-K for the year ended December 31, 2004.
|
|
|
|
|
|
|
|
4.2.8
|
|
Eighth Supplemental Indenture, dated March 10, 2005
(re 9¾% Senior Notes due 2011)
|
|
Incorporated by reference to Exhibit 4.2.8 of
Form 10-K for the year ended December 31, 2004.
|
|
|
|
|
|
|
|
4.3
|
|
Indenture, dated April 21, 2004 (re 7% Senior Notes
due 2014)
|
|
Incorporated by reference to Exhibit 4.1 of
Form 10-Q for the quarterly period ended March 31, 2004.
|
|
|
|
|
|
|
|
4.3.1
|
|
First Supplemental Indenture, dated May 14, 2004 (re
7% Senior Notes due 2014)
|
|
Incorporated by reference to Exhibit 4.3.1 of Form
S-4 Registration Statement No. 333-115610.
|
|
|
|
|
|
|
|
4.3.2
|
|
Second Supplemental Indenture, dated December 20,
2004 (re 7% Senior Notes due 2014)
|
|
Incorporated by reference to Exhibit 4.3.2 of
Form 10-K for the year ended December 31, 2004.
|
|
|
|
|
|
|
|
4.3.3
|
|
Third Supplemental Indenture, dated April 18, 2005
(re 7% Senior Notes due 2014)
|
|
Incorporated by reference to Exhibit 4.3.3 of Form
S-4 Registration Statement No. 333-123661.
|
|
|
|
|
|
|
|
4.3.4
|
|
Fourth Supplemental Indenture, dated September 22,
2005 (re 7% Senior Notes due 2014)
|
|
Incorporated by reference to Exhibit 4.1 of Form
10-Q for the quarterly period ended September 30, 2005.
|
|
|
|
|
|
|
|
4.4
|
|
Indenture dated March 10, 2005 (re 6¼% Senior Notes
due 2015) and form of 6¼% Senior Notes due 2015
|
|
Incorporated by reference to Exhibit 4.4 of Form
10-K for the year ended December 31, 2004.
|
|
|
|
|
|
|
|
4.4.1
|
|
First Supplemental Indenture, dated April 18, 2005
(re 6¼% Senior Notes due 2015)
|
|
Incorporated by reference to Exhibit 4.1.1 of Form
S-4 Registration Statement No. 333-123661.
|
|
|
|
|
|
|
|
4.4.2
|
|
Second Supplemental Indenture, dated September 22,
2005 (re 6¼% Senior Notes due 2015)
|
|
Incorporated by reference to Exhibit 4.2 of Form
10-Q for the quarterly period ended September 30, 2005.
|
|
|
|
|
|
|
|
10.1
|
|
Master Transaction Agreement, dated February 9,
2005, by and among the Company, Meritage Homes of Florida, Inc., Colonial
Homes, Inc., Colonial Shores, LLC and The Colonial Company **
|
|
Incorporated by reference to Exhibit 10.1 of
Form 8-K/A dated February 9, 2005.
|
|
|
|
|
|
|
|
10.2
|
|
Stock Purchase Agreement, dated August 24, 2005, by
and among Meritage Homes of Florida, Inc. and the stockholders of Greater
Homes, Inc. **
|
|
Incorporated by reference to Exhibit 10.3 of
Form 10-Q for the quarterly period ended September 30, 2005.
|
|
|
|
|
|
|
|
10.2.1
|
|
First Amendment to Stock Purchase Agreement dated
September 1, 2005, by and among Meritage Homes of Florida, Inc. and the
stockholders of Greater Homes, Inc.
|
|
Incorporated by reference to Exhibit 10.4 of
Form 10-Q for the quarterly period ended September 30, 2005.
|
|
|
|
|
|
|
|
10.3
|
|
Credit Agreement, dated May 16, 2006
|
|
Incorporated by reference to Exhibit 10.1 of Form
8-K dated May 16, 2006.
|
|
|
|
|
|
|
|
10.3.1
|
|
First Amendment and Commitment Increase Agreement,
dated June 30, 2006
|
|
Incorporated by reference to Exhibit 10.1 of Form
8-K dated June 30, 2006.
|
65
|
10.4
|
|
2001 Annual Incentive Plan*
|
|
Incorporated by reference to Exhibit B of the Proxy
Statement for the 2001 Annual Meeting of Stockholders.
|
|
|
|
|
|
|
|
10.5
|
|
2006 Annual Incentive Plan*
|
|
Incorporated by reference to Exhibit C of the Proxy
Statement for the 2006 Annual Meeting of Stockholders
|
|
|
|
|
|
|
|
10.6
|
|
Amended 1997 Meritage Stock Option Plan *
|
|
Incorporated by reference to Exhibit 10.3 of
Form 10-K for the year ended December 31, 2004.
|
|
|
|
|
|
|
|
10.6.1
|
|
Representative Form of Meritage Qualified Stock
Option Agreement (1997 Plan) *
|
|
Incorporated by reference to Exhibit 10.2 of
Form 10-Q for the quarter ended September 30, 2004.
|
|
|
|
|
|
|
|
10.6.2
|
|
Representative Form of Meritage Non-Qualified Stock
Option Agreement (1997 Plan) *
|
|
Incorporated by reference to Exhibit 10.3 of
Form 10-Q for the quarter ended September 30, 2004.
|
|
|
|
|
|
|
|
10.7
|
|
Meritage Homes Corporation 2006 Stock Incentive
Plan*
|
|
Incorporated by reference to Exhibit 4.1 of Form S-8
Registration Statement No. 333-134637
|
|
|
|
|
|
|
|
10.7.1
|
|
Amendment to Meritage Homes Corporation 2006 Stock
Incentive Plan*
|
|
Incorporated by reference to Exhibit 10.1 of
Form 10-Q for the quarter ended September 30, 2006
|
|
|
|
|
|
|
|
10.7.2
|
|
Representative Form of Restricted Stock Agreement
(2006 Plan)*
|
|
Incorporated by reference to Exhibit 4.2 of Form S-8
Registration Statement No. 333-134637
|
|
|
|
|
|
|
|
10.7.3
|
|
Representative Form of Non-Qualified Stock Option
Agreement (2006 Plan)*
|
|
Incorporated by reference to Exhibit 4.3 of Form S-8
Registration Statement No. 333-134637
|
|
|
|
|
|
|
|
10.7.4
|
|
Representative Form of Incentive Stock Option
Agreement (2006 Plan)*
|
|
Incorporated by reference to Exhibit 4.4 of Form S-8
Registration Statement No. 333-134637
|
|
|
|
|
|
|
|
10.7.5
|
|
Representative Form of Stock Appreciation Rights
Agreement (2006 Plan)*
|
|
Incorporated by reference to Exhibit 4.5 of Form S-8
Registration Statement No. 333-134637
|
|
|
|
|
|
|
|
10.8
|
|
Representative Form of Employment Agreement between
the Company and John R. Landon *
|
|
Incorporated by reference to Exhibit 10.1 of Form
8-K dated July 8, 2003.
|
|
|
|
|
|
|
|
10.8.1
|
|
Stock Purchase Agreement between the Company and
John R. Landon, dated June 12, 2006*
|
|
Incorporated by reference to Exhibit 10.1 of Form
8-K dated June 12, 2006
|
|
|
|
|
|
|
|
10.8.2
|
|
Settlement Agreement between the Company and John R.
Landon, dated June 12, 2006*
|
|
Incorporated by reference to Exhibit 10.2 of Form
8-K dated June 12, 2006
|
|
|
|
|
|
|
|
10.8.3
|
|
Cooperation Agreement between the Company and John
R. Landon, dated June 12, 2006*
|
|
Incorporated by reference to Exhibit 10.3 of Form
8-K dated June 12, 2006
|
|
|
|
|
|
|
|
10.9
|
|
Second Amended and Restated Employment Agreement
between the Company and Steven J. Hilton*
|
|
Incorporated by reference to Exhibit 10.1 of Form
8-K dated January 10, 2007
|
|
|
|
|
|
|
|
10.9.1
|
|
Second Amended and Restated Change of Control
Agreement between the Company and Steven J. Hilton*
|
|
Incorporated by reference to Exhibit 10.3 of Form
8-K dated January 10, 2007
|
|
|
|
|
|
|
|
10.10
|
|
Second Amended and Restated Employment Agreement
between Larry W. Seay*
|
|
Incorporated by reference to Exhibit 10.2 of Form
8-K dated January 10, 2007
|
66
|
10.10.1
|
|
Second Amended and Restated Change of Control
Agreement between the Company and Larry W. Seay*
|
|
Incorporated by reference to Exhibit 10.4 of Form
8-K dated January 10, 2007
|
|
|
|
|
|
|
|
10.11
|
|
Employment Agreement between the Company and Sandra
R.A. Karrmann*
|
|
Incorporated by reference to Exhibit 10.1 of Form
8-K dated September 26, 2006
|
|
|
|
|
|
|
|
10.11.1
|
|
Change of Control Agreement between the Company and
Sandra R.A. Karrmann*
|
|
Incorporated by reference to Exhibit 10.2 of Form
8-K dated September 26, 2006
|
|
|
|
|
|
|
|
10.12
|
|
Employment Agreement between the Company and Steven
Davis*
|
|
Incorporated by reference to Exhibit 10.1 of Form
8-K dated October 16, 2006
|
|
|
|
|
|
|
|
10.12.1
|
|
Change of Control Agreement between the Company and
Steven Davis*
|
|
Incorporated by reference to Exhibit 10.2 of Form
8-K dated October 16, 2006
|
|
|
|
|
|
|
|
10.13
|
|
Employment Agreement between the Company and C.
Timothy White *
|
|
Incorporated by reference to Exhibit 10.1 of
Form 10-Q for the quarterly period ended September 30, 2005.
|
|
|
|
|
|
|
|
10.13.1
|
|
Change of Control Agreement between the Company and
C. Timothy White *
|
|
Incorporated by reference to Exhibit 10.2 of
Form 10-Q for the quarterly period ended September 30, 2005.
|
|
|
|
|
|
|
|
10.14
|
|
Deferred Bonus Agreement – 2003 Award Year – between
the Company and Larry W. Seay *
|
|
Incorporated by reference to Exhibit 10.2 of
Form 10-Q for the quarterly period dated March 31, 2004.
|
|
|
|
|
|
|
|
10.15
|
|
Deferred Bonus Agreement – 2004 Award Year – between
the Company and Larry W. Seay *
|
|
Incorporated by reference to Exhibit 10.3 of
Form 10-Q for the quarterly period ended March 31, 2005.
|
|
|
|
|
|
|
|
14
|
|
Code of Ethics
|
|
Incorporated by reference to Exhibit 14 of Form 10-K
for the year ended December 31, 2005
|
|
|
|
|
|
|
|
21
|
|
List of Subsidiaries
|
|
Filed herewith.
|
|
|
|
|
|
|
|
23.1
|
|
Consent of Deloitte & Touche LLP
|
|
Filed herewith.
|
|
|
|
|
|
|
|
24
|
|
Powers of Attorney
|
|
See Signature Page.
|
|
|
|
|
|
|
|
31.1
|
|
Rule 13a-14(a)/15d-14(a) Certificate of Steven J.
Hilton, Chief Executive Officer
|
|
Filed herewith.
|
|
|
|
|
|
|
|
31.2
|
|
Rule 13a-14(a)/15d-14(a) Certificate of Larry W. Seay,
Chief Financial Officer
|
|
Filed herewith.
|
|
|
|
|
|
|
|
32.1
|
|
Section 1350 Certification of Chief Executive
Officer and Chief Financial Officer
|
|
Filed herewith.
|
* Indicates a
management contract or compensation plan.
** Certain
Confidential Information in this Exhibit was omitted by means of redacting a
portion of the text and replacing it with an asterisk. This Exhibit has been
filed separately with the Secretary of the Securities and Exchange Commission
without the redaction pursuant to Confidential Treatment Request under Rule
24b-2 of the Securities Exchange Act of 1934.
67
SIGNATURES
Pursuant to the requirements of Section 13 or 15(d) of
the Securities Exchange Act of 1934, the registrant has duly caused this report
on Form 10-K to be signed on its behalf by the undersigned, thereunto duly
authorized, this 22nd day of February 2007.
|
|
|
MERITAGE HOMES CORPORATION,
|
|
|
|
a Maryland Corporation
|
|
|
|
|
|
|
|
By
|
/s/ STEVEN
J. HILTON
|
|
|
|
Steven J. Hilton
|
|
|
|
|
Chairman and Chief Executive Officer
|
|
|
|
|
|
|
|
By
|
/s/ LARRY
W. SEAY
|
|
|
|
Larry W. Seay
|
|
|
|
|
Executive Vice President and Chief Financial
Officer
|
|
|
|
|
|
68
KNOW ALL MEN BY THESE PRESENTS,
that each person whose signature appears below constitutes and appoints Steve
J. Hilton and Larry W. Seay, and each of them, his or her true and lawful
attorneys-in-fact and agents, with full power of substitution and
resubstitution, for him or her and in his or her name, place and stead, in any
and all capacities, to sign any and all amendments to this Form 10-K Annual
Report, and to file the same, with all exhibits thereto and other documents in
connection therewith the Securities and Exchange Commission, granting unto said
attorneys-in-fact and agents, and each of them, full power and authority to do
and perform each and every act and thing requisite and necessary to be done in
and about the premises, as fully and to all intents and purposes as he might or
could do in person hereby ratifying and confirming all that said
attorneys-in-fact and agents, or his or her substitute or substitutes, may
lawfully do or cause to be done by virtue hereof.
Pursuant to these requirements of the Securites
Exhange Act of 1934, the following persons on behalf of the registrant and in
the capacities and on the dates indicated have signed this report on Form 10-K
below:
|
Signature
|
|
Title
|
|
Date
|
|
|
|
|
|
|
|
/s/
|
STEVEN J. HILTON
|
|
Chairman and
|
|
February 22, 2007
|
|
Steven J. Hilton
|
|
Chief Executive Officer
|
|
|
|
|
|
|
|
|
|
/s/
|
LARRY W. SEAY
|
|
Chief Financial Officer
|
|
February 22, 2007
|
|
Larry W. Seay
|
|
Executive Vice President
|
|
|
|
|
|
(Principal Financial Officer)
|
|
|
|
|
|
|
|
|
|
/s/
|
VICKI L. BIGGS
|
|
Controller and
|
|
February 22, 2007
|
|
Vicki L. Biggs
|
|
Chief Accounting Officer
|
|
|
|
|
|
(Principal Accounting Officer)
|
|
|
|
|
|
|
|
|
|
/s/
|
PETER L. AX
|
|
Director
|
|
February 22, 2007
|
|
Peter L. Ax
|
|
|
|
|
|
|
|
|
|
|
|
/s/
|
RAYMOND OPPEL
|
|
Director
|
|
February 22, 2007
|
|
Raymond Oppel
|
|
|
|
|
|
|
|
|
|
|
|
/s/
|
ROBERT G. SARVER
|
|
Director
|
|
February 22, 2007
|
|
Robert G. Sarver
|
|
|
|
|
|
|
|
|
|
|
|
/s/
|
RICHARD T. BURKE, SR.
|
|
Director
|
|
February 22, 2007
|
|
Richard T.
Burke, Sr.
|
|
|
|
|
|
|
|
|
|
|
|
/s/
|
GERALD W. HADDOCK
|
|
Director
|
|
February 22, 2007
|
|
Gerald W.
Haddock
|
|
|
|
|
|
|
|
|
|
|
|
|
|
|
|