
SECURITIES AND EXCHANGE COMMISSION
Washington, D.C. 20549
FORM 10-K
| x | ANNUAL REPORT PURSUANT TO SECTION 13 OR 15(d) OF THE SECURITIES EXCHANGE ACT OF 1934 |
For the fiscal year ended December 31, 2011
OR
| ¨ | TRANSITION REPORT PURSUANT TO SECTION 13 OR 15(d) OF THE SECURITIES EXCHANGE ACT OF 1934 |
For the transition period from to
Commission File Number 1-9977
(Exact Name of Registrant as Specified in its Charter)
| Maryland | 86-0611231 | |
| (State or Other Jurisdiction of Incorporation or Organization) |
(IRS Employer Identification No.) | |
| 17851 North 85th Street, Suite 300, Scottsdale, Arizona |
85255 | |
| (Address of Principal Executive Offices) | (Zip Code) | |
(480) 515-8100
(Registrant’s telephone number, including area code)
Securities registered pursuant to Section 12(b) of the Act:
| Title of Each Class |
Name of Each Exchange on which Registered | |
| Common Stock, $.01 par value | New York Stock Exchange |
Securities registered pursuant to Section 12(g) of the Act: None
Indicate by check mark if the registrant is a well-known seasoned issuer, as defined in Rule 405 of the Securities Act. Yes ¨ No x
Indicate by check mark if the registrant is not required to file reports pursuant to Section 13 or Section 15(d) of the Act. Yes ¨ No x
Indicate by check mark whether the registrant (1) has filed all reports required to be filed by Section 13 or 15(d) of the Securities Exchange Act of 1934 during the preceding 12 months (or for such shorter period that the registrant was required to file such reports), and (2) has been subject to such filing requirements for the past 90 days. Yes x No ¨
Indicate by check mark whether the registrant has submitted electronically and posted on its corporate Web site, if any, every Interactive Data File required to be submitted and posted pursuant to Rule 405 of Regulation S-T (§ 232.405 of this chapter) during the preceding 12 months (or for such shorter period that the registrant was required to submit and post such files). Yes x No ¨
Indicate by check mark if disclosure of delinquent filers pursuant to Item 405 of Regulation S-K is not contained herein, and will not be contained, to the best of registrant’s knowledge, in definitive proxy or information statements incorporated by reference in Part III of this Form 10-K or any amendment to this Form 10-K. ¨
Indicate by check mark whether the registrant is a large accelerated filer, an accelerated filer, a non-accelerated filer, or a smaller reporting company. See the definitions of “large accelerated filer”, “accelerated filer” and “smaller reporting company” in Rule 12b-2 of the Exchange Act. (Check one):
| Large accelerated filer | ¨ | Accelerated Filer | x | |||
| Non-accelerated filer | ¨ (Do not check if a smaller reporting company) | Smaller reporting company | ¨ | |||
Indicate by checkmark whether the registrant is a shell company (as defined in Rule 12b-2 of the Exchange Act). Yes ¨ No x
The aggregate market value of common stock held by non-affiliates of the registrant (28,260,178 shares) as of June 30, 2011, was $637,549,616, based on the closing sales price per share as reported by the New York Stock Exchange on such date.
The number of shares outstanding of the registrant’s common stock on February 23, 2012 was 32,725,971 .
DOCUMENTS INCORPORATED BY REFERENCE
Portions from the registrant’s Proxy Statement relating to the 2012 Annual Meeting of Stockholders have been incorporated by reference into Part III, Items 10, 11, 12, 13 and 14.
MERITAGE HOMES CORPORATION
FORM 10-K
2
The Company
Meritage Homes is a leading designer and builder of single-family attached and detached homes based on the number of home closings. We build in the historically high-growth regions of the western and southern United States and offer a variety of homes that are designed to appeal to a wide range of homebuyers, including first-time, move-up, active adult and luxury. We have operations in three regions: West, Central and East, which are comprised of seven states: Arizona, California, Nevada, Texas, Colorado, Florida, and North Carolina. These three regions are our principal business segments. In 2011, we announced our expansion into Raleigh, North Carolina and within Florida into the Tampa market as well as the wind-down of our operations in Nevada. Please refer to Note 11 of the consolidated financial statements for information regarding our operating and reporting segments.
Our homebuilding and marketing activities are conducted primarily under the Meritage Homes brand, except for Arizona and Texas where we also operate under the name Monterey Homes. At December 31, 2011, we were actively selling homes in 157 communities, with base prices ranging from approximately $103,000 to $673,000.
Available Information; Corporate Governance
Meritage Homes Corporation was incorporated in 1988 as a real estate investment trust in the State of Maryland. On December 31, 1996, through a merger, we acquired the homebuilding operations of our predecessor company. We currently focus exclusively on homebuilding and related activities and no longer operate as a real estate investment trust.
Information about our company and communities is provided on our Internet website at www.meritagehomes.com. The information contained on our website is not considered part of this Annual Report on Form 10-K. Our periodic and current reports, including any amendments, filed or furnished pursuant to section 13(a) or 15(d) of the Securities Exchange Act of 1934 (the “Exchange Act”) are available, free of charge, on our website as soon as reasonably practicable after they are electronically filed with or furnished to the Securities and Exchange Commission (“SEC”).
Meritage operates within a comprehensive plan of corporate governance for the purpose of defining responsibilities and setting high standards for ethical conduct. Our Board of Directors has established an audit committee, executive compensation committee and nominating/governance committee. The charters for each of these committees are available on our website, along with our Code of Ethics and our Corporate Governance Principles and Practices. Our committee charters, Code of Ethics and Corporate Governance Principles and Practices are also available in print, free of charge, to any stockholder who requests any of them by calling us or by writing to us at our principal executive offices at the following address: Meritage Homes Corporation, 17851 North 85th Street, Suite 300, Scottsdale, Arizona 85255, Attention: General Counsel. Our telephone number is (480) 515-8100.
Strategy
All facets of Meritage Homes’ operations are governed by the principles of our strategic model, Meritage Forward. Meritage Forward defines our culture and operational parameters, ensuring that our actions are aligned around the achievement of our goals. It combines our entrepreneurial spirit, cutting-edge innovation and organizational agility to strive for industry-leading results in all of our functional areas, including: management, land acquisition and development, finance, marketing, sales, purchasing, construction and customer care. The main tenets of Meritage Forward are to:
| • | Maximize our state-of-the-art market research tools to make informed decisions about land purchases; |
| • | Utilize our knowledge of customer preferences to align our product offerings with the knowledge of our buyers’ demands through regular surveys and research; |
| • | Customize our sales techniques for today’s buyers and educate our sales team about the benefits of our Meritage Green offerings and other features of our homes and on the availability of mortgage products; |
| • | Continuously improve our construction process by working with our vendors to find mutual efficiencies in order to construct high-quality homes at the lowest possible cost; |
| • | Re-engineer and constantly evaluate our pricing, product and community amenity offerings to better appeal to our buyers, while incorporating our Meritage Green concepts and technologies into routine construction practices; |
| • | Shorten sales to close cycle time by refining our processes and streamlining scheduling and production; |
3
| • | Provide the highest level of customer service and care by working closely with our buyers throughout the sales and construction process and monitoring their satisfaction routinely after delivery of their homes; and |
| • | Ensure that we have the best team available by hiring and nurturing top talent, expecting top level performance and allocating proper resources to drive execution of our business plan. |
All of these directives are focused on our key priority of returning to and sustaining our profitability as the economy stabilizes and recovers.
In connection with our Meritage Forward strategy, we have continued to focus on several initiatives implemented over the last several years. Our Simply Smart Series ™ is a collection of homes that are specifically designed to appeal to the renter and first-time buyer demographic and are marketed on the basis of low monthly payments, which compare favorably to rent payments. We believe these homes compete favorably in our submarkets where low prices are the key determinant of sales activity. The Simply Smart Series™ offers a base level of standard features while allowing buyers to customize their purchase with a reasonable range of options and upgrades. While we believe these entry level buyers are an important demographic, in recent quarters, we have begun to shift our business back to the move-up market, which has historically comprised our core customer base and is beginning to recover.
To address the influx of available existing home inventory, we offer our “Your Home. Your Way. 99 Days Guaranteed” promise in many of our communities. This program provides our buyers with all the benefits of new home construction, including customization and a warranty, and delivery in 99 days or less from the date the buyer signs the sales contract to the close of their new home. This allows us to effectively compete with the typical closing cycle for resale and foreclosure homes. The expedited timeline works in concert with our streamlined processes driven by Meritage Forward, while maintaining Meritage quality standards.
We continue to innovate building techniques and technologies within Meritage Green, our energy-efficiency program, where every new home we construct, at a minimum, meets 2011 ENERGY STAR® standards. Our commitment to incorporate these energy standards into all of our homes has resulted in our achievement of design, purchasing and production efficiencies that have allowed us to offer these standard features to our home buyers for nominal additional cost. Since mid 2010, we have also opened several extreme “green” communities that have homes with standard solar features that can save up to 80% on a homeowner’s utility bills. Through our “green” strategy, we continue to lead the industry by incorporating advanced building technologies to build better homes that effectively differentiates our product in the marketplace when compared against both new and resale homes, providing us with a competitive advantage as well as allowing us to be a responsible steward of the environment. Through our green program, the building practices we utilize result in our homeowners’ utility usage on average being less than half of the current national average of US households. We were the first production builder to offer net-zero homes, where the homes produce as much energy as they use annually. Our ongoing commitment to green is widely recognized, and in 2011, we were again commended for our leadership in advanced green building, including the 2011 Energy Value Housing Award from the National Association of Homebuilders for our Lyon’s Gate community located in Gilbert, Arizona, the 2011 ENERGY STAR® Builder Partner of the Year Award, the 2011 Best Green Building Program Award, and the 2011 People’s Choice Award, recognizing Meritage for voluntarily incorporating energy efficiency in the design, construction and marketing of our homes.
We believe our Meritage Forward strategy and our Meritage Green commitment provides us with unique competitive advantages and will drive our success in attaining our key objectives of maintaining and growing our profitability.
Markets and Products
We currently build and sell homes in the following markets:
| Markets |
Year Entered | |||
| Phoenix, AZ |
1985 | |||
| Dallas/Ft. Worth, TX |
1987 | |||
| Austin, TX |
1994 | |||
| Tucson, AZ |
1995 | |||
| Houston, TX |
1997 | |||
| East Bay/Central Valley, CA |
1998 | |||
| Sacramento, CA |
1998 | |||
| Las Vegas, NV |
2002 | |||
| San Antonio, TX |
2003 | |||
| Inland Empire, CA |
2004 | |||
| Denver, CO |
2004 | |||
| Orlando, FL |
2004 | |||
| Raleigh, NC |
2011 | |||
4
Our homes range from entry level to luxury. A summary of activity by region as of and for the years ended December 31, 2011 and 2010 follows (dollars in thousands):
| Year Ended December 31, 2011 | At December 31, 2011 | |||||||||||||||||||||||
| # of Homes Closed |
Average Closing Price |
# Homes in Backlog |
$ Value of Backlog |
# Home Sites Controlled (1) |
# of Actively Selling Communities |
|||||||||||||||||||
| West Region |
||||||||||||||||||||||||
| California |
355 | $ | 338.9 | 82 | $ | 27,648 | 1,527 | 20 | ||||||||||||||||
| Nevada |
59 | $ | 213.4 | 5 | 1,076 | 425 | 2 | |||||||||||||||||
|
|
|
|
|
|
|
|
|
|
|
|||||||||||||||
| West Region Total |
414 | $ | 321.0 | 87 | 28,724 | 1,952 | 22 | |||||||||||||||||
|
|
|
|
|
|
|
|
|
|
|
|||||||||||||||
| Central Region |
||||||||||||||||||||||||
| Arizona |
594 | $ | 253.0 | 158 | 45,232 | 6,790 | 37 | |||||||||||||||||
| Texas |
1,660 | $ | 238.1 | 396 | 93,494 | 5,825 | 67 | |||||||||||||||||
| Colorado |
258 | $ | 322.1 | 70 | 23,493 | 607 | 10 | |||||||||||||||||
|
|
|
|
|
|
|
|
|
|
|
|||||||||||||||
| Central Region Total |
2,512 | $ | 250.3 | 624 | 162,219 | 13,222 | 114 | |||||||||||||||||
|
|
|
|
|
|
|
|
|
|
|
|||||||||||||||
| East Region |
||||||||||||||||||||||||
| North Carolina |
N/A | $ | N/A | 24 | 8,616 | 241 | 3 | |||||||||||||||||
| Florida |
342 | $ | 290.5 | 180 | 49,295 | 1,307 | 18 | |||||||||||||||||
|
|
|
|
|
|
|
|
|
|
|
|||||||||||||||
| East Region Total |
342 | $ | 290.5 | 204 | 57,911 | 1,548 | 21 | |||||||||||||||||
|
|
|
|
|
|
|
|
|
|
|
|||||||||||||||
| Total Company |
3,268 | $ | 263.4 | 915 | $ | 248,854 | 16,722 | 157 | ||||||||||||||||
|
|
|
|
|
|
|
|
|
|
|
|||||||||||||||
| Year Ended December 31, 2010 | At December 31, 2010 | |||||||||||||||||||||||
| # of Homes Closed |
Average Closing Price |
# Homes in Backlog |
$ Value of Backlog |
# Home Sites Controlled (1) |
# of Actively Selling Communities |
|||||||||||||||||||
| West Region |
||||||||||||||||||||||||
| California |
417 | $ | 353.0 | 45 | $ | 15,295 | 1,696 | 14 | ||||||||||||||||
| Nevada |
81 | $ | 197.6 | 12 | 2,369 | 488 | 4 | |||||||||||||||||
|
|
|
|
|
|
|
|
|
|
|
|||||||||||||||
| West Region Total |
498 | $ | 327.7 | 57 | 17,664 | 2,184 | 18 | |||||||||||||||||
|
|
|
|
|
|
|
|
|
|
|
|||||||||||||||
| Central Region |
||||||||||||||||||||||||
| Arizona |
700 | $ | 223.0 | 125 | 31,980 | 6,686 | 32 | |||||||||||||||||
| Texas |
2,028 | $ | 240.5 | 463 | 111,607 | 4,759 | 82 | |||||||||||||||||
| Colorado |
162 | $ | 301.4 | 52 | 16,964 | 596 | 9 | |||||||||||||||||
|
|
|
|
|
|
|
|
|
|
|
|||||||||||||||
| Central Region Total |
2,890 | $ | 239.7 | 640 | 160,551 | 12,041 | 123 | |||||||||||||||||
|
|
|
|
|
|
|
|
|
|
|
|||||||||||||||
| East Region |
||||||||||||||||||||||||
| Florida |
312 | $ | 270.7 | 81 | 23,601 | 999 | 10 | |||||||||||||||||
|
|
|
|
|
|
|
|
|
|
|
|||||||||||||||
| Total Company |
3,700 | $ | 254.2 | 778 | $ | 201,816 | 15,224 | 151 | ||||||||||||||||
|
|
|
|
|
|
|
|
|
|
|
|||||||||||||||
| (1) | “Home Sites Controlled” is the estimated number of homes that could be built on unstarted lots we control, including lots available for sale and on land expected to be developed into lots. |
The 9.8% overall increase in our homesites controlled as of December 31, 2011 as compared to the prior year reflects our efforts to execute on our strategy to reposition and re-grow our business in key markets such as California, Texas and Florida. During the last several years, we have exited under-performing markets, sold excess owned lots, terminated lot contracts in less successful subdivisions, purchased and contracted for new projects with smaller lot positions and recalibrated our holdings to be more in line with our current operation volumes.
The average closing price increase in 2011 versus 2010 highlights our successful efforts to acquire, build and sell lots in more desirable locations where we believe there are fewer foreclosures, stronger demand, more marketplace stability, and where we can achieve a higher sales price and stronger margins. The increase also represents a shift in closings volume to the states with higher average sales prices. We believe our land positioning strategies are helping to pave the way for achieving sustainable growth and profitability once more widespread improvements are realized in the economy as a whole and the real estate market.
5
Recent Industry and Company Developments
In 2011, the national economy as a whole and the homebuilding market in particular did not progress and improve as much as initially anticipated. The prolonged economic downturn led to continued intense competition for homebuyers due to the continued high levels of re-sale and foreclosure homes available. In addition, mortgage financing products remain limited, underwriting standards remain restrictive and buyer confidence has not yet rebounded to its pre-recession levels. Therefore, even though home affordability has significantly improved over the past several years, benefiting from both low prices and low interest rates, market improvement has been slow to regain strength, although we believe we are beginning to see signs of stabilization and improvement in some of our markets. We believe we are well-positioned to capitalize on an improving market, but we remain cautious as we believe any recovery will be uneven across our markets.
We continued to focus on our goals of returning to profitability, while maintaining ample liquidity and a strong balance sheet during 2011. We carefully managed our liquidity, ending the year with cash, cash equivalents, restricted cash and investments and securities balances of $333.2 million. We also benefitted from improving comparatives in many of our key metrics as the year progressed including sales, closings and backlog and community count. We continue to rebuild our lot positions with well-located lots to supplement and replace our older communities as they close out and are actively evaluating opportunities for expansion into new markets. In the first half of 2011, we entered the promising Raleigh-Durham, North Carolina market and commenced sales and construction operations there in the latter half of the year. Additionally, in December 2011 we announced our entry into the Tampa market, expanding our presence in Florida, where we have experienced a high level of success in sales and margins over the last several years. We also announced our decision to wind down operations in the struggling Las Vegas market in December 2011, but we will continue to build and sell through the two remaining actively-selling communities we own there. We believe our strategy provides us with the flexibility necessary given the current market conditions to take advantage of unique opportunities to continue to purchase well-positioned lots in select markets that have been less impacted by the homebuilding downturn over the past several years and we continue to evaluate opportunities in the Southeastern United States.
During this downturn and in line with our Meritage Forward strategy, we have conducted an in-depth market review of each one of our submarkets and have repositioned and redesigned much of our product to increase affordability. Our lower cost structure has enabled us to offer homes at selling prices that compete successfully with re-sales and many foreclosures. In some locations, we designed more efficient floor plans, reduced or eliminated certain standard features from our base home models to re-align them with current market demands and reduced the number of floor plans offered, while continuing to provide an ample selection of options and upgrades, allowing our customers to personalize their new homes with the features they consider most important. In other communities, we are able to capitalize on our construction efficiencies and offer a larger product at a competitive price point, increasing the breadth of our buyer demographics. Our divisions have been working with their subcontractors and vendors to achieve additional price concessions through both materials and labor bid renegotiations, and also through reviews of our entire construction cycle, including even-flow scheduling and process improvement initiatives.
Our active community count increased at year-end to 157 versus 151 a year ago. Although our average sales per community during 2011 was 22.1, relatively consistent with prior year of 22.3, our average sales price increased by $14,000 or 5.5%, year over year. Our unsold inventory consisted of 564 homes as of December 31, 2011, slightly higher than prior year of 519 unsold homes, approximately half of which were complete in both 2011 and 2010. At December 31, 2011, we averaged 3.6 unsold homes per active community.
Land Acquisition and Development
Our current goal is to maintain an approximate four-to-five year supply of lots, which we believe provides an appropriate planning horizon to address regulatory matters and land development. To better leverage our existing overhead, we are currently focused on expanding our market share in our key markets and their adjacent submarkets and continue to explore exceptional opportunities outside of our existing markets. As of December 31, 2011 we have a 5.1-year supply of lots, based on 2011 closings, although 13.9% of our holdings are in master-planned Active Adult communities that traditionally contain a significantly larger supply of lots and, accordingly, have a longer lot position. We continually evaluate our markets, monitoring our lot supplies to ensure we have a sufficient pipeline, and are committed to growing our active community count in key locations.
Today, we are purchasing a combination of finished lots and partially-developed or un-developed lots. Finished lots are those on which the development has already been completed and they are ready for immediate home construction. When evaluating land acquisitions, our selection is based upon a variety of factors, including:
6
| • | surrounding demographics based on extensive marketing studies, including surveys of both new and resale homebuyers; |
| • | existing concentration of contracted lots in surrounding markets, including nearby Meritage communities; |
| • | suitability for development, generally within a three to five-year time period from the beginning of the development process to the delivery of the last home; |
| • | financial feasibility of the proposed project, including projected profit margins, returns on capital invested, and the capital payback period; |
| • | the ability to secure governmental approvals and entitlements, if required; |
| • | results of environmental and legal due diligence; |
| • | proximity to local traffic corridors and amenities; |
| • | availability of seller-provided purchase options that allow us to defer lot purchases until needed for production; and |
| • | management’s judgment as to the real estate market and economic trends, and our experience in particular markets. |
When purchasing undeveloped or partially developed land, we generally acquire land only after necessary entitlements have been obtained so that development or construction may begin as market conditions dictate. The term “entitlements” refers to development agreements and tentative maps or recorded plats, depending on the jurisdiction within which the land is located. Entitlements generally give the developer the right to obtain building permits upon compliance with conditions that are ordinarily within the developer’s control. Even though entitlements are usually obtained before land is purchased, we are typically still required to secure a variety of other governmental approvals and permits prior to and during development. The process of obtaining such approvals and permits can substantially delay the development process. We may consider, on a limited basis, the purchase of unentitled property when we can do so in a manner consistent with our business strategy. Historically, we have developed parcels ranging from 100 to 300 lots, although over the past several years we have been primarily focused on limited lot purchases of smaller groups of lots. In order to achieve and maintain an adequate lot inventory, we have also historically purchased larger parcels, in some cases with joint venture partners. In some cases, these joint ventures purchase undeveloped land and develop the land themselves. In select cases, we may also acquire distressed assets from banks, governmental entities, or opportunity funds.
Once we secure undeveloped land, we generally initiate development through contractual agreements with subcontractors. These activities include site planning and engineering, as well as constructing road, sewer, water, utilities, drainage, recreation facilities and other improvements and refinements. We frequently build homes in master-planned communities with home sites that are along or near major amenities, such as golf courses or recreation facilities.
The factors used to evaluate finished lot purchases are similar to those for land we intend to develop ourselves, although the development risks associated with the undeveloped land—financial, environmental, legal and governmental—have been borne by others. Therefore, these finished lots are more attractive to us, despite their higher price, as we can immediately begin home construction.
We develop a design and marketing concept tailored to each community, which includes the determination of size, style and price range of homes. We may also determine street layout, individual lot size and layout, and overall community design for these projects. The product lines offered depend upon many factors, including the guidelines, if any, of an existing community, housing generally available in the area, the needs and desired housing product for a particular market, and our lot sizes, though we are increasingly able to use standardized design plans across our communities.
We typically acquire land through land purchase and option contracts. Purchases are generally financed through our working capital or corporate borrowings. Acquiring our land through option contracts, when available, allows us to control the timing and volume of lot and land purchases from the third parties and minimizes our up-front cash outlay. We typically enter into option contracts to purchase finished lots at pre-determined prices during a specified period of time from these third parties, usually structured to approximate our projected absorption rate at the time the contract is negotiated. These contracts are generally non-recourse and typically require the payment of non-refundable deposits of 5% to 15% of the sales
7
price. We believe the use of options limits the market risks associated with land ownership by allowing us to re-negotiate option terms or terminate options in the event of declines in land value and/or market downturns. The recent availability of such option lots has been drastically reduced. If market conditions deteriorate, we might attempt to re-negotiate our option and purchase contracts to achieve terms more consistent with market conditions. Such adjustments could include deferment, or reduction in lot takedown requirements and price concessions. If we are not successful in these re-negotiations, we might determine that a project is no longer feasible or desirable and cancel these contracts, usually resulting in the forfeiture of our option deposits and any associated capitalized pre-acquisition costs.
As of December 31, 2011, we believe that nearly all of our option contracts that were initially entered into before the housing downturn and that had terms that currently could make them economically not viable have been either renegotiated or terminated.
During 2011, in light of difficult market conditions, we forfeited some of our rights to acquire land via option or other similar contracts, terminating options on about 338 lots, and we wrote off option deposits and pre-acquisition costs of $2.8 million during the year. At December 31, 2011, in addition to our approximately 13,887 owned lots, we also had approximately 2,835 committed lots under option or contract for a total purchase price of approximately $157.8 million, with $14.9 million in cash deposits. Additional information relating to our impairments is discussed in Note 2—Real Estate and Capitalized Interest, and information related to lots and land under option is presented in Note 3—Variable Interest Entities and Consolidated Real Estate Not Owned in the accompanying consolidated financial statements.
All lot acquisitions are reviewed by our corporate land acquisition committee, which is comprised of our senior management team and key operating and financial executives. All land acquisitions exceeding pre-specified limits must also be approved by our Board of Directors.
The following table presents information as of December 31, 2011 (dollars in thousands):
| Number of Lots Owned (1) |
Number of Lots Under Contract or Option (1)(2) |
Total Number of Lots Controlled |
||||||||||||||
| Finished | Under Development and Held for Sale |
|||||||||||||||
| West Region |
||||||||||||||||
| California |
1,094 | 370 | 63 | 1,527 | ||||||||||||
| Nevada |
425 | 0 | 0 | 425 | ||||||||||||
|
|
|
|
|
|
|
|
|
|||||||||
| West Region Total |
1,519 | 370 | 63 | 1,952 | ||||||||||||
| Central Region |
||||||||||||||||
| Arizona |
2,570 | 3,831 | 389 | 6,790 | ||||||||||||
| Texas |
1,636 | 2,648 | 1,541 | 5,825 | ||||||||||||
| Colorado |
227 | 89 | 291 | 607 | ||||||||||||
|
|
|
|
|
|
|
|
|
|||||||||
| Central Region Total |
4,433 | 6,568 | 2,221 | 13,222 | ||||||||||||
| East Region |
||||||||||||||||
| North Carolina |
79 | 109 | 53 | 241 | ||||||||||||
| Florida |
525 | 284 | 498 | 1,307 | ||||||||||||
|
|
|
|
|
|
|
|
|
|||||||||
| East Region Total |
604 | 393 | 551 | 1,548 | ||||||||||||
| Total Company |
6,556 | 7,331 | 2,835 | 16,722 | ||||||||||||
|
|
|
|
|
|
|
|
|
|||||||||
| Total book cost (3) |
$ | 347,139 | $ | 219,703 | $ | 14,867 | $ | 581,709 | ||||||||
|
|
|
|
|
|
|
|
|
|||||||||
| (1) | Excludes lots with finished homes or homes under construction. The number of lots is an estimate and is subject to change. |
| (2) | There can be no assurance that we will actually acquire any lots under option or purchase contract. These amounts do not include approximately 680 lots under contract with $341,000 of refundable earnest money deposits, for which we have not completed due diligence and, accordingly, have no money at risk and are under no obligation to perform under the contract. |
| (3) | For Lots Owned, book cost primarily represents land, development and capitalized interest. For Lots under Contract or Option, book cost primarily represents earnest and option deposits. |
8
Investments in Unconsolidated Entities — Joint Ventures
Historically, we have participated in land development joint ventures as a means of accessing larger parcels of land and lot positions, expanding our market opportunities, managing our risk profile and leveraging our capital base; however, in recent years, such ventures have not been a significant avenue for us to access lots. We currently have only two such active ventures. We also participate in six mortgage and title business joint ventures. The mortgage joint ventures are engaged in, or invest in mortgage companies that engage in, mortgage brokerage activities, and they originate and provide services to both our customers and other homebuyers.
In connection with our land development joint ventures, we may also provide certain types of guarantees to associated lenders and municipalities.
Construction Operations
We act as the general contractor for our projects and typically hire experienced subcontractors on a geographic basis to complete construction at a fixed price. We usually enter into agreements with subcontractors and materials suppliers on an individual basis after receiving competitive bids. We obtain information from prospective subcontractors and suppliers with respect to their financial condition and ability to perform their agreements before formal bidding begins. We also enter into longer-term contracts with subcontractors and suppliers, where possible, to obtain more favorable terms, minimizing construction costs. Our contracts require that our subcontractors comply with all laws pertaining to their work, follow local building codes and permits, and meet performance standards. Following our Meritage Forward strategy, purchasing and construction managers coordinate and supervise the activities of subcontractors and suppliers, and monitor compliance with zoning and building codes. At December 31, 2011, we employed approximately 164 full-time construction operations personnel.
We specify that quality durable materials be used in construction of our homes and we do not maintain significant inventories of construction materials, except for work in process materials for homes under construction. When possible, we negotiate price and volume discounts and rebates with manufacturers and suppliers on behalf of our subcontractors so we can take advantage of production volume. Our raw materials consist primarily of lumber, concrete and similar construction materials and are generally purchased on a national or regional level. Such materials have historically been available from multiple suppliers and therefore we do not believe there is a supplier risk concentration. Because such materials are comprised substantially of natural resource commodities, however, their cost and availability is subject to national and worldwide price fluctuations and inflation, each of which could be impacted by legislation relating to energy and climate change.
We generally build and sell homes in phases within our larger projects, which we believe creates efficiencies in land development and home construction operations and cash management, and improves customer satisfaction by reducing the number of vacant lots and construction activity surrounding a completed home. Our homes are typically completed within two to four months from the start of construction, depending upon the geographic location and the size and complexity of the home; although, as previously discussed, we have a 99-day guarantee at select communities where the entire home purchase cycle from the time a buyer signs a contract to close is just 99 days or less. Construction schedules may vary depending on the size of the home, availability of labor, materials and supplies, product type, location and weather. Our homes are usually designed to promote efficient use of space and materials, and to minimize construction costs and time. We typically do not enter into any derivative contracts to hedge against weather or materials fluctuations as we do not believe they are particularly advantageous to our operations, although we do lock in long-term pricing with our vendors for certain key construction commodities.
Marketing and Sales
We believe that we have an established reputation for building high quality homes, which helps generate demand in each new project. We also use advertising and other promotional activities, including our website at www.meritagehomes.com, social media outlets, magazine and newspaper advertisements, brochures, direct mailings and the placement of strategically located signs in the vicinities around our developments. Our marketing strategy is aimed at differentiating us from other new homebuilders, traditional resale homes and, more recently, foreclosure and short sale homes.
We use furnished model homes as a marketing tool to demonstrate to prospective homebuyers the advantages of the designs and features of our homes. We generally employ or contract with interior and landscape designers who create attractive model homes and complexes that highlight the options available for the product line within a project. We generally build between one and three model homes for each actively selling community, depending upon the number of homes to be
9
built in the project and the products to be offered. In our Meritage Green communities, we have built over 50 “learning centers”, where we have partially “de-constructed” models in order to provide our buyers with the ability to see first-hand what “green” features are included in their home and the impact these features have on their utility bills. In conjunction with the learning centers, our sales and marketing efforts use testimonials from actual homebuyers in order to showcase real-life examples of how green features impact the bottom line of our buyers’ utility bills.
We sell and lease back some of our model homes from individual buyers who do not intend to occupy the home immediately. At December 31, 2011, we owned 191 and leased 19 model homes and had an additional 12 models under construction.
Our homes generally are sold by our commissioned employees who typically work primarily from a sales office located in one of the model homes for each project. We also employ a team of online sales associates who offer assistance to potential buyers viewing our products over the Internet. At December 31, 2011, we had approximately 281 full-time sales and marketing personnel. Our goal is to ensure that our sales force has extensive knowledge of our housing product, our green features, our sales strategies, and community dynamics, in order to fully execute our marketing message. To achieve this goal, we train our sales associates and conduct regular meetings to update them on our product, sales techniques, competitive products in the area, financing availability and credit score repair opportunities, construction schedules, marketing and advertising plans and the available product lines, pricing, options and warranties offered, as well as the numerous benefits and savings our green product offers. Our sales associates are licensed real estate agents where required by law. Independent brokers may also sell our homes, and are usually paid a sales commission based on the price of the home. Our sales associates assist our customers in adding available customization features to their homes, which we design to appeal to local consumer demands. We mainly contract with third-party design studios that specialize in assisting our homebuyers with options and upgrades to personalize their homes. Utilizing these third-party design studios allows us to manage our overhead and costs more efficiently. We may also offer various sales incentives, including price concessions, assistance with closing costs, and landscaping or interior upgrades, to attract buyers. The use and type of incentives depends largely on economic and local competitive market conditions.
We have taken significant strides in further setting ourselves apart from our competitors through our Meritage Green strategy and product line-up. We believe our ongoing commitment to design and build energy-efficient homes taps into a buyer’s sensitivities of how eco-friendly designs help impact both the environment, as well as their pocketbook. We further believe it is strategies such as this that have helped us weather the prolonged downward pressure on buyer demand and to maintain our status as one of the leading homebuilders.
Backlog
We generally require a signed sales contract to release a lot to start construction, although on a regular basis we also start a certain number of homes for speculative sales inventory, as we have had a high level of success with these quick move-in opportunities. Our sales contracts require cash deposits and are usually subject to certain contingencies such as the buyer’s ability to qualify for financing. Additional deposits are usually collected upon the selection of options and upgrades. Homes covered by such sales contracts but which are not yet closed are considered “backlog” and are representative of potential future revenues. Started homes are excluded from backlog until a sales contract is signed and are referred to as unsold or “spec” inventory. Sales contingent upon the sale of a customer’s existing home are not considered a sale until the contingency is removed. We start homes without sales contracts in order to increase inventory levels to meet demand for quick move-ins for the renter and first-time buyer demographic and, at times, to close out a community.
We do not recognize any revenue from home sales until a finished home is delivered to the homebuyer, payment is collected and other criteria for sale and profit recognition are met. At December 31, 2011, of our total homes in inventory, 18.2% were under construction without sales contracts and 27.4% were completed homes without sales contracts. A substantial majority of the unsold homes resulted from homesites that began construction with a valid sales contract that was subsequently cancelled. We believe that during 2012 we will deliver to customers substantially all homes in backlog at December 31, 2011 under existing or, in the case of cancellations, replacement sales contracts.
Our backlog increased 17.6% to 915 units with a value of approximately $248.9 million at December 31, 2011 from 778 units with a value of approximately $201.8 million at December 31, 2010. These increases are due to our higher sales and the increase in community count in the fourth quarter of 2011 as compared to the same period a year ago.
10
Customer Financing
We attempt to help qualified homebuyers who require financing to obtain loans from mortgage lenders that offer a variety of financing options. While our homebuyers may obtain financing from any provider of their choice, we have entered into several joint venture arrangements with established mortgage brokers in most of our markets that allow those ventures to primarily act as a preferred mortgage broker to our buyers to help facilitate the sale and closing process as well as generate additional fee income. In some markets we also use unaffiliated preferred mortgage lenders. We may pay a portion of the closing costs to assist homebuyers with financing. Since many customers use long-term mortgage financing to purchase homes, the current decrease of availability of mortgage loans, tighter underwriting standards and the collapse of the sub-prime loan market have reduced the availability of such loans to our homebuyers, although recent decreases in interest rates have increased the affordability of mortgage payments for some of our potential buyers.
Customer Relations, Quality Control and Warranty Programs
We believe that positive customer relations and an adherence to stringent quality control standards are fundamental to our continued success, and that our commitment to buyer satisfaction and quality control has significantly contributed to our reputation as a high-quality builder.
In accordance with our company-wide standards, a Meritage project manager or superintendent and a customer relations representative generally monitor compliance with quality control standards for each community. These representatives perform the following tasks:
| • | oversee home construction; |
| • | monitor subcontractor and supplier performance; |
| • | manage the scheduling and construction completion deadlines; |
| • | conduct formal inspections as specific stages of construction are completed; and |
| • | regularly update buyers on the progress of their homes and coordinate the closing process. |
We generally provide a one-to-two-year limited warranty on workmanship and building materials and a ten-year warranty for structural defects on each home we build. We generally require our subcontractors to provide an indemnity and a certificate of insurance before beginning work, and therefore any claims relating to workmanship and materials are generally the subcontractors’ responsibility. With the assistance of an actuary, we have estimated and established reserves for future structural warranty costs based on the number of home closings and historical data trends for our communities. Warranty reserves generally range from 0.2% to 0.7% of a home’s sale price. Those projections are subject to variability due to uncertainties regarding structural defect claims for the products we build, the markets in which we build, claim settlement history, insurance and legal interpretations, among other factors. Historically, these reserves have been sufficient to cover out-of-pocket costs that we were required to absorb for warranty repairs.
Competition and Market Factors
The development and sale of residential property is a highly-competitive industry. We compete for sales in each of our markets with national, regional and local developers and homebuilders, although recently our primary competition has been existing home resales, foreclosures, and to a lesser extent, condominiums and rental housing. Some of our competitors have significantly greater financial resources and may have lower costs than we do. Competition among both small and large residential homebuilders is based on a number of interrelated factors, including location, reputation, amenities, design, quality and price. We believe that we compare favorably to other homebuilders in the markets in which we operate due to our:
| • | experience within our geographic markets which allows us to develop and offer products that are in line with the needs and desires of the targeted demographic; |
| • | streamlined construction processes that allow us to save on material, labor and time and pass those savings to our customers in the form of lower prices; |
| • | ENERGY STAR® standards in all of our communities and incremental “green” features that create additional benefits to our customers and differentiate our product from competing new and existing homes inventory; |
| • | ability to recognize and adapt to changing market conditions, from both a capital and human resource perspective; |
| • | ability to capitalize on opportunities to acquire land on favorable terms; and |
| • | reputation for outstanding service and quality products. |
11
Although the current economic uncertainty has impacted our sales efforts, our new product offerings and strategic locations are successfully competing with both existing homes inventory and surrounding new-home communities as evidenced by our year-over-year gains in sales and backlog, and we expect that once the market stabilizes, the strengths noted above will continue to provide us with long-term competitive advantages.
We have an extensive market research department, whose goal is to assist our divisions in each of our local markets to better compete with other homebuilders, and the inventory of foreclosure and re-sale homes in surrounding neighborhoods. Our strategic operations team conducts in-depth community-level reviews in each of our markets, including a detailed analysis of existing inventory, pricing, buyer demographics and the identification of each location’s key buyer metrics. This analysis and resulting analytical tools assist in decision-making regarding product designs, positioning, and pricing and underwriting standards for lot purchases and land development. Additionally, our market research department is also focused on evaluating and identifying new market opportunities. The anlaysis of entry into a new market includes comprehensive research and surveys of buyer demographics and demands, competitor composition and performance, the surrounding job market and employment statistics, foreclosure activity and desirability of the market in general. Based on the results of our market research, we successfully entered the Raleigh-Durham market in 2011 and announced our entry into the Tampa market.
Government Regulation and Environmental Matters
To the extent that we acquire undeveloped land, it is primarily acquired after entitlements have been obtained. Construction may begin almost immediately on such entitled land upon compliance with and receipt of specified permits, approvals and other conditions, which generally are within our control. The time needed to obtain such approvals and permits affects the carrying costs of unimproved property acquired for development and construction. The continued effectiveness of permits already granted is subject to factors such as changes in government policies, rules and regulations, and their interpretation and application. To date, the government approval processes discussed above have not had a material adverse effect on our development activities, although there is no assurance that these and other restrictions will not adversely affect future operations as, among other things, sunset clauses may exist on some of our entitlements and could lapse.
Local and state governments have broad discretion regarding the imposition of development fees for projects under their jurisdictions. These fees are normally established when we receive recorded maps or plats and building permits. Communities may also require concessions or may require the builder to construct certain improvements to public places such as parks and streets. In addition, communities may impose construction moratoriums. Because most of our land is entitled, construction moratoriums generally would not affect us in the near term unless they arise from health, safety or welfare issues, such as insufficient water, electric or sewage facilities. In the long term, we could become subject to delays or may be precluded entirely from developing communities due to building moratoriums, “no growth” or “slow growth” initiatives or building permit allocation ordinances, which could be implemented in the future.
In addition, there is a variety of new legislation being enacted, or considered for enactment at the federal, state and local level relating to energy and climate change. This legislation relates to items such as carbon dioxide emissions control and building codes that impose energy efficiency standards. New building code requirements that impose stricter energy efficiency standards could significantly increase our cost to construct homes, although our “green” initiatives meet, and in many instances exceed, current and expected energy efficiency thresholds. As climate change concerns continue to grow, legislation and regulations of this nature are expected to continue and may result in increased costs. Similarly, energy-related initiatives affect a wide variety of companies throughout the United States and the world, and because our operations are heavily dependent on significant amounts of raw materials, such as lumber, steel, and concrete, they could have an indirect adverse impact on our operations and profitability to the extent the manufacturers and suppliers of our materials are burdened with expensive carbon dioxide emissions control and energy related regulations.
We are also subject to a variety of local, state, and federal statutes, ordinances, rules and regulations concerning the protection of health and the environment. In some markets, we are subject to environmentally sensitive land ordinances that mandate open space areas with public elements in housing developments, and prevent development on hillsides, wetlands and other protected areas. We must also comply with flood plain restrictions, desert wash area restrictions, native plant regulations, endangered species acts and view restrictions. These and similar laws may result in delays, cause substantial compliance and other costs, and prohibit or severely restrict development in certain environmentally sensitive regions or areas. To date, compliance with such ordinances has not materially affected our operations, although it may do so in the future.
12
We usually will condition our obligation to acquire property on, among other things, an environmental review of the land. To date, we have not incurred any unanticipated liabilities relating to the removal of unknown toxic wastes or other environmental matters. However, there is no assurance that we will not incur material liabilities in the future relating to toxic waste removal or other environmental matters affecting land currently or previously owned.
In order for our homebuyers to finance their home purchases with FHA-insured or VA-guaranteed or USDA-guaranteed mortgages, we are required to build such homes in accordance with the regulatory requirements of those agencies.
Some states have statutory disclosure requirements governing the marketing and sale of new homes. These requirements vary widely from state to state.
Some states require us to be registered as a licensed contractor, a licensed real estate broker and in some markets our sales agents are required to be registered as licensed real estate agents.
Employees, Subcontractors and Consultants
At December 31, 2011, we had approximately 660 full-time employees, including approximately 215 in management and administration, 281 in sales and marketing, and 164 in construction operations. Our operations are carried out through both local and centralized corporate management. Local operations are made up of our division employees, led by management with significant homebuilding experience and who typically possess a depth of knowledge in their particular markets. Our centralized corporate management sets our strategy and leads decisions related to our overall strategies related to land acquisition, risk management, finance, cash management and information systems. Our employees are not unionized, and we believe that we have good employee relationships. We pay for a substantial portion of our employees’ insurance costs, with the balance contributed by the employees. We also have a 401(k) savings plan, which is available to all employees who meet the plan’s participation requirements. All of our employees, including officers and directors, are required to comply with our Code of Ethics and to immediately report through the appropriate channels, any known instances of non-compliance.
We act solely as a general contractor, and all construction operations are supervised by our project managers and field superintendents who manage third party subcontractors. We use independent consultants and contractors for architectural, engineering, advertising and some legal services, and we strive to maintain good relationships with our subcontractors and independent consultants and contractors.
Seasonality
Historically, we experienced seasonal variations in our quarterly operating results and capital requirements. We typically sell more homes in the first half of the fiscal year than in the second half, which creates additional working capital requirements in the second and third quarters to build our inventories to satisfy the deliveries in the second half of the year. We typically benefit from the cash generated from home closings in the third and fourth quarters. We expect this seasonal pattern to continue over the long term, although it has been and may continue to be affected by the current volatility in the homebuilding industry.
The risk factors discussed below are factors that we believe could significantly impact our business, if they occur. These factors could cause results to differ materially from our historical results or our future expectations.
Risk Factors Related to our Business
If the current downturn becomes more severe or continues for an extended period of time, it would have continued negative consequences on our operations, financial position and cash flows.
Continued weakness in the homebuilding industry could have an adverse effect on us. It could require that we write off or write down more assets, dispose of assets, reduce operations, restructure our debt and/or raise new equity or debt to pursue our business plan, any of which could have a detrimental effect on our current stakeholders.
13
Although in 2011 we recorded a net loss, we were able to maintain cash reserves and keep our net-debt to capital ratio within our internal target threshold. In the last five years we recorded sizable real-estate impairments that eroded our equity from our historical pre-downturn levels. Additional external factors, such as the duration of the economic downturn and high foreclosure and employment rates could put additional downward pressure on our results. Although we are seeing some signs of stabilization and potential recovery in certain markets, it is uncertain how much longer the current economic uncertainty will continue and what the negative effect may be to our financial results.
Mortgage availability decreases and interest rate increases may make purchasing a home more difficult and may cause an increase in the number of new and existing homes available for sale.
In general, housing demand is adversely affected by the lack of availability of mortgage financing and increases in interest rates. Continued high levels of foreclosures and sales of existing inventories of previously foreclosed homes could increase the available home inventory supply, which may result in price reductions. Most of our buyers finance their home purchases through our mortgage joint ventures or third-party lenders providing mortgage financing. If mortgage interest rates increase and, consequently, the ability of prospective buyers to finance home purchases is adversely affected, home sales, gross margins and cash flow may also be adversely affected and the impact may be material. Although long-term interest rates currently remain at historically low levels, it is impossible to predict future increases or decreases in market interest rates.
Homebuilding activities also depend, in part, upon the availability and costs of mortgage financing for buyers of homes owned by potential customers, as those customers (move-up buyers) often must sell their residences before they purchase our homes. Mortgage lenders continue to be subject to more restrictive underwriting standards by the regulatory authorities which oversee them as a consequence of the sub-prime mortgage market failures, among other reasons. Additionally, potential home buyers who have previously foreclosed or short-sold a home may be precluded from obtaining a mortgage for several years. During 2011, there have been enhanced regulatory and legislative actions with respect to consumer mortgage loans which have hindered the comeback of a more stable consumer mortgage lending environment. Such actions include increased Fannie Mae and Freddie Mac lender fees that were mandated by Congress in an effort to offset a temporary reduction in payroll taxes. Additionally, the Dodd-Frank Wall Street Reform and Consumer Protection Act (“Dodd Frank Act”), was signed into law in 2010, which established several new standards and requirements relating to the origination, securitization and servicing of residential consumer mortgage loans. In addition, the United States and international banking regulators have proposed or enacted higher capital standards and requirements for financial institutions. These standards and requirements, as and when implemented, could further tighten the availability and/or increase the costs to borrowers to obtain such loans. Continued legislative actions and more stringent underwriting standards could have a material adverse effect on our business if certain buyers are unable to obtain mortgage financing. A prolonged tightening of the financial markets could also negatively impact our business.
Expirations, amendments or changes to tax laws, incentives or credits currently available to our homebuyers may negatively impact our business.
Significant changes to existing tax laws that currently benefit our homebuyers, such as the ability to deduct mortgage interest and real property taxes, may result in an increase in the total cost of home ownership and may make the purchase of a home less attractive to our buyers.
If home prices decline, potential buyers may not be able to sell their existing homes, which may negatively impact our sales.
As a participant in the homebuilding industry, we are subject to market forces beyond our control. In general, housing demand is impacted by the affordability of housing. Many homebuyers need to sell their existing homes in order to purchase a new home from us, and continued weakness in the home resale market or further decreases in home sale prices could adversely affect that ability. Declines in home prices would have an adverse effect on our homebuilding business margins and cash flows.
High cancellation rates may negatively impact our business.
Our backlog reflects the number and value of homes for which we have entered into non-contingent sales contracts with customers but have not yet delivered those homes. Although these sales contracts typically require a cash deposit and do not make the sale contingent on the sale of the customer’s existing home, a customer may in certain circumstances cancel the contract and receive a complete or partial refund of the deposit as a result of local laws or contract provisions. If home prices decline, the national or local homebuilding environment remains weak or declines further or interest rates increase, homebuyers may have an incentive to cancel their contracts with us, even where they might be entitled to no refund or only a partial refund. Significant cancellations have previously had, and could in the future have, a material adverse effect on our business as a result of lost sales revenue and the accumulation of unsold housing inventory.
14
Our future operations may be adversely impacted by high inflation.
We, like other homebuilders, may be adversely affected during periods of high inflation, mainly from higher land and construction and materials costs. Also, higher mortgage interest rates may significantly affect the affordability of mortgage financing to prospective buyers. Inflation could increase our cost of financing, materials and labor and could cause our financial results or growth to decline. Traditionally, we have attempted to pass cost increases on to our customers through higher sales prices. Although inflation has not historically had a material adverse effect on our business, sustained increases in material costs would have a material adverse effect on our business if we are unable to correspondingly increase home sale prices.
A reduction in our sales absorption levels may force us to incur and absorb additional community-level costs.
We incur certain overhead costs associated with our communities, such as marketing expenses and costs associated with the upkeep and maintenance of our model and sales complexes. If our sales absorptions pace decreases and the time required to close out our communities is extended, we would likely incur additional overhead costs, which would negatively impact our financial results. Additionally, we incur various land development improvement costs for a community prior to the commencement of home construction. Such costs include infrastructure, utilities, taxes and other related expenses. Reduction in home absorption rates increases the associated holding costs, our time to recover such costs, and the value of such assets. Further declines in the homebuilding market may also require us to evaluate the recoverability of costs relating to land acquired more recently.
The value of our real estate inventory may further decline, leading to impairments and reduced profitability.
A limited portion of our remaining owned land was purchased at prices that reflected the strong homebuilding and real estate markets experienced during the mid 2000s. As such, we wrote down the value of certain inventory over the last several years to reflect current market conditions and have abandoned certain projects. To the extent that we still own or have options/purchase agreements related to such land parcels, a further decline in the homebuilding market may require us to re-evaluate the value of our land holdings and we could incur additional impairment charges, which would decrease both the book value of our assets and stockholders’ equity.
Our long-term success depends on the availability of finished lots and undeveloped land that meet our land investment criteria.
The availability of finished and partially developed lots and undeveloped land that meet our investment and marketing standards depends on a number of factors outside of our control, including land availability in general, competition with other homebuilders and land buyers, credit market conditions, legal and government agency processes, inflation in land prices, zoning, our ability and the costs to obtain building permits, the amount of environmental impact fees, property tax rates and other regulatory requirements. Should suitable lots or land become less available, the number of homes that we may be able to build and sell could be reduced, and the cost of attractive land could increase, which could adversely impact our financial results. The availability of suitable land assets could also affect the success of our strategic land acquisition strategy, which may impact our ability to increase the number of actively selling communities, to grow our revenues and margins, and to achieve or maintain profitability.
Reduced levels of sales may cause us to re-evaluate the viability of existing option contracts, resulting in a potential termination of these contracts which may lead to further impairment charges.
Historically, a significant portion of our lots were controlled under option contracts. Such options generally require a cash deposit that will be forfeited if we do not exercise the option. During the last several years, we forfeited significant amounts of deposits and wrote off related pre-acquisition costs related to projects we no longer deemed feasible, as they were not generating acceptable returns. Although our remaining pool of optioned projects has significantly decreased due to abandonments and the unwillingness of sellers to provide option terms, an additional downturn in the homebuilding market may cause us to re-evaluate the feasibility of our remaining optioned projects, which may result in writedowns that would reduce our assets and stockholders’ equity.
Our business may be negatively impacted by natural disasters.
Our homebuilding operations include operations in Texas, California, North Carolina and Florida. Some of our markets in Texas, North Carolina and Florida occasionally experience extreme weather conditions such as tornadoes and/or hurricanes. California has experienced a significant number of earthquakes, wildfires, flooding, landslides and other natural disasters in recent years. We do not insure against some of these risks. These occurrences could damage or destroy some of our homes under construction or our building lots, which may result in uninsured or underinsured losses. We could also suffer significant construction delays or substantial fluctuations in the pricing or availability of building materials. Any of these events could cause a decrease in our revenue, cash flows and earnings.
15
Our joint ventures with independent third parties may be illiquid, and we may be adversely impacted by our joint venture partners’ failure to fulfill their obligations.
We occasionally participate in land acquisition and development joint ventures with independent third parties, in which we have less than a controlling interest. Our participation in these types of joint ventures has decreased over the last few years due to current market conditions and the reduced need for lots, and we have reduced our involvement in such ventures to just two active land joint ventures. Historically, these joint ventures were structured to provide us with a means of accessing larger parcels and lot positions and to help us expand our marketing opportunities and manage our risk profile. However, these joint ventures often acquire parcels of raw land without entitlements and as such are subject to a number of development risks that our business does not face directly. These risks include the risk that anticipated projects could be delayed or terminated because applicable governmental approvals cannot be obtained, timely obtained or obtained at reasonable costs. In addition, the risk of construction and development cost overruns can be greater for a joint venture where it acquires raw land compared to our typical acquisition of entitled lots. These increased development and entitlement risks could have a material adverse effect on our financial position or results of operations if one or more joint venture projects is delayed, cancelled or terminated or we are required, whether contractually or for business reasons, to invest additional funds in the joint venture to facilitate the success of a particular project.
Our joint venture investments are generally very illiquid both because we often lack a controlling interest in the ventures and because most of our joint ventures are structured to require super-majority or unanimous approval of the members to sell a substantial portion of the joint venture’s assets or for a member to receive a return of their invested capital. Our lack of a controlling interest also results in the risk that the joint venture will take actions that we disagree with, or fail to take actions that we desire, including actions regarding the sale or financing of the underlying property. In the ordinary course of our business, we provide letters of credit and performance, maintenance and other bonds in support of our related obligations with respect to the development of our joint venture projects. We had no such letters of credit or bonds as of December 31, 2011. In limited cases, we may also offer pro-rata limited repayment guarantees on our portion of the joint venture debt or other debt repayment guarantees. Our limited repayment guarantees were $0.3 million as of December 31, 2011.
With respect to certain of our joint ventures, we and our joint venture partners may be obligated to complete land development improvements if the joint venture does not perform the required development, which could require significant expenditures. In addition, we and our joint venture partners sometimes agree to indemnify third party surety providers with respect to performance bonds issued on behalf of certain of our joint ventures. In the event the letters of credit or bonds are drawn upon, we, and in the case of a joint venture, our joint venture partners, would be obligated to reimburse the surety or other issuer of the letter of credit or bond if the obligations the bond or guarantee secures are not performed by us (or the joint venture). If one or more bonds, letters of credit or other guarantees were drawn upon or otherwise invoked, we could have additional financial obligations.
As of December 31, 2011, we were involved in legal proceedings over certain guarantees relating to a large joint venture in which we hold less than a 4% interest. We cannot guarantee that additional events will not occur or that such obligations will not be invoked, although at December 31, 2011 we have a very limited number of such guarantees related to our existing joint ventures.
If we are unable to successfully compete in the highly competitive housing industry, our financial results and growth may suffer.
The housing industry is highly competitive. We compete for sales in each of our markets with national, regional and local developers and homebuilders, existing home resales (including foreclosures) and, to a lesser extent, condominiums and available rental housing. Some of our competitors have significantly greater financial resources and some may have lower costs than we do. Competition among both small and large residential homebuilders is based on a number of interrelated factors, including location, reputation, amenities, design, quality and price. Competition is expected to continue and may become more intense, and there may be new entrants in the markets in which we currently operate and in markets we may enter in the future and our industry may also experience some consolidations. If we are unable to successfully compete, our financial results and growth could suffer.
16
Some homebuyers may cancel their home purchase contracts with us because their deposits are generally a small percentage of the purchase price and are potentially refundable.
In connection with the purchase of a home, our policy is to generally collect a deposit from our customers, although typically, this deposit reflects a small percentage of the total purchase price, and due to local regulations, the deposit may, in certain circumstances, be fully or partially refundable prior to closing. If the prices for our homes in a given community decline further, our neighboring competitors increase their sales incentives, interest rates increase, the availability of mortgage financing tightens or there is a further downturn in local, regional or national economies, homebuyers may cancel their home purchase contracts with us. In past years, we experienced above-normal cancellation rates, although in 2010 and 2011 cancellation rates returned to historical levels. Continued uncertainty in the homebuilding market could adversely impact our cancellation rates, which would have a negative effect on our results of operations.
We are subject to construction defect and home warranty claims arising in the ordinary course of business, which may lead to additional reserves or expenses.
Construction defect and home warranty claims are common in the homebuilding industry and can be costly. Therefore, in order to account for future potential obligations, we establish a warranty reserve in connection with every home closing. Additionally, we maintain general liability insurance and generally require our subcontractors to provide insurance coverage and indemnify us for liabilities arising from their work; however, we cannot be assured that our warranty reserves and those insurance rights and indemnities will be adequate to cover all construction defect and warranty claims for which we may be held liable. For example, we may be responsible for applicable self-insured retentions, and certain claims may not be covered by insurance or may exceed applicable coverage limits.
During 2009 we recorded a charge of $6.0 million associated with the repair of less than 100 homes built by us in 2005 and 2006 in Florida that we had then confirmed to contain defective drywall manufactured in China. We have more recently determined that of these homes, approximately 95 homes we constructed in Florida and less than 10 homes we constructed in the Houston, Texas area during 2005 and 2006 contain the defective drywall. We have been named as a defendant in several omnibus complaints as part of one Federal Court lawsuit and one Florida State Court lawsuit relating to Chinese drywall. The Florida State case has been resolved and dismissed. It is possible that we may, in the future, be subject to additional litigation relating to defective Chinese drywall. We believe our existing warranty reserves are sufficient to cover costs and claims associated with the repair of the above-mentioned homes. As of December 31, 2011, we completed our repair of most of these homes and have been reimbursed for a significant portion of our costs to date and anticipate that any future costs will also be substantially reimbursed through both our insurance provider as well as the manufacturers, and our subcontractors’ and suppliers’ and/or their insurance providers. We do not anticipate significant additional spending related to the homes confirmed to contain the defective drywall. However, if and to the extent the scope of the defective Chinese drywall issue increases beyond our projections, or in the event defective Chinese drywall is, through credible evidence, linked to significant adverse health effects of the occupants of the homes containing such defective drywall, or if it is determined that our existing warranty reserves together with anticipated recoveries from our insurance carrier and from other responsible parties and their insurance carriers are not sufficient to cover claims, losses or other issues related to Chinese drywall, then it is possible that we could incur additional costs or liabilities related to this issue that may have a material adverse effect on the results of our operations, financial position and cash flows.
Our income tax provision and other tax liabilities may be insufficient if taxing authorities initiate and are successful in asserting tax positions that are contrary to our position. Additionally, losses from operations in future reporting periods may require us to continue to adjust the valuation allowance against our deferred tax assets.
In the normal course of business, we are audited by various federal, state and local authorities regarding income tax matters. Significant judgment is required to determine our provision for income taxes and our liabilities for federal, state, local and other taxes. Our audits are in various stages of completion; however, no outcome for a particular audit can be determined with certainty prior to the conclusion of the audit, appeal and, in some cases, litigation process. Although we believe our approach to determining the appropriate tax treatment is supportable and in accordance with tax laws and regulations and relevant accounting literature, it is possible that the final tax authority will take a tax position that is materially different than ours. As each audit is conducted, adjustments, if any, are appropriately recorded in our consolidated financial statements in the period determined. Such differences could have a material adverse effect on our income tax provision or benefit, or other tax reserves, in the reporting period in which such determination is made and, consequently, on our results of operations, financial position and/or cash flows for such period.
17
Our net operating loss carryforwards could be substantially limited if we experience an ownership change as defined in the Internal Revenue Code.
In 2010 and 2011 , we generated net operating losses (“NOLs”) for tax purposes which could not be carried back to prior tax years, and we may generate additional NOLs in the future. Under federal tax laws, we can use our NOLs (and certain related tax credits) to offset ordinary income tax on our future taxable income for up to 20 years, after which they expire for such purposes. State NOL carryforwards may be used to offset future taxable income for a period of time ranging from 5 to 20 years, depending on the state, and begin to expire in 2012. Until they expire, we can carry forward our NOLs (and certain related tax credits) that we do not use in any particular year to offset income tax in future years. The benefits of our NOLs would be reduced or eliminated if we experience an “ownership change,” as determined under Section 382 of the Internal Revenue Code. A Section 382 “ownership change” occurs if a stockholder or a group of stockholders who are deemed to own at least 5% of our common stock increase their ownership by more than 50 percentage points over their lowest ownership percentage within a rolling three-year period. If an “ownership change” occurs, Section 382 would impose an annual limit on the amount of NOLs we can use to offset income tax equal to the product of the total value of our outstanding equity immediately prior to the “ownership change” (reduced by certain items specified in Section 382) and the federal long-term tax-exempt interest rate in effect for the month of the “ownership change.” A number of special and complex rules apply to calculating this annual limit.
While the complexity of Section 382’s provisions and the limited knowledge any public company has about the ownership of its publicly-traded stock make it difficult to determine whether an “ownership change” has occurred, we currently believe that an “ownership change” has not occurred. However, if an “ownership change” were to occur, the annual limit Section 382 may impose could result in some of our NOLs expiring unused. This may limit the future value of our federal NOL carryforward and deferred tax assets; however, these assets are only $70.2 million at December 31, 2011, and are currently subject to a full valuation allowance. Therefore, the annual limitation is not expected to have a material impact on our financial results. In 2009, we amended our articles of incorporation to enable us to nullify transactions creating additional 5% holders in an effort to mitigate the risk associated with ownership changes under Section 382. Such restrictions, however, may be waived by us, and there is uncertainty about whether such restrictions would be enforceable or effective under all circumstances.
Our ability to acquire and develop raw or partially finished lots may be negatively impacted if we are unable to secure additional performance bonds.
In connection with land development work we are required to complete on our raw or partially-finished land purchases, we oftentimes provide performance bonds or other assurances for the benefit of the respective municipalities or governmental authorities. These performance bonds provide assurance to the beneficiaries that the development will be completed, or that in case we do not perform, that funds from the bonds are available to finish such work. In the future, additional performance bonds may be difficult to obtain, or may be difficult to obtain on terms that are acceptable to us. The limited availability is due to the current state of the industry and the economy. Additionally, in recent years various surety providers have significantly reduced bonding capacities made available to the homebuilding industry. If we are unable to secure such required bonds, progress on affected projects may be delayed or halted or we may be required to expend additional cash to secure other forms of sureties which may adversely affect our financial position and ability to grow our operations.
The loss of key personnel may negatively impact us.
Our success largely depends on the continuing services of certain key employees and our ability to attract and retain qualified personnel. We have employment agreements with certain key employees who we believe possess valuable industry knowledge, experience and leadership abilities that would be difficult in the short term to replicate. The loss of the services of such key employees could harm our operations and business plans.
Failure to comply with laws and regulations by our employees or representatives may harm us.
We are required to comply with applicable laws and regulations that govern all aspects of our business including land acquisition, development, home construction, mortgage origination, sales and warranty. It is possible that individuals acting on our behalf could intentionally or unintentionally violate some of these laws and regulations. Although we endeavor to take immediate action if we become aware of such violations, we may incur fines or penalties as a result of these actions and our reputation with governmental agencies and our customers may be damaged. Further, other acts of bad judgement may also result in negative financial consequences.
Shortages in the availability of subcontract labor may delay construction schedules and increase our costs.
We conduct our construction operations only as a general contractor. Virtually all architectural, construction and development work is performed by unaffiliated third-party subcontractors. As a consequence, we depend on the continued availability of and satisfactory performance by these subcontractors for the design and construction of our homes and to provide related materials. Although we have not experienced such skilled labor shortages, we cannot be assured that there will be satisfactory performance by these unaffiliated third-party subcontractors, which could have a material adverse affect on our business.
18
Our lack of geographic diversification could adversely affect us if the homebuilding industry in our market declines.
We have operations in Texas, Arizona, California, Nevada, Colorado, Florida, and North Carolina. Many of our geographic operations are located in regions that were most severely impacted by the homebuilding downturn. Although we have recently expanded our operations to new markets, our geographic diversification is still limited and could adversely impact us if the homebuilding business in our current markets should further decline, since we do not currently have a balancing opportunity in other geographic regions.
We experience fluctuations and variability in our operating results on a quarterly basis and, as a result, our historical performance may not be a meaningful indicator of future results.
We historically have experienced, and expect to continue to experience, variability in home sales and results of operations on a quarterly basis. As a result of such variability, our historical performance may not be a meaningful indicator of future results. Factors that contribute to this variability include:
| • | timing of home deliveries and land sales; |
| • | the changing composition and mix of our asset portfolio; |
| • | delays in construction schedules due to adverse weather, acts of God, reduced subcontractor availability and governmental restrictions; |
| • | timing of write-offs and impairments ; |
| • | conditions of the real estate market in areas where we operate and of the general economy; |
| • | the cyclical nature of the homebuilding industry; |
| • | changes in prevailing interest rates and the availability of mortgage financing; |
| • | our ability to acquire additional land or options for additional land on acceptable terms; and |
| • | costs and availability of materials and labor. |
Our level of indebtedness may adversely affect our financial position and prevent us from fulfilling our debt obligations.
The homebuilding industry is capital intensive and requires significant up-front expenditures to secure land and pursue development and construction on such land. Accordingly, we incur substantial indebtedness to finance our homebuilding activities. At December, 31, 2011, we had approximately $606.4 million of indebtedness and $333.2 million of cash, restricted cash, and investments and securities. If we require working capital greater than that provided by operations and our current liquidity position, we may be required to seek additional capital in the form of equity or debt financing from a variety of potential sources, including bank financing and securities offerings. There can be no assurance we would be able to obtain such additional capital on terms acceptable to us, if at all. The level of our indebtedness could have important consequences to our stockholders, including the following:
| • | our ability to obtain additional financing for working capital, capital expenditures, acquisitions or general corporate purposes could be impaired; |
| • | we could have to use a substantial portion of our cash flow from operations to pay interest and principal on our indebtedness, which would reduce the funds available to us for other purposes such as capital expenditures; |
| • | we have a moderate level of indebtedness and a lower volume of cash and cash equivalents than some of our competitors, which may put us at a competitive disadvantage and reduce our flexibility in planning for, or responding to, changing conditions in our industry, including increased competition; and |
| • | we may be more vulnerable to economic downturns and adverse developments in our business than some of our competitors. |
19
We expect to generate cash flow to pay our expenses and to pay the principal and interest on our indebtedness with cash flow from operations or from existing cash reserves. Our ability to meet our expenses thus depends, to a large extent, on our future performance, which will be affected by financial, business, economic and other factors. We will not be able to control many of these factors, such as economic conditions in the markets where we operate and pressure from competitors. If we do not have sufficient funds, we may be required to refinance all or part of our existing debt, sell assets or borrow additional funds. We cannot guarantee that we will be able to do so on terms acceptable to us, if at all. In addition, the terms of existing or future debt agreements may restrict us from pursuing any of these alternatives.
Our debt levels may place limits on our ability to comply with the terms of our debt and may restrict our ability to complete certain transactions.
The indentures for our senior and senior subordinated notes impose significant operating and financial restrictions on us. These restrictions limit our ability and the ability of our subsidiaries, among other things, to:
| • | incur additional indebtedness or liens; |
| • | pay dividends or make other distributions; |
| • | repurchase our stock; |
| • | make acquisitions and investments (including investments in joint ventures); or |
| • | consolidate, merge or sell all or substantially all of our assets. |
A breach of any of our covenants or our inability to maintain the required financial ratios could limit our ability to incur additional debt.
Our ability to obtain third-party financing may be negatively affected by any downgrade of our credit rating from a rating agency
Although we do not currently have any short-term borrowing facilities, we consider the availability of third-party financing to be a key component of our long-term strategy to grow our business either through acquisitions or through internal expansion. As of December 31, 2011, our credit ratings were B+, B1 and B+ by Standard and Poor’s Financial Services, Moody’s Investor Services and Fitch Ratings, respectively, the three primary rating agencies. Any downgrades from these ratings may impact our ability in the future to obtain additional financing, or to obtain such financing at terms that are favorable to us and therefore, may adversely impact our future operations.
We may not be successful in future expansion and integrating future acquisitions.
We may consider growth or expansion of our operations in our current markets or in other areas of the country. Our expansion into new or existing markets could have a material adverse effect on our cash flows and/or profitability. The magnitude, timing and nature of any future expansion will depend on a number of factors, including suitable additional markets and/or acquisition candidates, the negotiation of acceptable terms, our financial capabilities and general economic and business conditions. New acquisitions may result in the incurrence of additional debt. Acquisitions also involve numerous risks, including difficulties in the assimilation of the acquired company’s operations, the incurrence of unanticipated liabilities or expenses, the diversion of management’s attention from other business concerns, risks of entering markets in which we have limited or no direct experience and the potential loss of key employees of the acquired company.
We are subject to extensive government regulations that could cause us to incur significant liabilities or restrict our business activities.
Regulatory requirements could cause us to incur significant liabilities and costs and could restrict our business activities. We are subject to local, state and federal statutes and rules regulating certain developmental matters, as well as building and site design. We are subject to various fees and charges of government authorities designed to defray the cost of providing certain governmental services and improvements. We may be subject to additional costs and delays or may be precluded entirely from building projects because of “no-growth” or “slow-growth” initiatives, building permit ordinances, building moratoriums, or similar government regulations that could be imposed in the future due to health, safety, climate, welfare or environmental concerns. We must also obtain licenses, permits and approvals from government agencies to engage in certain activities, the granting or receipt of which are beyond our control and could cause delays in our homebuilding projects.
20
We are also subject to a variety of local, state and federal statutes, ordinances, rules and regulations concerning the protection of health and the environment. Environmental laws or permit restrictions may result in project delays, may cause substantial compliance and other costs and may prohibit or severely restrict development in certain environmentally sensitive regions or geographic areas. Environmental regulations can also have an adverse impact on the availability and price of certain raw materials, such as lumber.
In addition, there is a variety of new legislation being enacted, or considered for enactment at the federal, state and local level relating to energy and climate change. This legislation relates to items such as carbon dioxide emissions control and building codes that impose energy efficiency standards. New building code requirements that impose stricter energy efficiency standards could significantly increase our cost to construct homes. As climate change concerns continue to grow, legislation and regulations of this nature are expected to continue and become more costly to comply with. Similarly, energy-related initiatives affect a wide variety of companies throughout the United States and the world and because our operations are heavily dependent on significant amounts of raw materials, such as lumber, steel, and concrete, they could have an indirect adverse impact on our operations and profitability to the extent the manufacturers and suppliers of our materials are burdened with expensive cap and trade and similar energy related regulations.
Acts of war may seriously harm our business.
Acts of war or any outbreak or escalation of hostilities throughout the world may cause disruption to the economy, our company, our employees and our customers, which could impact our revenue, costs and expenses and financial condition.
Our ability to build “Green” technologies at a profitable price point may be replicated by other builders in the future, which could reduce our competitive advantage.
We believe we currently have a competitive advantage over other production homebuilders with the rollout of our Meritage Green technology. Our “green” communities offer a high level of energy-saving features included in the base price of our homes, and many of our other communities are engineered to add on optional solar features to further optimize energy savings. If other builders are able to replicate our “green” technologies and offer them at a similar price point, it could diminish our competitive advantage in the marketplace.
Information technology failures and data security breaches could harm our business.
We use information technology and other computer resources to carry out important operational and marketing activities as well as maintain our business records. Many of these resources are provided to us and/or maintained on our behalf by third-party service providers pursuant to agreements that specify certain security and service level standards. Although we and our service providers employ what we believe are adequate security, disaster recovery and other preventative and corrective measures, our ability to conduct our business may be impaired if these resources are compromised, degraded, damaged or fail, whether due to a virus or other harmful circumstance, intentional penetration or disruption of our information technology resources by a third party, natural disaster, hardware or software corruption or failure or error (including a failure of security controls incorporated into or applied to such hardware or software), telecommunications system failure, service provider error or failure, intentional or unintentional personnel actions (including the failure to follow our security protocols), or lost connectivity to our networked resources. A significant and extended disruption in the functioning of these resources could damage our reputation and cause us to lose customers, sales and revenue, result in the unintended public disclosure or the misappropriation of proprietary, personal and confidential information (including information about our homebuyers and business partners), and require us to incur significant expense to address and resolve these kinds of issues. The release of confidential information may also lead to litigation or other proceedings against us by affected individuals and/or business partners and/or by regulators, and the outcome of such proceedings, which could include penalties or fines, could have a material and adverse effect on our consolidated financial statements. In addition, the costs of maintaining adequate protection against such threats, depending on their evolution, pervasiveness and frequency and/or government-mandated standards or obligations regarding protective efforts, could be material to our consolidated financial statements.
Any of the above risk factors could have a material adverse effect on your investment in our bonds and common stock. As a result, you could lose some or all of your investment.
21
Special Note of Caution Regarding Forward-Looking Statements
In passing the Private Securities Litigation Reform Act of 1995 (“PSLRA”), Congress encouraged public companies to make “forward-looking statements” by creating a safe-harbor to protect companies from securities law liability in connection with forward-looking statements. We intend to qualify both our written and oral forward-looking statements for protection under the PSLRA.
The words “believe,” “expect,” “anticipate,” “forecast,” “plan,” “intend,” “may,” “will,” “should,” “could,” “estimate,” and “project” and similar expressions identify forward-looking statements, which speak only as of the date the statement was made. All statements we make other than statements of historical fact are forward-looking statements within the meaning of that term in Section 27A of the Securities Act of 1933, as amended, and Section 21E of the Exchange Act. Forward-looking statements in this Annual Report include statements concerning our belief that we have ample liquidity; our intentions and the expected benefits of our Meritage Forward and Meritage Green strategies and initiatives as well as our land positioning strategies; our perceptions that the homebuilding market has stabilized; our expectations for 2012, including that we expect margin improvement in California; the extent and magnitude of our exposure to defective Chinese drywall and the sufficiency of our reserves relating thereto; our delivery of substantially all of our backlog existing as of year-end; management estimates regarding future impairments and joint venture exposure, including our exposure to joint ventures that are in default of their debt agreements; that we do not anticipate significant additional spending relating to Chinese drywall repair or claims; our positions and our expected outcome relating specifically to the litigation we are involved with concerning the South Edge/Inspirada joint venture; our intentions to not pay dividends; trends in Nevada as we wind down our operations there; the expected benefits of our call center operations; our ability to leverage our local market expertise in Florida to our new Tampa market; that we may use excess liquidity to repurchase our notes and common stock; the sustainability of our tax positions; whether certain guarantees relating to our joint ventures will be triggered and our belief that reimbursements due from lenders to our joint ventures will be repaid; expectations regarding our industry and our business into 2012 and beyond, and that we expect our cash expenditures may exceed our cash generated by operations as we expand our business; the demand for and the pricing of our homes; our land and lot acquisition strategy (including that we will redeploy cash to acquire well-positioned finished lots and that we may participate in joint ventures or opportunities outside of our existing markets if opportunities arise); that all of our option contracts initially entered into before the housing downturn have either been renegotiated or terminated; trends relating to cancellations and our general and administrative expenses; the sufficiency of our warranty reserves; demographic and other trends related to the homebuilding industry in general; the future supply of housing inventory; our expectation that existing guarantees, letters of credit and performance and surety bonds will not be drawn on; the adequacy of our insurance coverage and warranty reserves; the expected outcome of legal proceedings (including tax audits) we are involved in; the sufficiency of our capital resources to support our business strategy; our ability and willingness to acquire land under option or contract; the future impact of deferred tax assets or liabilities; the impact of new accounting standards and changes in accounting estimates; trends and expectations concerning sales prices, sales orders, cancellations, construction costs and gross margins and future home inventories; our future cash needs; the expected vesting periods of unrecognized compensation expense; trends and expectations relating to our community count and lot inventory; the impact of seasonality; and our future compliance with debt covenants and actions we may take with respect thereto.
Important factors currently known to management that could cause actual results to differ materially from those in forward-looking statements, and that could negatively affect our business are discussed in this report under the heading “Risk Factors.”
Forward-looking statements express expectations of future events. All forward-looking statements are inherently uncertain as they are based on various expectations and assumptions concerning future events and they are subject to numerous known and unknown risks and uncertainties that could cause actual events or results to differ materially from those projected. Due to these inherent uncertainties, the investment community is urged not to place undue reliance on forward-looking statements. In addition, we undertake no obligations to update or revise forward-looking statements to reflect changed assumptions, the occurrence of unanticipated events or changes to projections over time. As a result of these and other factors, our stock and note prices may fluctuate dramatically.
Item 1B. Unresolved Staff Comments
None.
Our corporate office is in a leased building located in Scottsdale, Arizona. The lease expires in March 2014.
We lease an aggregate of approximately 246,000 square feet of office space (of which approximately 86,000 square feet is currently subleased by us to third parties) in our markets for our operating divisions, corporate and executive offices.
22
We are involved in various routine legal and regulatory proceedings, including, without limitation, claims and litigation alleging construction defects. In general, the proceedings are incidental to our business, and some are covered by insurance. With respect to the majority of pending litigation matters, our ultimate legal and financial responsibility, if any, cannot be estimated with certainty and, in most cases, any potential losses related to these matters are not considered probable. At December 31, 2011, we had approximately $10.2 million in accrued legal expenses and settlement costs related to warranty claims and litigation where our ultimate exposure is considered probable and the potential loss can be reasonably estimated. At December 31, 2011, we also had an additional $23.1 million of warranty costs reserves. Historically, most warranty claims and disputes are resolved prior to litigation. We believe there are not any pending legal or warranty matters that could have a material adverse impact upon our consolidated financial condition, results of operations or cash flows.
Joint Venture Litigation
Since 2008, we have been in litigation initiated by the lender group regarding a large Nevada-based land acquisition and unconsolidated development joint venture in which the lenders were seeking damages in two separate actions on the basis of enforcement of completion guarantees and other related claims (JP Morgan Chase Bank, N.A. v. KB HOME Nevada, et al., U.S. District Court, District of Nevada (Case No. 08-CV-01711 PMP consolidated)). Our interest in this joint venture was comparatively small, totaling 3.53%, but we have vigorously defended and otherwise sought resolution of these actions. We are the only builder joint venture partner to have fully performed its obligations with respect to takedowns of lots from the joint venture, having completed our first takedown in April 2007 and having tendered full performance of our second and final takedown in April 2008. The joint venture and the lender group rejected our tender of performance of our second and final takedown, and we contend, among other things, that the rejection by the joint venture and the lender group of our tender of full performance was wrongful and constituted a breach of contract and should release us of liability with respect to the takedown and extinguish or greatly reduce our exposure under all guarantees. Pursuant to the lenders’ request and stipulation of the parties, on January 23, 2012, the Court dismissed without prejuidice all of the lenders’ claims against Meritage in this consolidated lawsuit without prejudice (including the “springing” repayment guarantee discussed below).
On December 9, 2010, three of the lenders filed a petition seeking to place the venture into an involuntary bankruptcy. On June 6, 2011, we received a demand letter from the lenders, requesting full payment of $13.2 million the lenders claimed to be owed under the springing repayment guarantee, including past-due interest and penalties. The lenders claim that the involuntary bankruptcy filed by three of the lenders triggered the “springing” repayment guarantee. We do not believe the lenders have an enforceable position associated with their $13.2 million claim and do not believe we will be required to pay such amount because, among other reasons, the lenders breached their contract with us by refusing to accept the April 2008 tender of our performance and by refusing to release their lien in connection with our second and final takedown in this project and we do not believe the repayment guarantee was triggered by the lenders’ filing of the involuntary bankruptcy (JP Morgan Chase Bank, N.A. v. South Edge, LLC (Case No. 10-32968-bam)). As a result, on August 19, 2011, we filed a lawsuit against JP Morgan Chase Bank, NA (“JP Morgan”) in the Court of Common Pleas in Franklin County, Ohio (Case No. 11CVH0810353) regarding the repayment guarantee. In reaction to that lawsuit, on August 25, 2011, JP Morgan filed a lawsuit against us in the US District Court of Nevada regarding most of the same issues addressed in the Ohio litigation (Case No. 2: 11-CV-01364-PMP). On October 26, 2011, the Bankruptcy Court approved a plan pursuant to which the lenders have received all payment they are entitled to. The project has been conveyed to an entity owned by four of the co-venturers in the South Edge entity (KB Home, Toll Brothers, Pardee Homes and Beazer Homes) and pursuant to which the four co-venturer builders claim to have succeeded to the lenders’ repayment guarantee claim against Meritage.
In a separate lawsuit related to this venture, all members of the joint venture participated in an arbitration regarding their respective performance obligations in response to one of the members’ claims (the “Focus Lawsuit”). On July 6, 2010, the arbitration decision was issued, which denied the specific performance claim, but did award approximately $37 million of damages to one member on other claims. The parties involved jointly appealed the arbitration panel’s decision (we have also appealed on independent grounds) to the United States Courts of Appeal for the Ninth Circuit, Focus South Group, LLC, et al. v. KB HOME Nevada Inc, et al. (Case No. 10-17562). We separately appealed this ruling because we believe the arbitration panel did not have the authority to award damages against us as the ruling included a specific finding that the action of the other builder members to defer takedowns (over our objection and our contrary vote), was wrongful and was the cause of the damages at issue. In connection with the bankruptcy proceedings, the four co-venturer builders settled with Focus and have taken an assignment of Focus’ arbitration award.
23
As a result of the Bankruptcy Court plan and the related settlements between the four settling builders and the lenders and between the four settling builders and Focus, we anticipate that we will be litigating the repayment guarantee claim against JP Morgan and/or the four settling builders, and we will be litigating the arbitration appeal against the four settling builders.
In connection with these on-going legal proceedings, we have established reserves for amounts that we believe are appropriate for both potential settlements and legal costs. The amount we have reserved is less than the aggregate amount of our guarantees and our pro rata share of the damage claim awarded in the arbitration proceeding that is currently subject to appeal, because it takes into account: (i) defenses we believe we possess, many of which are unique to our position in the venture as the only performing builder venture partner, as well as (ii) claims we may have against our co-venturers and the lenders. Our 3.53% investment in the venture has been previously fully impaired. We do not believe that the ultimate disposition of these matters will have a material adverse affect on our financial condition.
Chinese Drywall Litigation
Owners of 17 Florida homes constructed by us are plaintiffs and have made claims against us in the pending Multi-District Litigation in the United States District Court, New Orleans, Louisiana, based on allegations that their homes contain defective Chinese drywall. We have entered into agreements with 12 of those homeowner plaintiffs, pursuant to which we either have or will repair their homes and be released from property damage liability associated with defective Chinese drywall in those homes. We have also been named as a defendant in an Omnibus Complaint filed on February 7, 2011 in the Multi-District Litigation in which two owners of homes constructed by Meritage in the Houston, Texas area contend their homes contain defective Chinese drywall. Among the approximately seven total homeowner plaintiffs in the Multi-District Litigation with whom we do not yet have a repair work authorization and release, their claims allege a variety of property and personal injury damages and seek legal and equitable relief, medical monitoring and legal fees. The remaining Chinese drywall warranty reserves we have accrued as of December 31, 2011 include costs anticipated to be incurred with the repair of these and other homes affected by defective Chinese drywall.
Item 4. Mine Safety Disclosures
Not applicable.
24
Item 5. Market for Registrant’s Common Equity, Related Stockholder Matters and Issuer Purchases of Equity Securities
Our common stock is listed on the New York Stock Exchange (“NYSE”) under the symbol “MTH”. The high and low sales prices per share of our common stock for the periods indicated, as reported by the NYSE, follow.
| 2011 | 2010 | |||||||||||||||
| Quarter Ended |
High | Low | High | Low | ||||||||||||
| March 31 |
$ | 27.42 | $ | 22.21 | $ | 23.73 | $ | 19.30 | ||||||||
| June 30 |
$ | 26.65 | $ | 20.90 | $ | 25.44 | $ | 16.11 | ||||||||
| September 30 |
$ | 23.91 | $ | 14.50 | $ | 20.25 | $ | 15.19 | ||||||||
| December 31 |
$ | 23.50 | $ | 13.68 | $ | 23.48 | $ | 17.73 | ||||||||
The following Performance Graph and related information shall not be deemed to be “soliciting material” or to be “filed” with the Securities and Exchange Commission, nor shall such information be incorporated by reference into any filing under the Securities Act of 1933 or Securities Exchange Act of 1934, each as amended, except to the extent that we specifically incorporate it by reference into such filing.
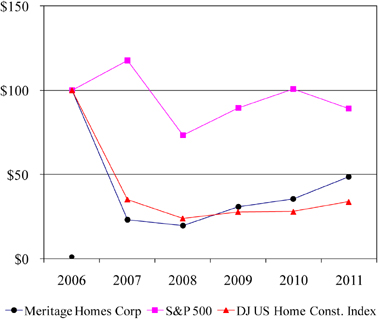
| 2006 | 2007 | 2008 | 2009 | 2010 | 2011 | |||||||||||||||||||
| Meritage Homes Corp |
100.00 | 30.53 | 25.50 | 40.51 | 46.52 | 48.60 | ||||||||||||||||||
| S&P 500 Index |
100.00 | 103.67 | 64.55 | 78.82 | 88.72 | 88.97 | ||||||||||||||||||
| Dow Jones US Home Construction Index |
100.00 | 44.24 | 30.11 | 34.92 | 35.08 | 33.73 | ||||||||||||||||||
The above graph compares the five-year total return of our common stock with the S&P 500 Index and the Dow Jones US Home Construction Index. The graph assumes 100 invested as of December 31, 2006 in Meritage Common Stock the S&P 500 Index and the Dow Jones US Home Construction Index, and the re-investment of all dividends. The performance of our common stock depicted in the graphs is not indicative of future performance.
On February 23, 2012, there were approximately 284 owners of record and approximately 9,600 beneficial owners of common stock.
The transfer agent for our common stock is BNY Mellon Shareowner Services, 480 Washington Blvd, Jersey City, NJ 07310 (www.bnymellon.com/shareowner/equity access).
25
Historically, we have not declared cash dividends, nor do we intend to declare cash dividends in the foreseeable future. We plan to retain our earnings to finance the continuing development of the business. Future cash dividends, if any, will depend upon our financial condition, results of operations, capital requirements, compliance with certain restrictive debt covenants, as well as other factors considered relevant by our Board of Directors. Our senior and senior subordinated note indentures contain restrictions on the payment of cash dividends. See “Management’s Discussion and Analysis of Financial Condition and Results of Operations — Liquidity and Capital Resources” and Note 4 — Senior and Senior Subordinated Notes and Letters of Credit Facilities, in the accompanying consolidated financial statements.
Reference is made to Note 7 in the accompanying consolidated financial statements for a description of our compensation plans.
Issuer Purchases of Equity Securities
We did not acquire any shares of our common stock during the twelve months ended December 31, 2011.
On February 21, 2006, we announced that the Board of Directors approved a stock repurchase program, authorizing the expenditure of up to $100 million to repurchase shares of our common stock. In August 2006, the Board of Directors authorized an additional $100 million under this program. There is no stated expiration date for this program. As of December 31, 2011, we had approximately $130.2 million of the authorized amount available to repurchase shares under this program. We have no plans to purchase additional shares under this program in the foreseeable future.
Executive Officers of the Registrant
The names, ages, positions and business experience of our executive officers are listed below (all ages are as of March 1, 2012). Other than the terms and provisions of various Employment and Change of Control Agreements between the Company and the listed officers, there are no understandings between any of our executive officers and any other person pursuant to which any executive officer was selected to his office.
| Name |
Age | Position | ||
| Steven J. Hilton |
50 | Chairman of the Board and Chief Executive Officer | ||
| Larry W. Seay |
56 | Chief Financial Officer, Executive Vice President | ||
| C. Timothy White |
51 | General Counsel, Executive Vice President and Secretary | ||
| Steven M. Davis |
53 | Chief Operating Officer, Executive Vice President | ||
Steven J. Hilton co-founded Monterey Homes in 1985, which merged with our predecessor in December 1996. Mr. Hilton served as Co-Chairman and CEO from July 1997 to May 2006 and has been the Chairman and Chief Executive Officer since May 2006.
Larry W. Seay has been Chief Financial Officer since December 1996 and was appointed Executive Vice President in October 2005.
C. Timothy White has been General Counsel, Executive Vice President and Secretary since October 2005 and served on our Board of Directors from December 1996 until October 2005.
Steven M. Davis has been Chief Operating Officer, Executive Vice President since December 2008. From October 2006 to December 2008, Mr. Davis was Executive Vice President of National Homebuilding Operations. From 2000 to September 2006, Mr. Davis was employed by KB Home as a Regional General Manager, with various other management roles at KB Home from 1995 to 2000.
Each member of our Executive management team has in excess of 25 years of residential real estate experience.
26
Item 6. Selected Financial Data
The following table presents selected historical consolidated financial and operating data of Meritage Homes Corporation and subsidiaries as of and for each of the last five years ended December 31, 2011. The financial data has been derived from our audited consolidated financial statements and related notes for the periods presented. This table should be read in conjunction with “Management’s Discussion and Analysis of Financial Condition and Results of Operations” and the consolidated financial statements and related notes included elsewhere in this Annual Report. These historical results may not be indicative of future results.
| Historical Consolidated Financial
Data Years Ended December 31, |
||||||||||||||||||||
| ($ in thousands, except per share amounts) | ||||||||||||||||||||
| 2011 | 2010 | 2009 | 2008 | 2007 | ||||||||||||||||
| Statement of Operations Data: |
||||||||||||||||||||
| Total closing revenue |
$ | 861,244 | $ | 941,656 | $ | 970,313 | $ | 1,523,068 | $ | 2,343,594 | ||||||||||
| Total cost of closings |
(704,812 | ) | (767,509 | ) | (840,046 | ) | (1,322,544 | ) | (1,990,190 | ) | ||||||||||
| Impairments |
(15,324 | ) | (6,451 | ) | (126,216 | ) | (237,439 | ) | (340,358 | ) | ||||||||||
|
|
|
|
|
|
|
|
|
|
|
|||||||||||
| Gross profit/(loss) |
141,108 | 167,696 | 4,051 | (36,915 | ) | 13,046 | ||||||||||||||
| Commissions and other sales costs |
(74,912 | ) | (76,798 | ) | (78,683 | ) | (136,860 | ) | (196,464 | ) | ||||||||||
| General and administrative expenses |
(64,184 | ) | (59,784 | ) | (59,461 | ) | (64,793 | ) | (104,745 | ) | ||||||||||
| Goodwill and intangible asset impairments |
0 | 0 | 0 | (1,133 | ) | (130,490 | ) | |||||||||||||
| Earnings/(loss) from unconsolidated entities, net (1) |
5,849 | 5,243 | 4,013 | (17,038 | ) | (40,229 | ) | |||||||||||||
| Interest expense |
(30,399 | ) | (33,722 | ) | (36,531 | ) | (23,653 | ) | (6,745 | ) | ||||||||||
| (Loss)/gain on extinguishment of debt |
0 | (3,454 | ) | 9,390 | 0 | 0 | ||||||||||||||
| Other income, net |
2,162 | 3,303 | 2,422 | 4,426 | 9,145 | |||||||||||||||
|
|
|
|
|
|
|
|
|
|
|
|||||||||||
| (Loss)/earnings before income taxes |
(20,376 | ) | 2,484 | (154,799 | ) | (275,966 | ) | (456,482 | ) | |||||||||||
| (Provision for)/benefit from income taxes |
(730 | ) | 4,666 | 88,343 | (15,969 | ) | 167,631 | |||||||||||||
|
|
|
|
|
|
|
|
|
|
|
|||||||||||
| Net (loss)/earnings |
$ | (21,106 | ) | $ | 7,150 | $ | (66,456 | ) | $ | (291,935 | ) | $ | (288,851 | ) | ||||||
|
|
|
|
|
|
|
|
|
|
|
|||||||||||
| (Loss)/earnings per common share: |
||||||||||||||||||||
| Basic |
$ | (0.65 | ) | $ | 0.22 | $ | (2.12 | ) | $ | (9.95 | ) | $ | (11.01 | ) | ||||||
| Diluted |
$ | (0.65 | ) | $ | 0.22 | $ | (2.12 | ) | $ | (9.95 | ) | $ | (11.01 | ) | ||||||
| Balance Sheet Data (December 31): |
||||||||||||||||||||
| Cash, cash equivalents, investments and securities and restricted cash |
$ | 333,187 | $ | 412,642 | $ | 391,378 | $ | 205,923 | $ | 27,677 | ||||||||||
| Real estate |
$ | 815,425 | $ | 738,928 | $ | 675,037 | $ | 859,305 | $ | 1,267,879 | ||||||||||
| Total assets |
$ | 1,221,378 | $ | 1,224,938 | $ | 1,242,667 | $ | 1,326,249 | $ | 1,748,381 | ||||||||||
| Senior and senior subordinated notes, loans payable and other borrowings |
$ | 606,409 | $ | 605,780 | $ | 605,009 | $ | 628,968 | $ | 729,875 | ||||||||||
| Total liabilities |
$ | 732,466 | $ | 724,943 | $ | 757,242 | $ | 799,043 | $ | 1,018,217 | ||||||||||
| Stockholders’ equity |
$ | 488,912 | $ | 499,995 | $ | 485,425 | $ | 527,206 | $ | 730,164 | ||||||||||
| Cash Flow Data: |
||||||||||||||||||||
| Cash (used in)/provided by: |
||||||||||||||||||||
| Operating activities |
$ | (74,136 | ) | $ | 32,551 | $ | 184,074 | $ | 199,829 | $ | (20,613 | ) | ||||||||
| Investing activities |
$ | 141,182 | $ | (174,515 | ) | $ | (145,419 | ) | $ | (23,263 | ) | $ | (9,677 | ) | ||||||
| Financing activities |
$ | 2,613 | $ | (3,414 | ) | $ | 4,753 | $ | 1,680 | $ | 1,257 | |||||||||
| (1) | Earnings/(loss) from unconsolidated entities in 2011, 2010, 2009, 2008 and 2007 includes $0, $300,000, $2.8 million, $26.0 million and $57.9 million, respectively, of joint venture investment impairments. Refer to Notes 1 and 2 of our consolidated financial statements for more detail. |
27
Item 7. Management’s Discussion and Analysis of Financial Condition and Results of Operations
Overview and Outlook
Industry Conditions
While the economy and homebuilding markets continued to be challenged during 2011, we have recently seen indications that demand for new homes is stabilizing in some of our markets. Therefore, despite above-average foreclosure and unemployment rates, increased interest and traffic in our communities and homes have resulted in improving sales in certain parts of the country. The first half of 2011 was comparatively less successful than the first half of 2010, mostly due to an elevated level of 2010 closings as a result of the federal homebuyer tax credit program, but the second half of 2011 showed comparative improvement, as our sales units increased as well as our average sales prices and backlog year over year. We finished 2011 on a positive note by posting gains in the fourth quarter in many of our key operating metrics and we continued to focus on generating greater profit on each sale while controlling our overhead expense. We believe a full economic and real estate recovery will continue to be an uneven process and will not fully materialize until there is broad, sustainable employment and the consumer confidence returns. We ended 2011 with higher expectations for early 2012 as we enter the new year with higher levels of backlog than last year.
Summary Company Results
Total home closing revenue was $860.9 million for the year ended December 31, 2011, decreasing 8.5% from $940.4 million for 2010 and 10.6% from $962.8 million in 2009. We incurred a net loss for 2011 of $21.1 million compared to net income of $7.2 million in 2010 and a loss of $66.5 million in 2009. Full-year 2010 home closing revenue and net income benefitted from closings that spiked the first half of the year because of the federal homebuyer tax credit program. There was no such benefit in 2011, resulting in difficult year-over-year comparisons. Our 2011 results include $15.3 million of real estate-related impairments. In 2010, results included $6.5 million of real estate-related impairments, $3.5 million loss from early extinguishment of debt, and a $4.7 million tax benefit. In 2009, we incurred $126.2 million of real estate-related impairments, $9.4 million gain from early extinguishment of debt, and had an $88.3 million tax benefit relating to reversal of our deferred tax valuation allowance.
At December 31, 2011, our backlog of $248.9 million was up 23.3% from $201.8 million at December 31, 2010. Our December 31, 2009 backlog was $287.5 million, higher comparatively, largely due to the federal homebuyer tax credit program that translated into higher closing units and dollars in the first half of 2010, as discussed above. Increased home sales per community and a higher active community count in the second half of 2011 were primarily responsible for the increase in ending 2011 backlog over 2010. Our average sales price for homes in backlog increased to $272,000, up 4.9% from $259,400 at December 31, 2010, and up 3.6% from $262,600 at December 31, 2009, primarily due to mix of homes shifting to higher-priced markets, and more sought-after closer-in locations. Our cancellation rate on sales orders as a percentage of gross sales decreased in 2011 to 17.0%, down from 20.9% and 24.3%, respectively, for the years ended December 31, 2010 and 2009. We believe the combination of these positive factors reflect some stabilization of home prices and consumer confidence during the second half of the year and as we enter 2012.
Company Actions and Positioning
Throughout this continued difficult homebuilding market, we have remained focused on our main goals: return to and maintain profitability, and strengthen our balance sheet. In order to meet these goals, over the past several years we began and continue to execute on the following initiatives:
| • | Utilizing our enhanced market research to capitalize on the knowledge of our buyers’ demands in each community, tailoring our pricing, product and amenities offered; |
| • | Continuing to innovate and promote the Meritage Green energy efficiency program, so that every new home we construct, at a minimum, meets current ENERGY STAR® standards, including the construction of our first net-zero production home that produces as much energy as it uses annually; |
| • | Managing our total lot supply and future growth of our communities by actively contracting new well-priced lots in better-located submarkets; |
| • | Adapting sales and marketing efforts to generate additional traffic and compete with resale homes including a marketing call center as a resource for our buyers; |
28
| • | Renegotiating construction costs with our subcontractors where possible; |
| • | Exercising tight control over cash flows; |
| • | Monitoring our customer satisfaction scores and working toward improving them based on the results of the surveys; |
| • | Executing our company-wide operating strategy, Meritage Forward, and the roll-out of associated initiatives such as the Simply Smart SeriesTM and 99-day closing guarantee; and |
| • | Maintaining consolidated overhead functions at all of our divisions and corporate offices to hold down general and administrative cost burden. |
Additionally, we are evaluating opportunities for expansion into new markets that have been less impacted by the homebuilding downturn over the past several years. We are looking to redeploy our capital into projects both within our geographic footprint and through entry into new markets. To that end, in April 2011 we announced our entry into the Raleigh-Durham, North Carolina market and in December 2011 announced our entry into the Tampa, Florida market.
We believe that the investments in our new communities, markets and product offerings create a differentiated strategy that has lessened the impact of the current economic conditions and improved our operating leverage. Throughout 2011, we opened 78 new communities while closing out 72 communities, ending the year with 157 active communities. We continue to believe in the long-term viability of the domestic homebuilding market and that builders with in-depth industry expertise, successful business and operational models and well-priced land positions will benefit when the housing market recovers.
In a response to our strategy to take advantage of capital-raising opportunities we have completed the following transactions:
| • | During 2010, we completed an offering of $200 million aggregate principal amount of 7.15% senior notes due 2020. The notes were issued at 97.567% of par value to yield 7.50%. Concurrent with the issuance of the 2020 notes, we purchased all of our $130 million 7.0% senior notes maturing 2014 and $65 million of our 6.25% senior notes maturing 2015. In connection with these transactions, we recorded a $3.5 million loss on early extinguishment of debt, which is reflected in our statement of operations for the year ended December 31, 2010. This transaction pushed out our earliest maturity from 2014 to 2015 and reduced our 2015 maturity by $65 million. |
| • | During 2009 we retired $24.1 million of our 7.731% senior subordinated notes maturing in 2017 by issuing approximately 783,000 shares of our common stock in privately negotiated transactions at a 41% average discount from the face value of the notes, resulting in a $9.4 million gain on early extinguishment of debt for the year ended December 31, 2009. |
We continue to closely monitor capital markets and our liquidity and will undertake additional transactions if and when we deem most prudent.
Critical Accounting Policies
We have established various accounting policies that govern the application of United States generally accepted accounting principles (“GAAP”) in the preparation and presentation of our consolidated financial statements. Our significant accounting policies are described in Note 1 of the consolidated financial statements included in this Form 10-K. Certain of these policies involve significant judgments, assumptions and estimates by management that may have a material impact on the carrying value of certain assets and liabilities, and revenue and costs. We are subject to uncertainties such as the impact of future events, economic, environmental and political factors and changes in our business environment; therefore, actual results could differ from these estimates. Accordingly, the accounting estimates used in the preparation of our financial statements will change as new events occur, as more experience is acquired, as additional information is obtained and as our operating environment changes. Changes in estimates are revised when circumstances warrant. Such changes in estimates and refinements in methodologies are reflected in our reported results of operations and, if material, the effects of changes in estimates are disclosed in the notes to our consolidated financial statements. The judgments, assumptions and estimates we use and believe to be critical to our business are based on historical experience, knowledge of the accounts and other factors, which we believe to be reasonable under the circumstances. Because of the nature of the judgments and assumptions we have made, actual results may differ from these judgments and estimates and could have a material impact on the carrying values of assets and liabilities and the results of our operations.
29
The accounting policies that we deem most critical to us and involve the most difficult, subjective or complex judgments are as follows:
Revenue Recognition
We recognize revenue from a home sale when title passes to the homeowner, the homeowner’s initial and continuing investment is adequate to demonstrate a commitment to pay for the home, the receivable, if any, from the homeowner is not subject to future subordination and we do not have a substantial continuing involvement with the sold home. These conditions are typically achieved when a home closes.
Revenue from land sales is recognized when a significant down payment is received, the earnings process is relatively complete, title passes and collectability of the receivable is reasonably assured. Although there is limited subjectivity in this accounting policy, we have designated revenue recognition as a critical accounting policy due to the significance of this balance in our statements of operations.
Real Estate
Real estate is stated at cost unless the community or land is determined to be impaired, at which point the inventory is written down to fair value as required by Financial Accounting Standards Board (“FASB”) Accounting Standards Codification (“ASC”) 360-10, Property, Plant and Equipment. Inventory includes the costs of land acquisition, land development and home construction, capitalized interest, real estate taxes, direct overhead costs incurred during development and home construction that benefit the entire community, less impairments, if any. Land and development costs are typically allocated and transferred to homes under construction when home construction begins. Home construction costs are accumulated on a per-home basis. Cost of home closings includes the specific construction costs of the home and all related allocated land acquisition, land development and other common costs (both incurred and estimated to be incurred) based upon the total number of homes expected to be closed in each community or phase. Any changes to the estimated total development costs of a community or phase are allocated to the remaining homes in the community or phase. When a home closes, we may have incurred costs for goods and services that have not yet been paid. Therefore, an accrual to capture such obligations is recorded in connection with the home closing and charged directly to cost of sales.
Typically, an entitled community’s life cycle ranges from three to five years, commencing with the acquisition of the land, continuing through the land development phase and concluding with the sale, construction and closing of the homes. Actual community lives will vary based on the size of the community, the absorption rates and whether the land purchased was raw land or finished lots. Master-planned communities encompassing several phases and super-block land parcels may have significantly longer lives and projects involving smaller finished lot purchases may be significantly shorter. Additionally, the current slow-down in the housing market has negatively impacted our sales pace, thereby extending the lives of certain communities.
All of our land inventory and related real estate assets are reviewed for recoverability at least quarterly, or more frequently if impairment indicators are present, as our inventory is considered “long-lived” in accordance with U.S. generally accepted accounting principles (“GAAP”). If an asset is deemed not recoverable, we record an impairment charge to the extent the fair value of such assets is less than their carrying amounts. Our determination of fair value is based on projections and estimates. Changes in these expectations may lead to a change in the outcome of our impairment analysis and actual results may also differ from our assumptions. Our analysis is completed at a community level with each community or land parcel evaluated individually. We pay particular attention to communities experiencing a larger-than-anticipated reduction in their absorption rates or averages sales prices or where gross margins are trending lower than anticipated. For those assets deemed to be impaired, the impairment to be recognized is measured by the amount by which the assets’ carrying balance exceeds their fair value. The impairment of a community is allocated to each lot on a straight-line basis.
Existing and continuing communities. When projections for the remaining income expected to be earned from existing communities are no longer positive, the underlying real estate assets are not deemed fully recoverable, and further analysis is performed to determine the required impairment. The fair value of the community’s assets is determined using either a discounted cash flow model for projects we intend to build out or a market-based approach for projects to be sold. If our assets are not deemed fully recoverable, impairments are charged to cost of home closings in the period during which it is determined that the fair value is less than the assets’ carrying amount. If a market-based approach is used, we determine fair value based on recent comparable purchase and sale activity in the local market, adjusted for known variances as determined by our knowledge of the region and general real estate expertise. If a discounted cash flow approach is used, we compute fair value based on a proprietary model. Our key estimates in deriving fair value under our cash flow model are (i) home selling prices in the community
30
adjusted for current and expected sales discounts and incentives, (ii) costs related to the community — both land development and home construction — including costs spent to date and budgeted remaining costs to spend, (iii) projected sales absorption rates, reflecting any product mix change strategies implemented to stimulate the sales pace and expected cancellation rates, (iv) alternative land uses including disposition of all or a portion of the land owned and (v) our discount rate, which is currently 14-16% and varies based on the perceived risk inherent in the community’s other cash flow assumptions. These assumptions vary widely across different communities and geographies and are largely dependent on local market conditions. Community-level factors that may impact our key estimates include:
| • | The presence and significance of local competitors, including their offered product type and competitive actions; |
| • | Economic and related demographic conditions for the population of the surrounding community; |
| • | Desirability of the particular community, including unique amenities or other favorable or unfavorable attributes; and |
| • | Existing home inventory supplies, including foreclosures and short sales. |
These local circumstances may significantly impact our assumptions and the resulting computation of fair value, and are, therefore, closely evaluated by our division personnel in their creation of the discounted cash flow models. The models are also evaluated by regional and corporate personnel for consistency and integration, as decisions that affect pricing or absorption at one community may have resulting consequences for neighboring communities. We typically do not project market improvements in our discounted cash flow models, but may do so in limited circumstances in the latter years of a long-lived community. In certain cases, we may elect to stop development and/or marketing of an existing community (mothball) if we believe the economic performance of the community would be maximized by deferring development for a period of time to allow market conditions to improve. The decision may be based on financial and/or operational metrics. If we decide to mothball a project and its carrying value is not deemed recoverable, we will impair it to its fair value as discussed above and then cease future development activity until such a time where management believes that market conditions will improve and economic performance will be maximized. No costs are capitalized to communities that are designated as mothball. Quarterly, we review all communities, including mothballed communities, for potential impairments.
For our land held for future development and our mothballed communities, our inventory assessments typically include significant estimates regarding future performance, including the timing of development, the product to be offered, sales rates and selling prices of the product when the community is anticipated to open for sales, and the projected costs to develop and construct the community. We evaluate various factors to develop our forecasts, including the availability of and demand for homes and finished lots within the marketplace, historical, current and future sales trends, and other third-party data, if available. Based on these factors, we reach conclusions for future performance based on our judgment.
Option deposits and pre-acquisition costs: We also evaluate assets associated with future communities for impairments on a quarterly basis. Using similar techniques described in the existing and continuing communities section above, we determine if the income to be generated by our future communities are acceptable to us. If the projections indicate that a community is still meeting our internal investment guidelines and is generating a profit, those assets are determined to be fully recoverable and no impairments are required. In cases where we decide to abandon the project, we will fully impair all assets related to such project and will expense and accrue any additional costs that we are contractually obligated to incur. In certain circumstances, we may also elect to continue with a project because it is expected to generate positive future cash flows, even though it may not be generating an accounting profit, or because of other strategic factors. In such cases, we will impair our pre-acquisition costs and deposits, as necessary, to record an impairment to bring the book value to fair value.
Due to the complexity and subjectivity of these fair value computations, as well as the significance of associated impairments to our financial statements for the past several years, we have concluded that the valuation of our real-estate and associated assets is a critical accounting policy.
During 2011, we recorded $12.6 million of such impairment charges related to our home and land inventories. Additionally, we wrote off approximately $2.8 million of deposits and pre-acquisition costs relating to projects that were no longer economically feasible. Refer to Note 2 of these consolidated financial statements in this Annual Report on Form 10-K for further discussion regarding these impairments and the associated remaining fair values of impaired communities.
The impairment charges were based on our fair value calculations, which are affected by current market conditions, assumptions and expectations, all of which are highly subjective and may differ significantly from actual results if market conditions change.
31
Due to the volume of possible outcomes that can be generated from changes in the various model inputs for each community, we do not believe it is possible to create a sensitivity analysis that can provide meaningful information for the users of our financial statements.
Warranty Reserves
We use subcontractors for nearly all aspects of home construction. Although our subcontractors are generally required to repair and replace any product or labor defects, we are, during applicable warranty periods, ultimately responsible to the homeowner for making such repairs. As such, warranty reserves are recorded to cover our exposure to absorb the costs for materials and labor not expected to be covered by our subcontractors to the extent they relate to warranty-type claims subsequent to the delivery of a home to the homeowner. Reserves are reviewed on a regular basis and, with the assistance of an actuary for the structural related warranty, we determine their sufficiency based on our and industry-wide historical data and trends. These reserves are subject to variability due to uncertainties regarding structural defect claims for the products we build, the markets in which we build, claim settlement history, insurance and legal interpretations, among other factors.
At December 31, 2011, our warranty reserve was $23.1 million, reflecting an accrual of 0.2% to 0.7% of a home’s sale price depending on our loss history in the geographic area in which the home was built. A 10% increase in our warranty reserve rate would have increased our accrual and corresponding cost of sales by approximately $669,000 in 2011. We recorded a $2.6 million favorable adjustment to our reserve in 2011 based on historical trends of actual claims paid and our success in recovery of expended amounts. While we believe that the warranty reserve is sufficient to cover our projected costs, there can be no assurances that historical data and trends will accurately predict our actual warranty costs. Furthermore, there can be no assurances that future economic or financial developments might not lead to a significant change in the reserve.
Off-Balance Sheet Arrangements
Historically, we have invested in entities that acquire and develop land for sale to us in connection with our homebuilding operations or for sale to third parties. Our partners generally are unaffiliated homebuilders, land sellers and financial or other strategic partners. We currently are a member of only two such active land joint ventures. All entities through which we acquire and develop land are accounted for by either the cost or the equity method of accounting where the criteria for consolidation have not been met as set forth in ASC 810-10, Consolidation (“ASC 810-10”). We record our investments in these entities in our consolidated balance sheets as “Investments in unconsolidated entities” and our pro rata share of the entities’ earnings or losses in our consolidated statements of earnings as “Earnings/(loss) from unconsolidated entities, net.”
In order to determine if we should consolidate equity-basis joint ventures, we determine if the ventures are VIEs and if we are the primary beneficiary of the unconsolidated entity. Factors considered in our determination include our ability to control the activities of the entity that most significantly impact its economic performance, and in cases where we do control such activities, if we also are expected to absorb the majority of the expected losses or expected gains of the entity. For those entities where we are deemed the primary beneficiary, we consolidate the investment in our financial statements in accordance with ASC 810-10.
We enter into option or purchase agreements to acquire land or lots, for which we generally pay non-refundable deposits. We also analyze these agreements under ASC 810-10 to determine whether we are the primary beneficiary of the variable interest entity (“VIE”), if applicable, using a similar analysis, as noted above. If we are deemed to be the primary beneficiary of the VIE, we will consolidate the VIE in our consolidated financial statements. See Note 3 in the accompanying financial statements for additional information related to our off-balance-sheet arrangements. In cases where we are the primary beneficiary, even though we do not have title to such land, we are required to consolidate these purchase/option agreements and reflect such assets and liabilities as “Real estate not owned” in our consolidated balance sheets. The liabilities related to consolidated VIEs are excluded from our debt covenant calculations.
Valuation of Deferred Tax Assets
We account for income taxes using the asset and liability method, which requires that deferred tax assets and liabilities be recognized based on future tax consequences of both temporary differences between the financial statement carrying amounts of existing assets and liabilities and their respective tax bases. Deferred tax assets and liabilities are measured using enacted tax rates expected to apply in the years in which the temporary differences are expected to be recovered or settled. The effect on deferred tax assets and liabilities of a change in tax rates is recognized in earnings in the period when the changes are enacted.
32
In accordance with ASC 740-10, Income Taxes, we evaluate our deferred tax assets, including the benefit from NOLs, to determine if a valuation allowance is required. Companies must assess, using significant judgments, whether a valuation allowance should be established based on the consideration of all available evidence using a “more likely than not” standard with significant weight being given to evidence that can be objectively verified. This assessment considers, among other matters, the nature, frequency and severity of current and cumulative losses, forecasts of future profitability, the length of statutory carryforward periods, our experience with operating losses and our experience of utilizing tax credit carryforwards and tax planning alternatives. Based upon a review of all available evidence, we recorded a full valuation allowance against our deferred tax assets during 2008. We continue to maintain a full non-cash valuation allowance against the entire amount of our remaining net deferred tax assets at December 31, 2011 as we have determined that the weight of the negative evidence exceeds that of the positive evidence and it continues to be more likely than not that we will not be able to utilize all of our deferred tax assets and NOL carryovers.
At December 31, 2011 and 2010, we had a valuation allowance of $94.1 million ($70.2 million federal and $23.9 million state) and $90.0 million ($63.4 million federal and $26.6 million state), respectively, against deferred tax assets which include the tax benefit from NOL carryovers. Our future deferred tax asset realization depends on sufficient taxable income in the carryforward periods under existing tax laws. Federal net operating loss carryforwards may be used to offset future taxable income for 20 years and expire in 2030. State net operating loss carryforwards may be used to offset future taxable income for a period of time ranging from 5 to 20 years, depending on the state, and begin to expire in 2012. Deferred tax assets include tax-effected federal and state net operating loss carryforwards of $32.1 million and $25.6 million in 2011 and 2010, respectively. On an ongoing basis, we will continue to review all available evidence to determine if and when we expect to realize our deferred tax assets and NOL carryovers.
Share-Based Payments
We have stock options and restricted common stock units (“nonvested shares”) outstanding under our stock compensation plan. Per the terms of the plan, the exercise price of our stock options may not be less than the closing market value of our common stock on the date of grant, nor may options granted under the plans be exercised within one year from the date of the grant. After one year, exercises are permitted in pre-determined installments based upon a vesting schedule established at the time of grant. Each stock option expires on a date determined at the time of the grant, but not to exceed seven years from the date of the grant. Our restricted stock generally vests on a pro-rata basis over either three or five years.
The calculation of employee compensation expense involves estimates that require management judgments. These estimates include determining the value of each of our stock options on the date of grant using a Black-Scholes option-pricing model discussed in Note 7 in the accompanying consolidated financial statements. The fair value of our stock options, which typically vest ratably over a five-year period, is determined at the time of grant and is expensed on a straight-line basis over the vesting life of the options. Expected volatility is based on a composite of historical volatility of our stock and implied volatility from our traded options. The risk-free rate for periods within the contractual life of the stock option award is based on the rate of a zero-coupon Treasury bond on the date the stock option is granted with a maturity equal to the expected term of the stock option. We use historical data to estimate stock option exercises and forfeitures within our valuation model. The expected life of our stock option awards is derived from historical experience under our share-based payment plans and represents the period of time that we expect our stock options to be outstanding. A 10% decrease in our forfeiture rate would have increased our stock compensation by approximately $329,000 in 2011.
33
Home Closing Revenue, Home Orders and Order Backlog — Segment Analysis
The tables provided below show operating and financial data regarding our homebuilding activities (dollars in thousands).
| Years Ended December 31, | Year Over Year | |||||||||||||||
| 2011 | 2010 | Chg $ | Chg % | |||||||||||||
| Home Closing Revenue |
||||||||||||||||
| Total |
||||||||||||||||
| Dollars |
$ | 860,884 | $ | 940,406 | $ | (79,522 | ) | (8.5 | )% | |||||||
| Homes closed |
3,268 | 3,700 | (432 | ) | (11.7 | )% | ||||||||||
| Average sales price |
$ | 263.4 | $ | 254.2 | $ | 9.2 | 3.6 | % | ||||||||
| West Region |
||||||||||||||||
| California |
||||||||||||||||
| Dollars |
$ | 120,319 | $ | 147,194 | $ | (26,875 | ) | (18.3 | )% | |||||||
| Homes closed |
355 | 417 | (62 | ) | (14.9 | )% | ||||||||||
| Average sales price |
$ | 338.9 | $ | 353.0 | $ | (14.1 | ) | (4.0 | )% | |||||||
| Nevada |
||||||||||||||||
| Dollars |
$ | 12,593 | $ | 16,006 | $ | (3,413 | ) | (21.3 | )% | |||||||
| Homes closed |
59 | 81 | (22 | ) | (27.2 | )% | ||||||||||
| Average sales price |
$ | 213.4 | $ | 197.6 | $ | 15.8 | 8.0 | % | ||||||||
| West Region Totals |
||||||||||||||||
| Dollars |
$ | 132,912 | $ | 163,200 | $ | (30,288 | ) | (18.6 | )% | |||||||
| Homes closed |
414 | 498 | (84 | ) | (16.9 | )% | ||||||||||
| Average sales price |
$ | 321.0 | $ | 327.7 | $ | (6.7 | ) | (2.0 | )% | |||||||
| Central Region |
||||||||||||||||
| Arizona |
||||||||||||||||
| Dollars |
$ | 150,258 | $ | 156,117 | $ | (5,859 | ) | (3.8 | )% | |||||||
| Homes closed |
594 | 700 | (106 | ) | (15.1 | )% | ||||||||||
| Average sales price |
$ | 253.0 | $ | 223.0 | $ | 30.0 | 13.5 | % | ||||||||
| Texas |
||||||||||||||||
| Dollars |
$ | 395,278 | $ | 487,797 | $ | (92,519 | ) | (19.0 | )% | |||||||
| Homes closed |
1,660 | 2,028 | (368 | ) | (18.1 | )% | ||||||||||
| Average sales price |
$ | 238.1 | $ | 240.5 | $ | (2.4 | ) | (1.0 | )% | |||||||
| Colorado |
||||||||||||||||
| Dollars |
$ | 83,095 | $ | 48,820 | $ | 34,275 | 70.2 | % | ||||||||
| Homes closed |
258 | 162 | 96 | 59.3 | % | |||||||||||
| Average sales price |
$ | 322.1 | $ | 301.4 | $ | 20.7 | 6.9 | % | ||||||||
| Central Region Totals |
||||||||||||||||
| Dollars |
$ | 628,631 | $ | 692,734 | $ | (64,103 | ) | (9.3 | )% | |||||||
| Homes closed |
2,512 | 2,890 | (378 | ) | (13.1 | )% | ||||||||||
| Average sales price |
$ | 250.3 | $ | 239.7 | $ | 10.6 | 4.4 | % | ||||||||
| East Region |
||||||||||||||||
| North Carolina |
||||||||||||||||
| Dollars |
N/A | N/A | N/A | N/A | ||||||||||||
| Homes closed |
N/A | N/A | N/A | N/A | ||||||||||||
| Average sales price |
N/A | N/A | N/A | N/A | ||||||||||||
| Florida |
||||||||||||||||
| Dollars |
$ | 99,341 | $ | 84,472 | $ | 14,869 | 17.6 | % | ||||||||
| Homes closed |
342 | 312 | 30 | 9.6 | % | |||||||||||
| Average sales price |
$ | 290.5 | $ | 270.7 | $ | 19.8 | 7.3 | % | ||||||||
| East Region Totals |
||||||||||||||||
| Dollars |
$ | 99,341 | $ | 84,472 | $ | 14,869 | 17.6 | % | ||||||||
| Homes closed |
342 | 312 | 30 | 9.6 | % | |||||||||||
| Average sales price |
$ | 290.5 | $ | 270.7 | $ | 19.8 | 7.3 | % | ||||||||
34
| Years Ended December 31, | Year Over Year | |||||||||||||||
| 2010 | 2009 | Chg $ | Chg % | |||||||||||||
| Home Closing Revenue |
||||||||||||||||
| Total |
||||||||||||||||
| Dollars |
$ | 940,406 | $ | 962,797 | $ | (22,391 | ) | (2.3 | )% | |||||||
| Homes closed |
3,700 | 4,039 | (339 | ) | (8.4 | )% | ||||||||||
| Average sales price |
$ | 254.2 | $ | 238.4 | $ | 15.8 | 6.6 | % | ||||||||
| West Region |
||||||||||||||||
| California |
||||||||||||||||
| Dollars |
$ | 147,194 | $ | 116,197 | $ | 30,997 | 26.7 | % | ||||||||
| Homes closed |
417 | 348 | 69 | 19.8 | % | |||||||||||
| Average sales price |
$ | 353.0 | $ | 333.9 | 19.1 | 5.7 | % | |||||||||
| Nevada |
||||||||||||||||
| Dollars |
$ | 16,006 | $ | 27,049 | $ | (11,043 | ) | (40.8 | )% | |||||||
| Homes closed |
81 | 130 | (49 | ) | (37.7 | )% | ||||||||||
| Average sales price |
$ | 197.6 | $ | 208.1 | $ | (10.5 | ) | (5.0 | )% | |||||||
| West Region Totals |
||||||||||||||||
| Dollars |
$ | 163,200 | $ | 143,246 | $ | 19,954 | 13.9 | % | ||||||||
| Homes closed |
498 | 478 | 20 | 4.2 | % | |||||||||||
| Average sales price |
$ | 327.7 | $ | 299.7 | $ | 28.0 | 9.3 | % | ||||||||
| Central Region |
||||||||||||||||
| Arizona |
||||||||||||||||
| Dollars |
$ | 156,117 | $ | 156,107 | $ | 10 | 0.0 | % | ||||||||
| Homes closed |
700 | 781 | (81 | ) | (10.4 | )% | ||||||||||
| Average sales price |
$ | 223.0 | $ | 199.9 | $ | 23.1 | 11.6 | % | ||||||||
| Texas |
||||||||||||||||
| Dollars |
$ | 487,797 | $ | 566,879 | $ | (79,082 | ) | (14.0 | )% | |||||||
| Homes closed |
2,028 | 2,405 | (377 | ) | (15.7 | )% | ||||||||||
| Average sales price |
$ | 240.5 | $ | 235.7 | $ | 4.8 | 2.0 | % | ||||||||
| Colorado |
||||||||||||||||
| Dollars |
$ | 48,820 | $ | 44,225 | $ | 4,595 | 10.4 | % | ||||||||
| Homes closed |
162 | 145 | 17 | 11.7 | % | |||||||||||
| Average sales price |
$ | 301.4 | $ | 305.0 | $ | (3.6 | ) | (1.2 | )% | |||||||
| Central Region Totals |
||||||||||||||||
| Dollars |
$ | 692,734 | $ | 767,211 | $ | (74,477 | ) | (9.7 | )% | |||||||
| Homes closed |
2,890 | 3,331 | (441 | ) | (13.2 | )% | ||||||||||
| Average sales price |
$ | 239.7 | $ | 230.3 | $ | 9.4 | 4.1 | % | ||||||||
| East Region |
||||||||||||||||
| Florida Dollars |
$ | 84,472 | $ | 52,340 | $ | 32,132 | 61.4 | % | ||||||||
| Homes closed |
312 | 230 | 82 | 35.7 | % | |||||||||||
| Average sales price |
$ | 270.7 | $ | 227.6 | $ | 43.1 | 18.9 | % | ||||||||
35
| Years Ended December 31, | Year Over Year | |||||||||||||||
| 2011 | 2010 | Chg $ | Chg % | |||||||||||||
| Home Orders (1) |
||||||||||||||||
| Total |
||||||||||||||||
| Dollars |
$ | 907,922 | $ | 854,687 | $ | 53,235 | 6.2 | % | ||||||||
| Homes ordered |
3,405 | 3,383 | 22 | 0.7 | % | |||||||||||
| Average sales price |
$ | 266.6 | $ | 252.6 | $ | 14.0 | 5.5 | % | ||||||||
| West Region |
||||||||||||||||
| California |
||||||||||||||||
| Dollars |
$ | 132,672 | $ | 128,167 | $ | 4,505 | 3.5 | % | ||||||||
| Homes ordered |
392 | 373 | 19 | 5.1 | % | |||||||||||
| Average sales price |
$ | 338.4 | $ | 343.6 | $ | (5.2 | ) | (1.5 | )% | |||||||
| Nevada |
||||||||||||||||
| Dollars |
$ | 11,300 | $ | 15,704 | $ | (4,404 | ) | (28.0 | )% | |||||||
| Homes ordered |
52 | 79 | (27 | ) | (34.2 | )% | ||||||||||
| Average sales price |
$ | 217.3 | $ | 198.8 | $ | 18.5 | 9.3 | % | ||||||||
| West Region Totals |
||||||||||||||||
| Dollars |
$ | 143,972 | $ | 143,871 | $ | 101 | 0.1 | % | ||||||||
| Homes ordered |
444 | 452 | (8 | ) | (1.8 | )% | ||||||||||
| Average sales price |
$ | 324.3 | $ | 318.3 | $ | 6.0 | 1.9 | % | ||||||||
| Central Region |
||||||||||||||||
| Arizona |
||||||||||||||||
| Dollars |
$ | 163,510 | $ | 155,987 | $ | 7,523 | 4.8 | % | ||||||||
| Homes ordered |
627 | 678 | (51 | ) | (7.5 | )% | ||||||||||
| Average sales price |
$ | 260.8 | $ | 230.1 | $ | 30.7 | 13.3 | % | ||||||||
| Texas |
||||||||||||||||
| Dollars |
$ | 377,165 | $ | 417,840 | $ | (40,675 | ) | (9.7 | )% | |||||||
| Homes ordered |
1,593 | 1,776 | (183 | ) | (10.3 | )% | ||||||||||
| Average sales price |
$ | 236.8 | $ | 235.3 | $ | 1.5 | 0.6 | % | ||||||||
| Colorado |
||||||||||||||||
| Dollars |
$ | 89,624 | $ | 54,328 | $ | 35,296 | 65.0 | % | ||||||||
| Homes ordered |
276 | 175 | 101 | 57.7 | % | |||||||||||
| Average sales price |
$ | 324.7 | $ | 310.4 | $ | 14.3 | 4.6 | % | ||||||||
| Central Region Totals |
||||||||||||||||
| Dollars |
$ | 630,299 | $ | 628,155 | $ | 2,144 | 0.3 | % | ||||||||
| Homes ordered |
2,496 | 2,629 | (133 | ) | (5.1 | )% | ||||||||||
| Average sales price |
$ | 252.5 | $ | 238.9 | $ | 13.6 | 5.7 | % | ||||||||
| East Region |
||||||||||||||||
| North Carolina |
||||||||||||||||
| Dollars |
$ | 8,616 | $ | N/A | $ | 8,616 | N/M | |||||||||
| Homes ordered |
24 | N/A | 24 | N/M | ||||||||||||
| Average sales price |
$ | 359.0 | $ | N/A | $ | 359.0 | N/M | |||||||||
| Florida |
||||||||||||||||
| Dollars |
$ | 125,035 | $ | 82,661 | $ | 42,374 | 51.3 | % | ||||||||
| Homes ordered |
441 | 302 | 139 | 46.0 | % | |||||||||||
| Average sales price |
$ | 283.5 | $ | 273.7 | $ | 9.8 | 3.6 | % | ||||||||
| East Region Totals |
||||||||||||||||
| Dollars |
$ | 133,651 | $ | 82,661 | $ | 50,990 | 61.7 | % | ||||||||
| Homes ordered |
465 | 302 | 163 | 54.0 | % | |||||||||||
| Average sales price |
$ | 287.4 | $ | 273.7 | $ | 13.7 | 5.0 | % | ||||||||
| (1) | Home orders for any period represent the aggregate sales price of all homes ordered, net of cancellations. We do not include orders contingent upon the sale of a customer’s existing home as a sales contract until the contingency is removed. |
N/M – Not Meaningful
36
| Years Ended December 31, | Year Over Year | |||||||||||||||
| 2010 | 2009 | Chg $ | Chg % | |||||||||||||
| Home Orders (1) |
||||||||||||||||
| Total |
||||||||||||||||
| Dollars |
$ | 854,687 | $ | 912,301 | $ | (57,614 | ) | (6.3 | )% | |||||||
| Homes ordered |
3,383 | 3,853 | (470 | ) | (12.2 | )% | ||||||||||
| Average sales price |
$ | 252.6 | $ | 236.8 | $ | 15.8 | 6.7 | % | ||||||||
| West Region |
||||||||||||||||
| California Dollars |
$ | 128,167 | $ | 116,609 | $ | 11,558 | 9.9 | % | ||||||||
| Homes ordered |
373 | 350 | 23 | 6.6 | % | |||||||||||
| Average sales price |
$ | 343.6 | $ | 333.2 | $ | 10.4 | 3.1 | % | ||||||||
| Nevada |
||||||||||||||||
| Dollars |
$ | 15,704 | $ | 23,267 | $ | (7,563 | ) | (32.5 | )% | |||||||
| Homes ordered |
79 | 119 | (40 | ) | (33.6 | )% | ||||||||||
| Average sales price |
$ | 198.8 | $ | 195.5 | $ | 3.3 | 1.7 | % | ||||||||
| West Region Totals |
||||||||||||||||
| Dollars |
$ | 143,871 | $ | 139,876 | $ | 3,995 | 2.9 | % | ||||||||
| Homes ordered |
452 | 469 | (17 | ) | (3.6 | )% | ||||||||||
| Average sales price |
$ | 318.3 | $ | 298.2 | $ | 20.1 | 6.7 | % | ||||||||
| Central Region |
||||||||||||||||
| Arizona |
||||||||||||||||
| Dollars |
$ | 155,987 | $ | 146,006 | $ | 9,981 | 6.8 | % | ||||||||
| Homes ordered |
678 | 738 | (60 | ) | (8.1 | )% | ||||||||||
| Average sales price |
$ | 230.1 | $ | 197.8 | $ | 32.3 | 16.3 | % | ||||||||
| Texas |
||||||||||||||||
| Dollars |
$ | 417,840 | $ | 518,288 | $ | (100,448 | ) | (19.4 | )% | |||||||
| Homes ordered |
1,776 | 2,233 | (457 | ) | (20.5 | )% | ||||||||||
| Average sales price |
$ | 235.3 | $ | 232.1 | $ | 3.2 | 1.4 | % | ||||||||
| Colorado |
||||||||||||||||
| Dollars |
$ | 54,328 | $ | 42,416 | $ | 11,912 | 28.1 | % | ||||||||
| Homes ordered |
175 | 140 | 35 | 25.0 | % | |||||||||||
| Average sales price |
$ | 310.4 | $ | 303.0 | $ | 7.4 | 2.4 | % | ||||||||
| Central Region Totals |
||||||||||||||||
| Dollars |
$ | 628,155 | $ | 706,710 | $ | (78,555 | ) | (11.1 | )% | |||||||
| Homes ordered |
2,629 | 3,111 | (482 | ) | (15.5 | )% | ||||||||||
| Average sales price |
$ | 238.9 | $ | 227.2 | $ | 11.7 | 5.1 | % | ||||||||
| East Region |
||||||||||||||||
| Florida |
||||||||||||||||
| Dollars |
$ | 82,661 | $ | 65,715 | $ | 16,946 | 25.8 | % | ||||||||
| Homes ordered |
302 | 273 | 29 | 10.6 | % | |||||||||||
| Average sales price |
$ | 273.7 | $ | 240.7 | $ | 33.0 | 13.7 | % | ||||||||
| (1) | Home orders for any period represent the aggregate sales price of all homes ordered, net of cancellations. We do not include orders contingent upon the sale of a customer’s existing home as a sales contract until the contingency is removed. |
37
| December 31, | ||||||||||||
| 2011 | 2010 | 2009 | ||||||||||
| Active Communities |
||||||||||||
| Total |
157 | 151 | 153 | |||||||||
| West Region |
||||||||||||
| California |
20 | 14 | 7 | |||||||||
| Nevada |
2 | 4 | 6 | |||||||||
|
|
|
|
|
|
|
|||||||
| West Region Totals |
22 | 18 | 13 | |||||||||
| Central Region |
||||||||||||
| Arizona |
37 | 32 | 26 | |||||||||
| Texas |
67 | 82 | 98 | |||||||||
| Colorado |
10 | 9 | 6 | |||||||||
|
|
|
|
|
|
|
|||||||
| Central Region Totals |
114 | 123 | 130 | |||||||||
| East Region |
||||||||||||
| North Carolina |
3 | 0 | 0 | |||||||||
| Florida |
18 | 10 | 10 | |||||||||
|
|
|
|
|
|
|
|||||||
| East Region Totals |
21 | 10 | 10 | |||||||||
| Years Ended December 31, | ||||||||||||
| 2011 | 2010 | 2009 | ||||||||||
| Cancellation Rates (1) |
||||||||||||
| Total |
17.0 | % | 20.9 | % | 24.3 | % | ||||||
| West Region |
||||||||||||
| California |
22.8 | % | 18.7 | % | 19.2 | % | ||||||
| Nevada |
22.4 | % | 17.7 | % | 20.1 | % | ||||||
| West Region Totals |
22.8 | % | 18.6 | % | 19.4 | % | ||||||
| Central Region |
||||||||||||
| Arizona |
9.9 | % | 12.9 | % | 12.9 | % | ||||||
| Texas |
18.2 | % | 25.1 | % | 29.4 | % | ||||||
| Colorado |
12.9 | % | 15.0 | % | 15.2 | % | ||||||
| Central Region Totals |
15.7 | % | 21.6 | % | 25.5 | % | ||||||
| East Region |
||||||||||||
| North Carolina |
N/A | N/A | N/A | |||||||||
| Florida |
19.1 | % | 17.7 | % | 17.3 | % | ||||||
| East Region Totals |
18.3 | % | 17.7 | % | 17.3 | % | ||||||
| (1) | Cancellation rates are computed as the number of cancelled units for the period divided by the gross sales units for the same period. |
38
| Years Ended December 31, | Year Over Year | |||||||||||||||
| 2011 | 2010 | Chg $ | Chg % | |||||||||||||
| Order Backlog (1) |
||||||||||||||||
| Total |
||||||||||||||||
| Dollars |
$ | 248,854 | $ | 201,816 | $ | 47,038 | 23.3 | % | ||||||||
| Homes in backlog |
915 | 778 | 137 | 17.6 | % | |||||||||||
| Average sales price |
$ | 272.0 | $ | 259.4 | $ | 12.6 | 4.9 | % | ||||||||
| West Region |
||||||||||||||||
| California |
||||||||||||||||
| Dollars |
$ | 27,648 | $ | 15,295 | $ | 12,353 | 80.8 | % | ||||||||
| Homes in backlog |
82 | 45 | 37 | 82.2 | % | |||||||||||
| Average sales price |
$ | 337.2 | $ | 339.9 | $ | (2.7 | ) | (0.8 | )% | |||||||
| Nevada |
||||||||||||||||
| Dollars |
$ | 1,076 | $ | 2,369 | $ | (1,293 | ) | (54.6 | )% | |||||||
| Homes in backlog |
5 | 12 | (7 | ) | (58.3 | )% | ||||||||||
| Average sales price |
$ | 215.2 | $ | 197.4 | $ | 17.8 | 9.0 | % | ||||||||
| West Region Totals |
||||||||||||||||
| Dollars |
$ | 28,724 | $ | 17,664 | $ | 11,060 | 62.6 | % | ||||||||
| Homes in backlog |
87 | 57 | 30 | 52.6 | % | |||||||||||
| Average sales price |
$ | 330.2 | $ | 309.9 | $ | 20.3 | 6.6 | % | ||||||||
| Central Region |
||||||||||||||||
| Arizona |
||||||||||||||||
| Dollars |
$ | 45,232 | $ | 31,980 | $ | 13,252 | 41.4 | % | ||||||||
| Homes in backlog |
158 | 125 | 33 | 26.4 | % | |||||||||||
| Average sales price |
$ | 286.3 | $ | 255.8 | $ | 30.5 | 11.9 | % | ||||||||
| Texas |
||||||||||||||||
| Dollars |
$ | 93,494 | $ | 111,607 | $ | (18,113 | ) | (16.2 | )% | |||||||
| Homes in backlog |
396 | 463 | (67 | ) | (14.5 | )% | ||||||||||
| Average sales price |
$ | 236.1 | $ | 241.1 | $ | (5.0 | ) | (2.1 | )% | |||||||
| Colorado |
||||||||||||||||
| Dollars |
$ | 23,493 | $ | 16,964 | $ | 6,529 | 38.5 | % | ||||||||
| Homes in backlog |
70 | 52 | 18 | 34.6 | % | |||||||||||
| Average sales price |
$ | 335.6 | $ | 326.2 | $ | 9.4 | 2.9 | % | ||||||||
| Central Region Totals |
||||||||||||||||
| Dollars |
$ | 162,219 | $ | 160,551 | $ | 1,668 | 1.0 | % | ||||||||
| Homes in backlog |
624 | 640 | (16 | ) | (2.5 | )% | ||||||||||
| Average sales price |
$ | 260.0 | $ | 250.9 | $ | 9.1 | 3.6 | % | ||||||||
| East Region |
||||||||||||||||
| North Carolina |
||||||||||||||||
| Dollars |
$ | 8,616 | N/A | $ | 8,616 | N/M | ||||||||||
| Homes in backlog |
24 | N/A | 24 | N/M | ||||||||||||
| Average sales price |
$ | 359.0 | N/A | $ | 359.0 | N/M | ||||||||||
| Florida |
||||||||||||||||
| Dollars |
$ | 49,295 | $ | 23,601 | $ | 25,694 | 108.9 | % | ||||||||
| Homes in backlog |
180 | 81 | 99 | 122.2 | % | |||||||||||
| Average sales price |
$ | 273.9 | $ | 291.4 | $ | (17.5 | ) | (6.0 | )% | |||||||
| East Region Totals |
||||||||||||||||
| Dollars |
$ | 57,911 | $ | 23,601 | $ | 34,310 | 145.4 | % | ||||||||
| Homes in backlog |
204 | 81 | 123 | 151.9 | % | |||||||||||
| Average sales price |
$ | 283.9 | $ | 291.4 | $ | (7.5 | ) | (2.6 | )% | |||||||
| (1) | Our backlog represents net sales that have not closed. |
39
| Years Ended December 31, | Year Over Year | |||||||||||||||
| 2010 | 2009 | Chg $ | Chg % | |||||||||||||
| Order Backlog (1) |
||||||||||||||||
| Total |
||||||||||||||||
| Dollars |
$ | 201,816 | $ | 287,535 | $ | (85,719 | ) | (29.8 | )% | |||||||
| Homes in backlog |
778 | 1,095 | (317 | ) | (28.9 | )% | ||||||||||
| Average sales price |
$ | 259.4 | $ | 262.6 | $ | (3.2 | ) | (1.2 | )% | |||||||
| West Region |
||||||||||||||||
| California |
||||||||||||||||
| Dollars |
$ | 15,295 | $ | 34,322 | $ | (19,027 | ) | (55.4 | )% | |||||||
| Homes in backlog |
45 | 89 | (44 | ) | (49.4 | )% | ||||||||||
| Average sales price |
$ | 339.9 | $ | 385.6 | $ | (45.7 | ) | (11.9 | )% | |||||||
| Nevada |
||||||||||||||||
| Dollars |
$ | 2,369 | $ | 2,671 | $ | (302 | ) | (11.3 | )% | |||||||
| Homes in backlog |
12 | 14 | (2 | ) | (14.3 | )% | ||||||||||
| Average sales price |
$ | 197.4 | $ | 190.8 | $ | 6.6 | 3.5 | % | ||||||||
| West Region Totals |
||||||||||||||||
| Dollars |
$ | 17,664 | $ | 36,993 | $ | (19,329 | ) | (52.3 | )% | |||||||
| Homes in backlog |
57 | 103 | (46 | ) | (44.7 | )% | ||||||||||
| Average sales price |
$ | 309.9 | $ | 359.2 | $ | (49.3 | ) | (13.7 | )% | |||||||
| Central Region |
||||||||||||||||
| Arizona |
||||||||||||||||
| Dollars |
$ | 31,980 | $ | 32,110 | $ | (130 | ) | (0.4 | )% | |||||||
| Homes in backlog |
125 | 147 | (22 | ) | (15.0 | )% | ||||||||||
| Average sales price |
$ | 255.8 | $ | 218.4 | $ | 37.4 | 17.1 | % | ||||||||
| Texas |
||||||||||||||||
| Dollars |
$ | 111,607 | $ | 181,564 | $ | (69,957 | ) | (38.5 | )% | |||||||
| Homes in backlog |
463 | 715 | (252 | ) | (35.2 | )% | ||||||||||
| Average sales price |
$ | 241.1 | $ | 253.9 | $ | (12.8 | ) | (5.0 | )% | |||||||
| Colorado |
||||||||||||||||
| Dollars |
$ | 16,964 | $ | 11,456 | $ | 5,508 | 48.1 | % | ||||||||
| Homes in backlog |
52 | 39 | 13 | 33.3 | % | |||||||||||
| Average sales price |
$ | 326.2 | $ | 293.7 | $ | 32.5 | 11.1 | % | ||||||||
| Central Region Totals |
||||||||||||||||
| Dollars |
$ | 160,551 | $ | 225,130 | $ | (64,579 | ) | (28.7 | )% | |||||||
| Homes in backlog |
640 | 901 | (261 | ) | (29.0 | )% | ||||||||||
| Average sales price |
$ | 250.9 | $ | 249.9 | $ | 1.0 | 0.4 | % | ||||||||
| East Region |
||||||||||||||||
| Florida |
||||||||||||||||
| Dollars |
$ | 23,601 | $ | 25,412 | $ | (1,811 | ) | (7.1 | )% | |||||||
| Homes in backlog |
81 | 91 | (10 | ) | (11.0 | )% | ||||||||||
| Average sales price |
$ | 291.4 | $ | 279.3 | $ | 12.1 | 4.3 | % | ||||||||
| (1) | Our backlog represents net sales that have not closed. |
40
Fiscal 2011 Compared to Fiscal 2010
Companywide. Home closings revenue for the year ended December 31, 2011 decreased to $860.9 million, an 8.5% decrease when compared to the prior year, due to a 432-unit reduction in units closed that was partially offset by a $9,200 increase in average closing price. The decrease in closing units is mainly attributable to the higher closing volumes that the federal homebuyer tax credit program generated in the first half of our 2010 results, with no such benefit in 2011. Sales increased to $907.9 million and 3,405 units in 2011 as compared to $854.7 million and 3,383 units in 2010, reflecting increased average sales prices of $14,000, or 5.5%, and our lower cancellation rate of 17.0% as compared to 20.9% in 2010. Improved demand in the latter part of 2011 resulted in a 137-unit increase in our year-end backlog, ending 2011 with 915 homes as compared to 778 homes in 2010. Additionally, the value of orders in backlog increased due to a $12,600 or 4.9% increase in average sales price for the year ended December 31, 2011 versus the same period a year ago. Our average price increase in 2011 was a result of a shift in our mix to higher priced markets and desirable closer-in locations. Our active community count increased to 157 communities at the end of 2011 as compared to 151 in 2010.
West. In 2011, home closings dipped to 414 units with a value of $132.9 million, a decrease of $30.3 million or 18.6%, attributable to 84 fewer units, a 16.9% drop from 2010. The decrease in closing units and revenue are mainly attributable to a slower sales pace in the first half of the year, translating into fewer deliveries in 2011. In addition to the federal tax credit, California also offered a state homebuyer tax credit during 2010, which positively impacted comparative sales volumes in 2010. Increases in sales as the year progressed led to a 19-unit or $4.5 million increase in orders for 2011 in California as compared to 2010, resulting in an increase in ending backlog in the Region of $11.1 million on 30 units, a 62.6% and 52.6% increase, respectively. These increases, coupled with the $20,300 increase in average sales price, led to ending backlog in the Region valued at $28.7 million on 87 units. The California improvements were aided by a 61.9% increase in our average active community count in 2011, up to 20 as of year-end. The Nevada market saw declines in closings, orders and backlog. This is expected to continue as we wind down our operations in this market.
Central. The Central Region closed 2,512 units totaling $628.6 million in revenues, 13.1% and 9.3%, respectively, lower than those reported in 2010. A major factor in the Region’s results is the 368-unit or 18.1% decrease in home closings in Texas from the same period a year ago, due primarily to its 17.2% decrease in active communities. Offsetting some of the closing declines in Texas were increased closings in Colorado, up 96 units, while Arizona’s results remained mostly flat as unit decreases were mostly offset by closing price increases. The decrease in active communities in Texas was a result of closing out of lower-performing subdivisions in less desirable submarkets in Texas and the strategic redeployment of capital to other markets in 2010 that presented better opportunities to generate higher average sales prices and margins. This strategy has resulted in the rebalancing of assets from Texas into other markets, primarily California, Arizona, Colorado and Florida, although Texas continues to be an important contributor to our financial results, and we contracted for 40 additional communities there in 2011.
The Central Region’s sales decline of 133 units resulted in a 16-unit drop in ending backlog of 624 versus 640 units at December 31, 2011 and 2010, respectively; however, the $13,600 average sales price increase translated to a higher-ending backlog value of $1.7 million, an increase of $9,100 in average sales price. Well-positioned communities in desirable submarkets, primarily in Arizona, are largely to credit for the higher average sales prices that have benefitted this Region. Arizona had a year-over-year decrease in sales of 51 units, but a $7.5 million increase in total sales value. The unit decrease is mostly due to results in the first half of the year as discussed previously. However, the sales value gains are due to the higher average sales prices. Arizona ended the year with 33 more units in backlog, valued at $45.2 million, a 41.4% increase over the same period a year ago due to increasing sales volumes in the latter half of 2011. Colorado is the only state in the Region that did not experience a decline in sales in 2011, recognizing a 57.7% increase in orders to 276 for the year ended December 31, 2011, coupled with a $14,300 or 4.6% increase in average sales price. This momentum led Colorado to end the year with 70 units in backlog valued at $23.5 million, a 38.5% increase over 2010.
East. Our East Region generated 342 closings with $99.3 million of home revenue in 2011, a 9.6% and 17.6% increase, respectively from the same period in 2010 and was the only Region without lower year-over-year closing comparisons. The Region also experienced significant sales improvements generating $51.0 million of additional sales, due to both a 54.0% increase in unit sales as well as a $13,700 increase in average sales price in 2011 versus 2010. The Florida market was the largest contributor to the Region’s results, although sales operations in our North Carolina market commenced in the fourth quarter, contributing 24 units, or $8.6 million, in order volume and backlog from three actively-selling communities. We ended 2011 with 204 units in backlog with a value of $57.9 million, 151.9% and 145.4% increases from 2010, respectively. We believe that our community locations have helped the overall performance of this Region, and our construction has primarily been large-product with green features that appeals to our buyers.
41
Land Closing Revenue and Gross Profit
From time to time, we may sell certain land parcels to other homebuilders, developers or investors if we feel the sale will provide a greater economic benefit to us than continuing home construction or where we are looking to diversify our land positions in the specific geography. As a result of such sales, we recognized land closing revenue of $0.4 million, and $1.3 million for the years ending December 31, 2011 and 2010, respectively. We also recognized impairments related to land sales and on parcels marketed for future sale in the amount of $6.5 million, and $0.2 million for the years ending December 31, 2011, and 2010, respectively. Of our 2011 impairments, $5.9 million related to parcels we intend to sell in connection with our wind-down of our Las Vegas operations.
Fiscal 2010 Compared to Fiscal 2009
Companywide. Home closings for the year ended December 31, 2010 remained relatively flat at $940.4 million, a 2.3% decrease when compared to 2009, primarily due to a 339-unit reduction in units closed, mostly offset by a $15,800 increase in average closing price. Lower sales volume of 3,383 units in 2010 as compared to 3,853 in 2009 reflected the weakened demand caused by the expiration of the federal homebuyer tax credit. Absorptions in 2010 were partially aided by our lower cancellation rate of 20.9% as compared to 24.3% in 2009. Closings exceeded sales in the latter part of the year, resulting in a 317-unit decrease in our backlog in 2010, down to 778 homes as compared to 1,095 homes in 2009. Our active community count dipped slightly from 2009, as did our average sales per community at 22.3 during 2010, as compared to 23.3 during 2009.
West. In 2010, home closings grew to 498 units with a value of $163.2 million, increases of $20.0 million and 20 units, or 13.9% and 4.2%, respectively, over 2009. The Nevada market experienced continued weakness with a 40 sales unit decrease, more than offsetting our 23-unit gain in California. The California improvements were aided by a doubling of our active community count in 2010, up to 14 as of year-end. The Region had success early in the year, as sales orders and closings increased due in part to the extension of the homebuyer tax credit. In the latter part of the year, the expiration of the federal homebuyer tax credit and uncertain economy negatively impacted operations, resulted in sales of 452 units, a 3.6% decline from 2009. The higher closing volume and decrease in sales directly impacted ending backlog of 57 units, down from 103 in 2009.
Central. The Central Region’s 2010 closings of 2,890 deliveries totaling $692.7 million in revenues were 13.2% and 9.7%, lower than those reported in 2009, respectively. Largely impacting the Region’s results was the slowing of our Texas markets, as indicated by the 377-unit or 15.7% decrease in home closings from 2009, and due primarily to its 13.0% decrease in active communities. Offsetting some of the closing declines in Texas were increased closings in Colorado, while Arizona’ results remained mostly flat as unit decreases were primarily offset by closing price increases.
The Region’s sales declined 482 units in 2010, resulted in a 29.0% or 261-unit decrease in ending backlog at December 31, 2010 as compared to 2009. Arizona operations had a 15.0% decrease in ending backlog to 125 units. However, the new communities that opened in the latter part of 2009 and in 2010 generated higher average sales prices, nearly offsetting the unit decline and resulting in a relatively flat backlog of $32.0 million, down only $130,000 but 22 units from 2009. Colorado continued to be the only state in the Region that did not experience any sales or backlog deterioration from 2009 to 2010. This was primarily due to an increase in active community count of 50.0%, which contributed $11.9 million of additional sales volume and $5.5 million of additional backlog in 2010 versus 2009. Texas sales reflected the same trends as its revenue, with $100.5 million and 457-unit declines from 2009.
East. We generated 312 closings with $84.5 million of home revenue in 2010, a 35.7% and 61.4% increase from 2009. Our East Region experienced similar sales improvements generated $16.9 million of additional sales volume, due to both a 10.6% increase in unit sales as well as a $33,000 increase in average sales price in 2010 versus 2009. We ended 2010 with 81 units in backlog with a value of $23.6 million, 11.0% and 7.1% decreased from 2009, and an increased average sales price of $12,100 as closings outpaced sales in the final half of the year.
Land Closing Revenue and Gross Profit
As discussed above, from time to time we may sell certain parcels of land. As a result of such sales, we recognized land closing revenue of $1.3 million and $7.5 million for the years ending December 31, 2010 and 2009, respectively. We also recognized impairments related to land sales and on parcels marketed for future sale in the amount of $0.2 million and $14.7 million for the years ending December 31, 2010 and 2009, respectively. Of our 2009 land closing revenue, $3.2 million related to a single parcel of raw land in Arizona and $2.7 million related to two parcels in the Inspirada community in Las Vegas.
42
Other Operating Information (dollars in thousands)
| Years ended December 31, | ||||||||||||||||||||||||
| 2011 | 2010 | 2009 | ||||||||||||||||||||||
| Dollars | Percent | Dollars | Percent | Dollars | Percent | |||||||||||||||||||
| Home Closing Gross Profit/(Loss) Total (1) |
$ | 147,448 | 17.1 | % | $ | 167,456 | 17.8 | % | $ | 18,693 | 1.9 | % | ||||||||||||
| Add back impairments |
8,870 | 6,434 | 111,490 | |||||||||||||||||||||
|
|
|
|
|
|
|
|||||||||||||||||||
| Adjusted Gross Margin |
156,318 | 18.2 | % | 173,890 | 18.5 | % | 130,183 | 13.5 | % | |||||||||||||||
|
|
|
|
|
|
|
|||||||||||||||||||
| West |
$ | 17,282 | 13.0 | % | $ | 29,062 | 17.8 | % | $ | (7,151 | ) | (5.0 | )% | |||||||||||
| Add back impairments |
4,660 | 274 | 25,497 | |||||||||||||||||||||
|
|
|
|
|
|
|
|||||||||||||||||||
| Adjusted Gross Margin |
21,942 | 16.5 | % | 29,336 | 18.0 | % | 18,346 | 12.8 | % | |||||||||||||||
|
|
|
|
|
|
|
|||||||||||||||||||
| Central |
$ | 109,663 | 17.4 | % | $ | 119,061 | 17.2 | % | $ | 30,876 | 4.0 | % | ||||||||||||
| Add back impairments |
3,514 | 5,839 | 77,389 | |||||||||||||||||||||
|
|
|
|
|
|
|
|||||||||||||||||||
| Adjusted Gross Margin |
113,177 | 18.0 | % | 124,900 | 18.0 | % | 108,265 | 14.1 | % | |||||||||||||||
|
|
|
|
|
|
|
|||||||||||||||||||
| East |
$ | 20,503 | 20.6 | % | $ | 19,333 | 22.9 | % | $ | (5,032 | ) | (9.6 | )% | |||||||||||
| Add back impairments |
696 | 321 | 8,604 | |||||||||||||||||||||
|
|
|
|
|
|
|
|||||||||||||||||||
| Adjusted Gross Margin |
$ | 21,199 | 21.3 | % | $ | 19,654 | 23.3 | % | 3,572 | 6.8 | % | |||||||||||||
|
|
|
|
|
|
|
|||||||||||||||||||
| (1) | Home closing gross profit represents home closing revenue less cost of home closings, including impairments. Cost of home closings include land and lot development costs, direct home construction costs, an allocation of common community costs (such as model complex costs and architectural, legal and zoning costs), interest, sales tax, impact fees, warranty, construction overhead and closing costs. |
Fiscal 2011 Compared to Fiscal 2010
Companywide. Home closing gross margin decreased slightly to 17.1% for the year ended December 31, 2011 as compared to 17.8% for the year ended December 31, 2010. Gross margins excluding impairments were 18.2% and 18.5% for 2011 and 2010, respectively. Our margin decreases in 2011 as compared to 2010 are mainly due to weaker market conditions in the first half of the year. They are also representative of the impact of reduced leverage of construction overhead costs due to a lesser number of closings from the same period a year ago. Our impairment charges reflect the write-down to fair value of certain real-estate and related assets of $8.9 million in 2011 and $6.4 million in 2010. Our impairments in 2011 largely reflect the wind down of operations in our Nevada market.
We provide gross margins excluding impairments — a non-GAAP term — as we use it to evaluate our performance and believe it is a widely-accepted financial measure by users of our financial statements in analyzing our operating results and provides comparability to similar calculations by our peers in the homebuilding industry. However, gross margins excluding impairments as presented may not be fully comparable to similarly titled measures reported by other companies because not all companies calculate this metric in an identical manner. This measure is not intended to represent GAAP gross margins and it should not be considered in isolation or as a substitute for measures of performance prepared in accordance with GAAP.
West. Our West Region experienced a decrease in home closing gross margin to 13.0% for 2011 from 17.8% in 2010. These margins included impairments of $4.7 million in 2011 versus $0.3 million in the prior year. Excluding these impairments, the gross margins for 2011 and 2010 were 16.5% and 18.0%, respectively. The impairments are primarily related to our Las Vegas assets. Gross margins excluding impairments dipped in 2011, mostly due to additional price concessions in California, particularly in the first part of the year. We anticipate some margin improvement in California in 2012.
43
Central. The Central Region’s 17.4% home closing gross margin was relatively flat as compared to 17.2% in 2010. During 2011, we maintained near-normal margins in most of our communities as most of the lots in this Region are well priced and located in desirable submarkets. The Central Region’s home closing gross margins include $3.5 million of real estate-related impairments for 2011 compared to $5.8 million for 2010. Excluding these impairments, the gross margin in this Region remained flat at 18.0% for both years.
East. While the East Region continues to generate the highest gross margins for us, we saw a decrease in 2011 to 20.6% versus 22.9% in 2010 and 21.3% in 2011 versus 23.3% in 2010, excluding impairments. The decrease is mainly due to the close-out of certain highly profitable communities in late 2010 and our entry into certain highly desirable and high volume communities that had additional building and design requirements that resulted in some cost increases. We believe the above-average margins and the increased number of sale and closings these communities deliver outweigh the slight decrease in margins.
Fiscal 2010 Compared to Fiscal 2009
Companywide. Home closing gross margin improved to 17.8% for the year ended December 31, 2010 as compared to 1.9% for the year ended December 31, 2009. Gross margins excluding impairments were 18.5% and 13.5% for 2010 and 2009, respectively. Our new communities with well-priced lots located in good submarkets contributed to the gross margin gains in 2010. Our margins also benefited from the continued cost-cutting measures and building efficiencies we have achieved in 2009 and 2010. Our impairment charges reflected the write-down to fair value of certain real-estate and related assets. We recorded only $6.4 million of impairments in 2010, a $105.1 million decrease from 2009. Our impairments in 2010 reflected the continuation of soft market conditions in some of our geographies, particularly in our legacy communities in Texas as we push to close them out.
West. Our West Region improved its home closing gross margin to 17.8% for 2010 from a negative margin of (5.0)% in 2009. These margins included impairments of $0.3 million in 2010 versus $25.5 million in the prior year. Excluding these impairments, the gross margins for 2010 and 2009 were 18.0% and 12.8%, respectively. The improvement in our pre-impairment gross margins was mostly attributable to our desirable locations in our California markets that achieved more normalized margins.
Central. The Central Region’s 17.2% home closing gross profit increased 1,320 basis points as compared to 4.0% in 2009, primarily due to fewer community impairments recorded in 2010 as compared to the same period a year ago and cost savings in materials and construction costs. During 2010, we were successful in earning near-normal margins in many of our new communities in Arizona and Colorado as the lots were well priced and were located in more desirable submarkets. The Central Region’s home closing gross margins included $5.8 million of real estate-related impairments for 2010 compared to $77.4 million for 2009. Excluding these impairments, the gross margin in this Region increased to 18.0% in 2010 versus 14.1% in 2009.
East. Our East region experienced a significant increase in gross margins earning 22.9% for 2010 versus a negative margin of (9.6)% for 2009. The increase in home closing margins was primarily due to reduced impairments recorded, $0.3 million and $8.6 million during 2010 and 2009, respectively. Gross margins also increased due to the closings generated by our new communities, which tend to earn higher margins and higher average closing prices of $43,100. Excluding these impairments, gross margins would have been 23.3% for the Region for 2010 and 6.8% for 2009 benefitting from our new communities as previously discussed.
44
| Years Ended December 31, | ||||||||||||
| ($ in thousands) | ||||||||||||
| 2011 | 2010 | 2009 | ||||||||||
| Commissions and Other Sales Costs |
||||||||||||
| Dollars |
$ | 74,912 | $ | 76,798 | $ | 78,683 | ||||||
| Percent of home closing revenue |
8.7 | % | 8.2 | % | 8.2 | % | ||||||
| General and Administrative Expenses |
||||||||||||
| Dollars |
$ | 64,184 | $ | 59,784 | $ | 59,461 | ||||||
| Percent of total closing revenue |
7.5 | % | 6.3 | % | 6.1 | % | ||||||
| Interest Expense |
||||||||||||
| Dollars |
$ | 30,399 | $ | 33,722 | $ | 36,531 | ||||||
| Benefit/(provision) for Income Taxes |
||||||||||||
| Dollars |
$ | (730 | ) | $ | 4,666 | $ | 88,343 | |||||
Fiscal 2011 Compared to Fiscal 2010
Commissions and Other Sales Costs. Commissions and other sales costs are comprised of internal and external commissions and related sales and marketing expenses such as advertising and sales office costs. These costs decreased by $1.9 million for 2011 versus 2010. The decrease primarily relates to reduced commission expense attributable to lower closing units and revenue dollars. The increase year-over-year as a percentage of revenue is primarily the result of lower revenue coupled with the introduction of strategically-targeted marketing campaigns, including increased investments in alternative marketing channels, such as the internet and social media outlets. In addition, we established a marketing call center this year, which provides centralized sales and marketing information to our homebuyers nation-wide seven days a week. We expect the call center to contribute a significant number of our future sales and closings. We continue to focus on regionalizing and nationalizing marketing campaigns in order to gain efficiencies and reduce costs.
General and Administrative Expenses. General and administrative expenses represent corporate and divisional overhead expenses such as salaries and bonuses, occupancy, insurance and travel expenses. General and administrative expenses increased to $64.2 million for 2011 versus $59.8 million in 2010, or 7.5% and 6.3% of total revenue, respectively. Included in those figures is increased stock-based compensation expense, the divisional overhead costs to start up a new division in North Carolina, upgrades to our market research and technology tools and increased legal fees and settlements. We expect to be able to capitalize on our research and technology investments and on our centralized operations as the economy improves with limited general and administrative expense increases.
Interest Expense. Interest expense is comprised of interest incurred, but not capitalized, on our senior and senior subordinated notes, and other borrowings. During 2011 and 2010, our non-capitalizable interest expense was $30.4 million and $33.7 million, respectively. The decrease in expense year over year is a result of a higher amount of active assets under development that qualify for interest capitalization.
Income Taxes. Our overall effective tax rates were a provision of 3.6% for 2011, compared to a benefit of 188% for 2010. The change in our tax rate is primarily attributable to the Texas franchise tax on our gross margin.
Fiscal 2010 Compared to Fiscal 2009
Commissions and Other Sales Costs. Commissions and other sales costs decreased by $1.9 million for 2010 versus 2009. The decrease primarily related to reduced commission expense attributable to lower closing units and revenue dollars as well as reduced sales office and model maintenance costs. Over the past several quarters, we have migrated to a more efficient field marketing structure by reducing the number of models and corresponding operating costs in our model and sales complexes. In 2010, these savings were partially offset by increased grand opening and marketing costs associated with our extreme “green” communities.
General and Administrative Expenses. General and administrative expenses increased slightly to $59.8 million for 2010 versus $59.5 million in 2009. Meritage was one of the first homebuilders to aggressively cut overhead and associated general and administrative expenses as the market began its downward cycle in late 2006 and therefore, was continuing to operate under this efficient, lean structure, resulting in relatively flat year-over-year dollar comparisons. General and administrative expenses were 6.3% and 6.1% of total revenue for 2010 and 2009, respectively, primarily due to the decrease in revenues in 2010.
45
Interest Expense. During 2010 and 2009, our non-capitalizable interest expense was $33.7 million and $36.5 million, respectively. Interest expense in 2009 also includes $3.1 million related to the amendment of and subsequent termination of our Credit Facility. Excluding this charge, interest expense remained flat between 2010 and 2009.
Income Taxes. Our overall effective tax rates were a benefit of 188% for 2010 and 57.1% for 2009. The 2009 tax rate reflects the tax benefit we received from federal tax legislation that enabled us to carry back our 2009 NOL five years.
Liquidity and Capital Resources
Overview
Our principal uses of capital for 2011 were operating expenses, home construction, the payment of routine liabilities, and the acquisition of new and strategic lot positions. We used funds generated by operations and our cash reserves to meet our short-term working capital requirements. Throughout the challenging and extended downturn in the housing market, we have focused on generating cash by exiting certain markets and land positions and maintaining margins in our homebuilding operations. These efforts have in turn helped us weather the prolonged downturn while maintaining a strong balance sheet and keeping us poised for future growth. In 2011, we began to utilize some of our excess cash reserves to grow our inventory balances, particularly increasing our lot positions in anticipation of an improving market.
Cash flows for each of our communities depend on their stage of the development cycle, and can differ substantially from reported earnings. Early stages of development or expansion require significant cash outlays for land acquisitions, plat and other approvals, and construction of model homes, roads, utilities, general landscaping and other amenities. Because these costs are a component of our inventory and not recognized in our statement of operations until a home closes, we incur significant cash outlays prior to recognition of earnings. In the later stages of a community, cash inflows may significantly exceed earnings reported for financial statement purposes, as the cash outflow associated with home and land construction was previously incurred. From a liquidity standpoint, we are currently actively acquiring and developing lots in our markets to maintain and start to grow our lot supply and active community count, replacing older communities that are near close-out and acquiring communities in strategic and attractive locations we deem key to our success. Accordingly, as demand for new homes improves and we begin to expand our business, we expect that cash outlays for land purchases and land development may exceed our cash generated by operations. During 2011, we closed 3,268 homes, purchased about 4,500 lots for $192.9 million, spent $53.7 million on land development, and started about 3,399 homes. As one of our initiatives is to manage our lot supply with well-priced lots in strategic submarkets, the opportunity to purchase substantially finished lots in desired locations is becoming increasingly more limited and competitive. Accordingly, we are spending more dollars on land development as we are purchasing more partially finished lots than in recent years.
We exercise strict controls and believe we have a prudent strategy for Company-wide cash management, particularly as related to cash outlays for land and inventory acquisition and development. We ended 2011 with $333.2 million of cash and cash equivalents, investments and securities, and restricted cash. As we have no debt maturities until 2015, we intend to generate cash from the sale of our inventory, but throughout 2011, we have begun to redeploy that cash to acquire and develop strategic and well-positioned lots that represent opportunities to generate more normal margins, as well as for other operating purposes.
In addition to expanding our business in existing markets, we continue to look into opportunities to expand outside of our existing markets. In April 2011, we announced our entry into the Raleigh-Durham, North Carolina market. We have since acquired several land parcels in Raleigh-Durham, commenced construction of our model parks and began sales operations in the fourth quarter of 2011. This opportunity expands our footprint into a new market with positive growth potential. The Raleigh-Cary market was ranked as the #1 healthiest homebuilding market for 2011 by Hanley Wood Market Intelligence, a leading industry source, and the neighboring Durham-Chapel Hill market ranked #3. Entry into the Raleigh-Durham area offers us growth opportunities based on a number of positive factors, including a growing employment base, rising median incomes, and affordable cost of living. We also announced our entry in the Tampa, Florida market in December 2011 where we are actively pursuing land holdings at this time. We expect to leverage our local market expertise in Florida to manage our Tampa operations.
We continue to evaluate our capital needs in light of ongoing developments in homebuilding markets and our existing capital structure. We believe that we currently have strong liquidity. Nevertheless, we may seek additional capital to strengthen our liquidity position, enable us to opportunistically acquire additional land inventory in anticipation of improving market conditions, and/or strengthen our long-term capital structure. Such additional capital may be in the form of equity or debt financing and may be from a variety of sources. There can be no assurances that we would be able to obtain such
46
additional capital on terms acceptable to us, if at all, and such additional equity or debt financing could dilute the interests of our existing stockholders or increase our interest costs. Alternatively, if we believe that we have excess liquidity, we may elect to either repurchase our debt or outstanding equity.
We believe that our leverage ratios provide useful information to the users of our financial statements regarding our financial position and cash and debt management. Debt-to-capital and net debt-to-capital are calculated as follows (dollars in thousands):
| At December 31, 2011 |
At December 31, 2010 |
|||||||
| Notes payable and other borrowings |
$ | 606,409 | $ | 605,780 | ||||
| Stockholders’ equity |
488,912 | 499,995 | ||||||
|
|
|
|
|
|||||
| Total capital |
$ | 1,095,321 | $ | 1,105,775 | ||||
| Debt-to-capital (1) |
55.4 | % | 54.8 | % | ||||
| Notes payable and other borrowings |
$ | 606,409 | $ | 605,780 | ||||
| Less: cash, cash equivalents, restricted cash and investments and securities |
(333,187 | ) | (412,642 | ) | ||||
|
|
|
|
|
|||||
| Net debt |
273,222 | 193,138 | ||||||
| Stockholders’ equity |
488,912 | 499,995 | ||||||
|
|
|
|
|
|||||
| Total net capital |
$ | 762,134 | $ | 693,133 | ||||
| Net debt-to-capital (2) |
35.8 | % | 27.9 | % | ||||
| (1) | Debt-to-capital is computed as notes payable and other borrowing divided by the aggregate of total notes payable and stockholders’ equity. |
| (2) | Net debt-to-capital is computed as net debt divided by the aggregate of net debt and stockholders’ equity. |
Senior and Senior Subordinated Notes
6.25% Senior Notes
In March 2005, we issued $350.0 million in aggregate principal amount of 6.25% senior notes due 2015. In April 2010, we repurchased $65 million of our 6.25% senior notes, resulting in $285 million in aggregate principal remaining on the notes. The indenture which governs the 6.25% senior notes requires us to comply with a number of covenants that restrict certain transactions, including:
| • | limiting the amount of additional indebtedness we can incur unless after giving effect to such additional indebtedness, either (i) our fixed charge coverage ratio would be at least 2.0 to 1.0 or (ii) our ratio of unconsolidated debt to consolidated tangible net worth would be less than 3.0 to 1.0 (together, the “ratio requirement”), provided, however, this limitation does not generally apply to most types of inter-company indebtedness, purchase money indebtedness, other indebtedness up to $25 million and non-recourse indebtedness; |
| • | generally limiting the amount of dividends, redemptions of equity interests and certain investments we can make to $25 million plus (i) 50% of our net income since June 1, 2001 plus (ii) 100% of the net cash proceeds from the sale of qualified equity interests, plus other items and subject to other exceptions; |
| • | limiting our ability to incur or create certain liens; |
| • | placing limitations on the sale of assets, mergers and consolidations and transactions with affiliates; and |
| • | limiting the amount of investments we can make in joint ventures in a permitted business with unaffiliated third parties to 30% of our consolidated tangible net worth (as defined in the indenture). |
7.731% Senior Subordinated Notes
In February 2007, we completed a $150.0 million private placement of 7.731% senior subordinated notes due 2017. These notes were issued at par, and their associated proceeds were used to pay down our prior credit facility. The covenants related to these senior subordinated notes are substantially similar to the covenants of our 6.25% senior notes discussed above.
47
7.15% Senior Notes
During the second quarter of 2010, we completed an offering of $200 million aggregate principal amount of 7.15% senior notes due 2020. The notes were issued at 97.567% of par value to yield 7.50%. The indenture for our 7.15% senior notes contains covenants including, among others, limitations on the amount of secured debt we may incur, and limitations on sale and leaseback transactions of non-model home assets and mergers. The covenants contained in the 7.15% senior notes are generally no more restrictive, and in many cases less restrictive, than the covenants contained in the indentures for the 6.25% senior notes and 7.731% senior subordinated notes.
7.0% Senior Notes
In April 2004, we issued $130.0 million in principal amount of 7.0% senior notes due 2014. In April 2010, we repurchased all of the $130.0 million of 7.0% senior notes.
Covenant Compliance
We were in compliance with all Senior and subordinated note covenants as of December 31, 2011. In order to be out of compliance with the ratio requirement, we would need to fail both the Fixed Charge Coverage and Leverage Ratios, not just one ratio independently. A failure to meet both the Fixed Charge Coverage and Leverage Ratio is not a default but rather results in a prohibition (subject to exceptions) from incurring additional indebtedness only. Our actual Fixed Charge and Leverage Ratio as of December 31, 2011 are reflected in the table below:
| Financial Covenant |
Covenant Requirement |
Actual | ||||||
| ($ in millions) | ||||||||
| Fixed Charge Coverage |
> 2.0 | 1.177 | ||||||
| Leverage Ratio |
< 3.0 | 1.306 | ||||||
See Note 4 of the Consolidated Financial Statements included in this Annual Report on Form 10-K for all further information on our senior and senior subordinated notes.
Land under Control
We enter into various options and purchase contracts for land in the normal course of business. Generally, our options to purchase lots remain effective so long as we purchase a pre-established minimum number of lots each month or quarter, as determined by the respective agreement. The pre-established number is typically structured to approximate our expected rate of home construction starts, although as demand slows, in some instances starts may fall below the pre-established minimum number of lot purchases. Over the past several years, the slower sales rate caused us to take certain actions, including purchasing lots in advance of corresponding sales, re-negotiating the takedown schedules, and discontinuing lot purchases and forfeiting the related non-refundable option deposit. Additional information regarding our purchase agreements and related deposits is presented in Note 3 in the accompanying consolidated financial statements in this Annual Report on Form 10-K.
The total number of lots under control at December 31, 2011 was 16,722 as compared to 15,224 at December 31, 2010. In 2011 and 2010, respectively, 83.0% and 84.7% of our controlled lots were owned. The increase in our land holdings from prior year was due to an intentional effort to grow our lot positions in quality submarkets during 2011, as we entered into new land contracts for approximately 5,500 lots for $264.9 million as compared to approximately 6,800 lots for $239.2 million in 2010. At December 31, 2011, our total option and purchase contracts had purchase prices in the aggregate of approximately $175.1 million, on which we had made deposits of approximately $15.2 million in cash.
Off-Balance Sheet Arrangements
Reference is made to Notes 1, 3 and 12 in the accompanying Notes to consolidated financial statements included in this Annual Report on Form 10-K. These Notes discuss our off-balance sheet arrangements with respect to land acquisition contracts and option agreements, and land development joint ventures, including the nature and amounts of financial obligations relating to these items. In addition, these Notes discuss the nature and amounts of certain types of commitments that arise in connection with the ordinary course of our land development and homebuilding operations, including commitments of land development joint ventures for which we might be obligated.
48
Contractual Obligations
The following is a summary of our contractual obligations at December 31, 2011, and the effect such obligations are expected to have on our liquidity and cash flows in future periods (in thousands):
| Payments Due by Period | ||||||||||||||||||||
| Total | Less than 1 Year |
1-3 Years | 4-5 Years | More Than 5 Years |
||||||||||||||||
| Principal, senior and senior subordinated notes |
$ | 610,875 | $ | 0 | $ | 0 | $ | 285,000 | $ | 325,875 | ||||||||||
| Interest, senior and senior subordinated notes |
224,418 | 41,844 | 83,688 | 51,031 | 47,855 | |||||||||||||||
| Operating lease obligations |
15,307 | 6,440 | 8,533 | 334 | 0 | |||||||||||||||
| Other contractual obligations |
440 | 312 | 128 | 0 | 0 | |||||||||||||||
|
|
|
|
|
|
|
|
|
|
|
|||||||||||
| Total (1) |
$ | 851,040 | $ | 48,596 | $ | 92,349 | $ | 336,365 | $ | 373,730 | ||||||||||
|
|
|
|
|
|
|
|
|
|
|
|||||||||||
| (1) | See Notes 4 and 12 to our consolidated financial statements included in this report for additional information regarding our contractual obligations. |
We do not engage in commodity trading or other similar activities. We had no derivative financial instruments at December 31, 2011 or 2010.
Recent Accounting Standards
See Note 1 to our consolidated financial statements included in this report for discussion of recently-issued accounting standards.
Item 7A. Quantitative and Qualitative Disclosures about Market Risk
Our fixed rate debt is made up primarily of $285.0 million in principal of our 6.25% senior notes, $125.9 million of our 7.731% senior subordinated notes and $200.0 million in principal of our 7.15% senior notes. Except in limited circumstances, we do not have an obligation to prepay our fixed-rate debt prior to maturity and, as a result, interest rate risk and changes in fair value should not have a significant impact on our fixed rate borrowings until we would be required to repay such debt.
The following table presents our long-term debt obligations, principal cash flows by maturity, weighted average interest rates and estimated fair market value. Information regarding interest rate sensitivity principal (notional) amount by expected maturity and average interest rates for the year ended December 31, 2011 follows:
| December 31, 2011 For the Years Ended December 31, |
Fair Value at December 31, |
|||||||||||||||||||||||||||||||
| 2012 | 2013 | 2014 | 2015 | 2016 | Thereafter | Total | 2011 (a) | |||||||||||||||||||||||||
| (dollars in millions) | ||||||||||||||||||||||||||||||||
| Fixed rate |
$ | 0 | $ | 0 | $ | 0 | $ | 285.0 | $ | 0 | $ | 325.9 | $ | 610.9 | $ | 579.4 | ||||||||||||||||
| Average interest rate |
0 | 0 | 0 | 6.25 | % | 0 | 7.375 | % | 6.85 | % | n/a | |||||||||||||||||||||
| (a) | Fair value of our fixed rate debt at December 31, 2011, is derived from quoted market prices by independent dealers. |
Our operations are interest rate sensitive. As overall housing demand is adversely affected by increases in interest rates, a significant increase in mortgage interest rates may negatively affect the ability of homebuyers to secure adequate financing. Higher interest rates could adversely affect our revenues, gross margins and net income and would also increase our variable rate borrowing costs. We do not enter into, or intend to enter into, derivative financial instruments for trading or speculative purposes.
49
Item 8. Financial Statements and Supplementary Data
Our consolidated financial statements as of December 31, 2011 and 2010 and for each of the years in the three-year period ended December 31, 2011, together with related notes and the report of Deloitte & Touche LLP, independent registered public accounting firm, are on the following pages.
50
REPORT OF INDEPENDENT REGISTERED PUBLIC ACCOUNTING FIRM
To the Board of Directors and Stockholders of
Meritage Homes Corporation
Scottsdale, Arizona
We have audited the accompanying consolidated balance sheets of Meritage Homes Corporation and subsidiaries (the “Company”) as of December 31, 2011 and 2010, and the related consolidated statements of operations, stockholders’ equity, and cash flows for each of the three years in the period ended December 31, 2011. These financial statements are the responsibility of the Company’s management. Our responsibility is to express an opinion on these financial statements based on our audits.
We conducted our audits in accordance with the standards of the Public Company Accounting Oversight Board (United States). Those standards require that we plan and perform the audit to obtain reasonable assurance about whether the financial statements are free of material misstatement. An audit includes examining, on a test basis, evidence supporting the amounts and disclosures in the financial statements. An audit also includes assessing the accounting principles used and significant estimates made by management, as well as evaluating the overall financial statement presentation. We believe that our audits provide a reasonable basis for our opinion.
In our opinion, such consolidated financial statements present fairly, in all material respects, the financial position of Meritage Homes Corporation and subsidiaries as of December 31, 2011 and 2010, and the results of their operations and their cash flows for each of the three years in the period ended December 31, 2011, in conformity with accounting principles generally accepted in the United States of America.
We have also audited, in accordance with the standards of the Public Company Accounting Oversight Board (United States), the Company’s internal control over financial reporting as of December 31, 2011, based on the criteria established in Internal Control-Integrated Framework issued by the Committee of Sponsoring Organizations of the Treadway Commission and our report dated February 24, 2012 expressed an unqualified opinion on the Company’s internal control over financial reporting.
/s/ DELOITTE & TOUCHE LLP
Phoenix, Arizona
February 24, 2012
51
MERITAGE HOMES CORPORATION AND SUBSIDIARIES
CONSOLIDATED BALANCE SHEETS
| December 31, | ||||||||
| 2011 | 2010 | |||||||
| (In thousands, except share data) | ||||||||
| Assets |
||||||||
| Cash and cash equivalents |
$ | 173,612 | $ | 103,953 | ||||
| Investments and securities |
147,429 | 299,345 | ||||||
| Restricted cash |
12,146 | 9,344 | ||||||
| Other receivables |
14,932 | 20,835 | ||||||
| Real estate |
815,425 | 738,928 | ||||||
| Real estate not owned |
0 | 866 | ||||||
| Deposits on real estate under option or contract |
15,208 | 10,359 | ||||||
| Investments in unconsolidated entities |
11,088 | 10,987 | ||||||
| Property and equipment, net |
13,491 | 14,602 | ||||||
| Intangibles, net |
1,571 | 2,143 | ||||||
| Prepaid expenses and other assets |
16,476 | 13,576 | ||||||
|
|
|
|
|
|||||
| Total assets |
$ | 1,221,378 | $ | 1,224,938 | ||||
|
|
|
|
|
|||||
| Liabilities |
||||||||
| Accounts payable |
$ | 37,735 | $ | 23,589 | ||||
| Accrued liabilities |
79,464 | 87,811 | ||||||
| Home sale deposits |
8,858 | 6,897 | ||||||
| Liabilities related to real estate not owned |
0 | 866 | ||||||
| Senior and senior subordinated notes |
606,409 | 605,780 | ||||||
|
|
|
|
|
|||||
| Total liabilities |
732,466 | 724,943 | ||||||
|
|
|
|
|
|||||
| Stockholders’ Equity |
||||||||
| Preferred stock, par value $0.01. Authorized 10,000,000 shares; none issued and outstanding at December 31, 2011 and 2010 |
0 | 0 | ||||||
| Common stock, par value $0.01. Authorized 125,000,000 shares; issued 40,377,021 and 40,030,136 shares at December 31, 2011 and 2010, respectively |
404 | 400 | ||||||
| Additional paid-in capital |
478,839 | 468,820 | ||||||
| Retained earnings |
198,442 | 219,548 | ||||||
| Treasury stock at cost 7,891,250 shares at December 31, 2011 and 2010 |
(188,773 | ) | (188,773 | ) | ||||
|
|
|
|
|
|||||
| Total stockholders’ equity |
488,912 | 499,995 | ||||||
|
|
|
|
|
|||||
| Total liabilities and stockholders’ equity |
$ | 1,221,378 | $ | 1,224,938 | ||||
|
|
|
|
|
|||||
See accompanying notes to consolidated financial statements
52
MERITAGE HOMES CORPORATION AND SUBSIDIARIES
CONSOLIDATED STATEMENTS OF OPERATIONS
| Years Ended December 31, | ||||||||||||
| 2011 | 2010 | 2009 | ||||||||||
| (In thousands, except per share data) | ||||||||||||
| Home closing revenue |
$ | 860,884 | $ | 940,406 | $ | 962,797 | ||||||
| Land closing revenue |
360 | 1,250 | 7,516 | |||||||||
|
|
|
|
|
|
|
|||||||
| Total closing revenue |
861,244 | 941,656 | 970,313 | |||||||||
|
|
|
|
|
|
|
|||||||
| Cost of home closings |
(704,566 | ) | (766,516 | ) | (832,614 | ) | ||||||
| Cost of land closings |
(246 | ) | (993 | ) | (7,432 | ) | ||||||
| Real estate impairments |
(8,870 | ) | (6,434 | ) | (111,490 | ) | ||||||
| Land impairments |
(6,454 | ) | (17 | ) | (14,726 | ) | ||||||
|
|
|
|
|
|
|
|||||||
| Total cost of closings and impairments |
(720,136 | ) | (773,960 | ) | (966,262 | ) | ||||||
|
|
|
|
|
|
|
|||||||
| Home closing gross profit |
147,448 | 167,456 | 18,693 | |||||||||
| Land closing gross (loss)/profit |
(6,340 | ) | 240 | (14,642 | ) | |||||||
|
|
|
|
|
|
|
|||||||
| Total closing gross profit |
141,108 | 167,696 | 4,051 | |||||||||
| Commissions and other sales costs |
(74,912 | ) | (76,798 | ) | (78,683 | ) | ||||||
| General and administrative expenses |
(64,184 | ) | (59,784 | ) | (59,461 | ) | ||||||
| Earnings from unconsolidated entities, net |
5,849 | 5,243 | 4,013 | |||||||||
| Interest expense |
(30,399 | ) | (33,722 | ) | (36,531 | ) | ||||||
| (Loss)/gain on extinguishment of debt |
0 | (3,454 | ) | 9,390 | ||||||||
| Other income, net |
2,162 | 3,303 | 2,422 | |||||||||
|
|
|
|
|
|
|
|||||||
| (Loss)/earnings before income taxes |
(20,376 | ) | 2,484 | (154,799 | ) | |||||||
| (Provision)/benefit for income taxes |
(730 | ) | 4,666 | 88,343 | ||||||||
|
|
|
|
|
|
|
|||||||
| Net (loss)/income |
$ | (21,106 | ) | $ | 7,150 | $ | (66,456 | ) | ||||
|
|
|
|
|
|
|
|||||||
| (Loss)/earnings per share: |
||||||||||||
| Basic |
$ | (0.65 | ) | $ | 0.22 | $ | (2.12 | ) | ||||
| Diluted |
$ | (0.65 | ) | $ | 0.22 | $ | (2.12 | ) | ||||
| Weighted average number of shares: |
||||||||||||
| Basic |
32,382 | 32,060 | 31,350 | |||||||||
| Diluted |
32,382 | 32,322 | 31,350 | |||||||||
See accompanying notes to consolidated financial statements
53
MERITAGE HOMES CORPORATION AND SUBSIDIARIES
CONSOLIDATED STATEMENTS OF STOCKHOLDERS’ EQUITY
| Years Ended December 31, 2011, 2010 and 2009 | ||||||||||||||||||||||||
| (In thousands) | ||||||||||||||||||||||||
| Number of Shares |
Common Stock |
Additional Paid-In Capital |
Retained Earnings |
Treasury Stock |
Total | |||||||||||||||||||
| Balance at January 1, 2009 |
38,589 | $ | 386 | $ | 436,739 | $ | 278,854 | $ | (188,773 | ) | $ | 527,206 | ||||||||||||
| Net loss |
0 | 0 | 0 | (66,456 | ) | 0 | (66,456 | ) | ||||||||||||||||
| Tax valuation adjustment related to stock option exercises |
0 | 0 | (602 | ) | 0 | 0 | (602 | ) | ||||||||||||||||
| Exercise of stock options |
275 | 3 | 4,750 | 0 | 0 | 4,753 | ||||||||||||||||||
| Equity award compensation expense |
0 | 0 | 6,204 | 0 | 0 | 6,204 | ||||||||||||||||||
| Issuance of common stock, net |
847 | 8 | 14,312 | 0 | 0 | 14,320 | ||||||||||||||||||
|
|
|
|
|
|
|
|
|
|
|
|
|
|||||||||||||
| Balance at December 31, 2009 |
39,711 | 397 | 461,403 | 212,398 | (188,773 | ) | 485,425 | |||||||||||||||||
| Net income |
0 | 0 | 0 | 7,150 | 0 | 7,150 | ||||||||||||||||||
| Exercise of stock options |
133 | 1 | 2,061 | 0 | 0 | 2,062 | ||||||||||||||||||
| Equity award compensation expense |
0 | 0 | 5,358 | 0 | 0 | 5,358 | ||||||||||||||||||
| Issuance of common stock, net |
186 | 2 | (2 | ) | 0 | 0 | 0 | |||||||||||||||||
|
|
|
|
|
|
|
|
|
|
|
|
|
|||||||||||||
| Balance at December 31, 2010 |
40,030 | 400 | 468,820 | 219,548 | (188,773 | ) | 499,995 | |||||||||||||||||
| Net loss |
0 | 0 | 0 | (21,106 | ) | 0 | (21,106 | ) | ||||||||||||||||
| Exercise of stock options |
172 | 2 | 2,611 | 0 | 0 | 2,613 | ||||||||||||||||||
| Equity award compensation expense |
0 | 0 | 7,410 | 0 | 0 | 7,410 | ||||||||||||||||||
| Issuance of common stock, net |
175 | 2 | (2 | ) | 0 | 0 | 0 | |||||||||||||||||
|
|
|
|
|
|
|
|
|
|
|
|
|
|||||||||||||
| Balance at December 31, 2011 |
40,377 | $ | 404 | $ | 478,839 | $ | 198,442 | $ | (188,773 | ) | $ | 488,912 | ||||||||||||
|
|
|
|
|
|
|
|
|
|
|
|
|
|||||||||||||
See accompanying notes to consolidated financial statements
54
MERITAGE HOMES CORPORATION AND SUBSIDIARIES
CONSOLIDATED STATEMENTS OF CASH FLOWS
| Years Ended December 31, | ||||||||||||
| 2011 | 2010 | 2009 | ||||||||||
| (In thousands) | ||||||||||||
| Cash flows from operating activities: |
||||||||||||
| Net (loss)/income |
$ | (21,106 | ) | $ | 7,150 | $ | (66,456 | ) | ||||
| Adjustments to reconcile net (loss)/income to net cash provided by operating activities: |
||||||||||||
| Depreciation and amortization |
7,178 | 7,974 | 8,843 | |||||||||
| Real estate-related impairments |
15,324 | 6,451 | 126,216 | |||||||||
| Other assets-related impairments |
848 | 0 | 0 | |||||||||
| Stock-based compensation |
7,410 | 5,358 | 6,204 | |||||||||
| Loss/(gain) on early extinguishment of senior subordinated debt |
0 | 3,454 | (9,390 | ) | ||||||||
| Equity in earnings of unconsolidated entities (includes $0.0, $0.3 million and $2.8 million of impairments to joint ventures in 2011, 2010 and 2009, respectively) |
(5,849 | ) | (5,243 | ) | (4,013 | ) | ||||||
| Distributions of earnings from unconsolidated entities |
6,497 | 7,263 | 8,286 | |||||||||
| Other operating expenses |
509 | (37 | ) | 0 | ||||||||
| Changes in assets and liabilities: |
||||||||||||
| (Increase)/decrease in real estate |
(89,659 | ) | (68,910 | ) | 98,453 | |||||||
| (Increase)/decrease in deposits on real estate under option or contract |
(6,038 | ) | (1,054 | ) | 10,175 | |||||||
| Decrease in receivables and prepaid expenses and other assets |
3,247 | 94,474 | 28,954 | |||||||||
| Increase/(decrease) in accounts payable and accrued liabilities |
5,542 | (21,725 | ) | (24,213 | ) | |||||||
| Increase/(decrease) in home sale deposits |
1,961 | (2,604 | ) | 1,015 | ||||||||
|
|
|
|
|
|
|
|||||||
| Net cash (used in)/provided by operating activities |
(74,136 | ) | 32,551 | 184,074 | ||||||||
|
|
|
|
|
|
|
|||||||
| Cash flows from investing activities: |
||||||||||||
| Investments in unconsolidated entities |
(702 | ) | (1,034 | ) | (1,284 | ) | ||||||
| Distributions of capital from unconsolidated entities |
10 | 232 | 1,370 | |||||||||
| Purchases of property and equipment |
(7,082 | ) | (6,389 | ) | (3,609 | ) | ||||||
| Proceeds from sales of property and equipment |
54 | 121 | 151 | |||||||||
| Payments to purchase investments and securities |
(196,401 | ) | (424,639 | ) | (125,699 | ) | ||||||
| Proceeds from sales and maturities of investment securities |
348,105 | 250,190 | 0 | |||||||||
| (Increase)/decrease in restricted cash |
(2,802 | ) | 7,004 | (16,348 | ) | |||||||
|
|
|
|
|
|
|
|||||||
| Net cash provided by/(used in) investing activities |
141,182 | (174,515 | ) | (145,419 | ) | |||||||
|
|
|
|
|
|
|
|||||||
| Cash flows from financing activities: |
||||||||||||
| Proceeds from issuance of senior and senior subordinated notes |
0 | 195,134 | 0 | |||||||||
| Debt issuance costs |
0 | (3,067 | ) | 0 | ||||||||
| Repayment of senior notes |
0 | (197,543 | ) | 0 | ||||||||
| Proceeds from stock option exercises |
2,613 | 2,062 | 4,753 | |||||||||
|
|
|
|
|
|
|
|||||||
| Net cash provided by/(used in) financing activities |
2,613 | (3,414 | ) | 4,753 | ||||||||
|
|
|
|
|
|
|
|||||||
| Net increase/(decrease) in cash and cash equivalents |
69,659 | (145,378 | ) | 43,408 | ||||||||
| Cash and cash equivalents, beginning of year |
103,953 | 249,331 | 205,923 | |||||||||
|
|
|
|
|
|
|
|||||||
| Cash and cash equivalents, end of year |
$ | 173,612 | $ | 103,953 | $ | 249,331 | ||||||
|
|
|
|
|
|
|
|||||||
See Supplemental Disclosure of Cash Flow Information at Note 9.
See accompanying notes to consolidated financial statements
55
MERITAGE HOMES CORPORATION AND SUBSIDIARIES
NOTES TO CONSOLIDATED FINANCIAL STATEMENTS
December 31, 2011, 2010 and 2009
NOTE 1 — BUSINESS AND SUMMARY OF SIGNIFICANT ACCOUNTING POLICIES
Organization. Meritage Homes is a leading designer and builder of single-family detached homes based on the number of home closings. We build in the historically high-growth regions of the southern and western United States and offer first-time, move-up, luxury and active adult homes to our targeted customer base. We have operations in three regions: West, Central and East, which are comprised of seven states: Arizona, Texas, California, Nevada, Colorado, Florida and North Carolina. In 2011, we announced expansion into Raleigh, North Carolina and within Florida through entry into the Tampa market. Through our successors, we commenced our homebuilding operations in 1985. Meritage Homes Corporation was incorporated in 1988 in the State of Maryland.
Our homebuilding and marketing activities are conducted under the name of Meritage Homes in each of our markets, except for Arizona and Texas, where we also operate under the name of Monterey Homes. At December 31, 2011, we were actively selling homes in 157 communities, with base prices ranging from approximately $103,000 to $673,000.
Basis of Presentation. The accompanying consolidated financial statements have been prepared in accordance with accounting principles generally accepted in the United States (“GAAP”) and include the accounts of Meritage Homes Corporation and those of our consolidated subsidiaries, partnerships and other entities in which we have a controlling financial interest, and of variable interest entities (see Note 3) in which we are deemed the primary beneficiary (collectively, “us”, “we”, “our” and the “Company”). Intercompany balances and transactions have been eliminated in consolidation.
Cash and Cash Equivalents. Liquid investments with an initial maturity of three months or less are classified as cash equivalents. Amounts in transit from title companies for home closings of approximately $13.1 million and $2.0 million are included in cash and cash equivalents at December 31, 2011 and 2010, respectively. Included in our balance as of December 31, 2011 are $26.8 million of money market funds that are invested in short term (three months or less) government securities.
Restricted Cash. Restricted cash consists of amounts held in restricted accounts as collateral for our letter of credit arrangements. The aggregate capacity of these secured letters of credit is approximately $75 million. Our restricted cash accounts are invested in money market accounts and United States Government securities, totaling $12.1 million and $9.3 million at December 31, 2011 and 2010, respectively.
Investments and Securities. Our investments and securities are comprised of both treasury securities and deposits with money center banks that are FDIC-insured and secured by treasury-backed investments (see additional discussion regarding such deposits in Note 10 to these consolidated financial statements). All of our investments are classified as held-to-maturity and are recorded at amortized cost as we have both the ability and intent to hold them until their respective maturities. The contractual lives of these investments are greater than three months. The amortized cost of the investments approximates fair value.
Real Estate. Real estate is stated at cost unless the community or land is determined to be impaired, at which point the inventory is written down to fair value as required by Accounting Standards Codification (ASC) 360-10, Property, Plant and Equipment (ASC 360-10). Inventory includes the costs of land acquisition, land development, home construction, capitalized interest, real estate taxes, direct overhead costs incurred during development and home construction that benefit the entire community, less impairments, if any. Land and development costs are typically allocated and transferred to homes under construction when home construction begins. Home construction costs are accumulated on a per-home basis. Cost of home closings includes the specific construction costs of the home and all related allocated land acquisition, land development and other common costs (both incurred and estimated to be incurred) that are allocated based upon the total number of homes expected to be closed in each community or phase. Any changes to the estimated total development costs of a community or phase are allocated to the remaining homes in the community or phase. When a home closes, we may have incurred costs for goods and services that have not yet been paid. Therefore, an accrued liability to capture such obligations is recorded in connection with the home closing and charged directly to cost of sales.
We rely on certain estimates to determine our construction and land development costs. Construction and land costs are comprised of direct and allocated costs, including estimated future costs. In determining these costs, we compile project budgets that are based on a variety of assumptions, including future construction schedules and costs to be incurred. It is possible that actual results could differ from budgeted amounts for various reasons, including construction delays, labor or
56
materials shortages, increases in costs that have not yet been committed, changes in governmental requirements, or other unanticipated issues encountered during construction and development and other factors beyond our control. To address uncertainty in these budgets, we assess, update, and revise project budgets on a regular basis, utilizing the most current information available to estimate construction and land costs.
Typically, a community’s life cycle ranges from three to five years, commencing with the acquisition of the land and continuing through the land development phase and concluding with the sale, construction and closing of the homes. Actual community lives will vary based on the size of the community, the sales absorption rate and whether the land purchased was raw, partially developed or finished lots. Master-planned communities encompassing several phases and super-block land parcels may have significantly longer lives and projects involving smaller finished lot purchases may be significantly shorter.
All of our land inventory and related real estate assets are reviewed for recoverability quarterly, as our inventory is considered “long-lived” in accordance with GAAP. Impairment charges are recorded to write down an asset to its estimated fair value if the undiscounted cash flows expected to be generated by the assets are lower than its carrying amount. Our determination of fair value is based on projections and estimates. Changes in these expectations may lead to a change in the outcome of our impairment analysis and actual results may also differ from our assumptions. Our analysis is completed on a quarterly basis at a community level with each community or land parcel evaluated individually. For those assets deemed to be impaired, the impairment recognized is measured as the amount by which the assets’ carrying value exceeds their fair value. The impairment of a community is allocated to each lot on a straight-line basis.
Existing and continuing communities. When projections for the remaining income expected to be earned from existing communities are no longer positive, the underlying real estate assets are not deemed fully recoverable, and further analysis is performed to determine the required impairment. The fair value of the community’s assets is determined using either a discounted cash flow model for projects we intend to build out or a market-based approach for projects to be sold. Impairments are charged to cost of home closings in the period during which it is determined that the fair value is less than the assets’ carrying amount. If a market-based approach is used, we determine fair value based on recent comparable purchase and sale activity in the local market, adjusted for known variances as determined by our knowledge of the region and general real estate expertise. If a discounted cash flow approach is used, we compute fair value based on a proprietary model. Our key estimates in deriving fair value under our cash flow model are (i) home selling prices in the community adjusted for current and expected sales discounts and incentives, (ii) costs related to the community — both land development and home construction — including costs spent to date and budgeted remaining costs to spend, (iii) projected sales absorption rates, reflecting any product mix change strategies implemented to stimulate the sales pace and expected cancellation rates, (iv) alternative land uses including disposition of all or a portion of the land owned and (v) our discount rate, which is currently 14-16% and varies based on the perceived risk inherent in the community’s other cash flow assumptions. These assumptions vary widely across different communities and geographies and are largely dependent on local market conditions. Community-level factors that may impact our key estimates include:
| • | The presence and significance of local competitors, including their offered product type and competitive actions; |
| • | Economic and related demographic conditions for the population of the surrounding community; |
| • | Desirability of the particular community, including unique amenities or other favorable or unfavorable attributes; and |
| • | Existing home inventory supplies, including foreclosures and short sales. |
These local circumstances may significantly impact our assumptions and the resulting computation of fair value, and are, therefore, closely evaluated by our division personnel in their creation of the discounted cash flow models. The models are also evaluated by regional and corporate personnel for consistency and integration, as decisions that affect pricing or absorption at one community may have resulting consequences for neighboring communities. We typically do not project market improvements in our discounted cash flow models, but may do so in limited circumstances in the latter years of a long-lived community. In certain cases, we may elect to stop development and/or marketing of an existing community (mothball) if we believe the economic performance of the community would be maximized by deferring development for a period of time to allow market conditions to improve. The decision may be based on financial and/or operational metrics. If we decide to mothball a project, we will impair it to its fair value as discussed above and then cease future development activity until such a time where management believes that market conditions will improve and economic performance will be maximized. No costs are capitalized to communities that are designated as mothball. Quarterly, we review all communities, including mothballed communities, for potential impairments.
57
For our land held for future development and out mothballed communities, our inventory assessments typically include highly subjective estimates for future performance, including the timing of development, the product to be offered, sales rates and selling prices of the product when the community is anticipated to open for sales, and the projected costs to develop and construct the community. We evaluate various factors to develop our forecasts, including the availability of and demand for homes and finished lots within the marketplace, historical, current and future sales trends, and third-party data, if available. Based on these factors, we reach conclusions for future performance based on our judgment.
Option deposits and pre-acquisition costs. We also evaluate assets associated with future communities for impairments on a quarterly basis. Using similar techniques described in the existing and continuing communities section above, we determine if the income to be generated by our future communities are acceptable to us. If the projections indicate that a community is still meeting our internal investment guidelines and is generating a profit, those assets are determined to be fully recoverable and no impairments are required. In cases where we decide to abandon a project, we will fully impair all assets related to such project and will expense and accrue any additional costs that we are contractually obligated to incur. In certain circumstances, we may also elect to continue with a project because it is expected to generate positive cash flows, even though it may not be generating an accounting profit, or due to other strategic factors. In such cases, we will impair our pre-acquisition costs and deposits, as necessary, to record an impairment to bring the book value to fair value. Refer to Note 2 of these consolidated financial statements for further information regarding our impairments.
Deposits. Deposits paid related to land options and purchase contracts are capitalized when incurred and classified as deposits on real estate under option or contract until the related land is purchased. Deposits are reclassified to a component of real estate at the time the deposit is used to offset the acquisition price of the lots based on the terms of the underlying agreements. To the extent they are non-refundable, deposits are charged to expense if the land acquisition is terminated or no longer considered probable. As our exposure associated with these non-refundable deposits is limited to the deposit amount as the acquisition contracts do not typically require specific performance, we do not consider the options a contractual obligation to purchase the land. The review of the likelihood of the acquisition of contracted lots is completed quarterly in conjunction with the real estate impairment analysis noted above and therefore, if impaired, the deposits are recorded as the lower of cost or fair value. Our deposits were $15.2 million and $10.4 million as of December 31, 2011 and 2010, respectively.
Property and Equipment, net. Gross property and equipment at December 31, 2011 and 2010 consists of approximately $28.0 million and $29.6 million, respectively, of computer and office equipment and approximately $19.3 million and $23.4 million, respectively, of model home furnishings. Accumulated depreciation related to these assets amounted to approximately $33.8 million and $38.4 million at December 31, 2011 and 2010, respectively. Depreciation is generally calculated using the straight-line method over the estimated useful lives of the assets, which range from three to seven years. Maintenance and repair costs are expensed as incurred.
Deferred Costs. At December 31, 2011 and 2010, deferred costs representing debt issuance costs totaled approximately $5.0 million and $5.9 million, net of accumulated amortization of approximately $5.9 million and $5.0 million, respectively, and are included on our consolidated balance sheets within prepaid expenses and other assets. The costs are primarily amortized to interest expense using the straight line method which approximates the effective interest method.
Investments in Unconsolidated Entities. We use the equity method of accounting for investments in unconsolidated entities over which we exercise significant influence but do not have a controlling interest. Under the equity method, our share of the unconsolidated entities’ earnings or loss is included in Earnings from unconsolidated entities, net, in our statements of operations. We use the cost method of accounting for investments in unconsolidated entities over which we do not have significant influence. We track cumulative earnings and distributions from each of our ventures. For cash flow classification, to the extent distributions do not exceed earnings, we designate such distributions as return on capital. Distributions in excess of cumulative earnings are treated as return of capital. We evaluate our investments in unconsolidated entities for impairment at least quarterly.
58
Accrued Liabilities. Accrued liabilities at December 31, 2011 and 2010 consisted of the following (in thousands):
| At December 31, | ||||||||
| 2011 | 2010 | |||||||
| Accruals related to real estate development and construction activities |
$ | 11,048 | $ | 10,689 | ||||
| Payroll and other benefits |
13,535 | 12,146 | ||||||
| Accrued taxes |
3,075 | 2,820 | ||||||
| Warranty reserves |
23,136 | 29,265 | ||||||
| Other accruals |
28,670 | 32,891 | ||||||
|
|
|
|
|
|||||
| Total |
$ | 79,464 | $ | 87,811 | ||||
|
|
|
|
|
|||||
Revenue Recognition. Revenue from closings of residential real estate is recognized when closings have occurred, the buyer has made the required minimum down payment, obtained necessary financing, the risks and rewards of ownership are transferred to the buyer, and we have no continuing involvement with the property, which is generally the close of escrow. Revenue is reported net of any discounts and incentives.
Cost of Home Closings. Cost of home closings includes direct home construction costs, closing costs, land acquisition and development costs, development period interest and common costs. Direct construction costs are accumulated during the period of construction and charged to cost of closings under specific identification methods, as are closing costs. Estimates of costs incurred or to be incurred but not paid are accrued and expensed at the time of closing. Land development, acquisition and common costs are allocated to each lot based on the number of lots remaining to close.
Income Taxes. We account for income taxes using the asset and liability method, which requires that deferred tax assets and liabilities be recognized based on future tax consequences of both temporary differences between the financial statement carrying amounts of existing assets and liabilities and their respective tax bases. Deferred tax assets and liabilities are measured using enacted tax rates expected to apply in the years in which the temporary differences are expected to be recovered or settled. The effect on deferred tax assets and liabilities of a change in tax rates is recognized in earnings in the period when the changes are enacted.
We record net deferred tax assets to the extent we believe these assets will more likely than not be realized. In making such determination, we consider all available positive and negative evidence, including scheduled reversals of deferred tax liabilities, whether we are in a cumulative loss position, projected future taxable income, tax planning strategies and recent financial operations. We evaluate our cumulative loss position over a four-year period, based on the current and prior three years. If we determine that we will not be able to realize our deferred income tax assets in the future, we make an adjustment to the valuation allowance, which increases the provision for income taxes.
We recognize interest and penalties related to unrecognized tax benefits within the income tax expense line in the accompanying consolidated statement of operations. Accrued interest and penalties are included within the related tax liability line in the consolidated balance sheets.
Advertising Costs. The Company expenses advertising costs as they are incurred. Advertising expense was approximately $6.3 million, $7.7 million and $6.1 million in fiscal 2011, 2010 and 2009, respectively.
(Loss)/Earnings Per Share. We compute basic (loss)/earnings per share by dividing net (loss)/earnings by the weighted average number of common shares outstanding during the period. Diluted earnings per share gives effect to the potential dilution that could occur if securities or contracts to issue common stock that are dilutive were exercised or converted into common stock or resulted in the issuance of common stock that then shared in our earnings. In periods of net losses, no dilution is computed.
Stock-Based Compensation. We account for stock-based compensation in accordance with ASC 718-10, Compensation—Stock Compensation. We use the Black-Scholes model to value stock options granted or modified after January 1, 2006, under this guidance. This guidance also requires us to estimate forfeitures in calculating the expense related to stock-based compensation and to reflect the benefits of tax deductions in excess of recognized compensation expense as both a financing inflow and an operating cash outflow. Awards with either a graded or cliff vesting are expensed on a straight-line basis over the life of the award. See Note 7 for additional discussion.
59
401(k) Retirement Plan
We have a 401(k) plan for all full-time Meritage employees (the “Plan”). We match portions of employees’ voluntary contributions, and contributed to the plan approximately $738,000, $553,000 and $602,000 for the years ended 2011, 2010 and 2009, respectively. Company common stock was an investment option for the Company match contributions through 2009. Starting in January 2010, we eliminated our Company common stock as a possible matching contribution election. Meritage stock comprised 0% and 2.4% of the total plan assets as of December 31, 2011 and 2010, respectively.
Off-Balance Sheet Arrangements — Joint Ventures. Historically, we have participated in land development joint ventures as a means of accessing larger parcels of land and lot positions, expanding our market opportunities, managing our risk profile and leveraging our capital base; however, in recent years, they have not been a significant avenue for us to access desired lots. We currently have only two such active ventures. We also participate in six mortgage and title business joint ventures. The mortgage joint ventures are engaged in, or invest in mortgage companies that engage in, mortgage brokerage activities, and they originate and provide services to both our clients and other homebuyers.
Repayment Guarantees. We and/or our land development joint venture partners occasionally provide limited repayment guarantees on a pro rata basis on the debt of the land development joint ventures. If such a guarantee were ever to be called or triggered, the maximum exposure to Meritage would generally be only our pro-rata share of the amount of debt outstanding that was in excess of the fair value of the underlying land securing the debt. Our share of these limited pro rata repayment guarantees as of December 31, 2011 and December 31, 2010 is noted in the table below. See Note 12 of these consolidated financial statements for further information regarding our repayment guarantees.
Completion Guarantees. If there is development work to be completed, we and our joint venture partners are also typically obligated to the project lender(s) to complete construction of the land development improvements if the joint venture does not perform the required development. Provided we and the other joint venture partners are in compliance with these completion obligations, the project lenders are generally obligated to fund these improvements through any financing commitments available under the applicable joint venture development and construction loans. In addition, we and our joint venture partners have from time to time provided unsecured indemnities to joint venture project lenders. These indemnities generally obligate us to reimburse the project lenders only for claims and losses related to matters for which such lenders are held responsible and our exposure under these indemnities is limited to specific matters such as environmental claims. As part of our project acquisition due diligence process to determine potential environmental risks, we generally obtain, or the joint venture entity generally obtains, an independent environmental review. Per the guidance of ASC 460-10, Guarantees, we believe these other guarantees are either not applicable or not material to our financial results.
In connection with our joint ventures, we may provide certain types of guarantees to associated lenders and municipalities. These guarantees can be classified into two categories: (i) repayment guarantees and (ii) completion guarantees, described in more detail above. Additionally, we have classified a guarantee related to our minority ownership in the South Edge joint venture separately, as the venture’s lender group has presented us with a demand letter for such guarantee.
| (In thousands) |
At December 31, 2011 | At December 31, 2010 | ||||||
| Repayment guarantees |
$ | 346 | $ | 733 | ||||
| Completion guarantees (1) |
0 | 0 | ||||||
| South Edge guarantee (2) |
13,243 | 11,758 | ||||||
|
|
|
|
|
|||||
| Total guarantees |
$ | 13,589 | $ | 12,491 | ||||
|
|
|
|
|
|||||
| (1) | As our completion guarantees typically require funding from a third party, we believe these guarantees do not represent a potential cash obligation for us, as they require only our non-financial performance. |
| (2) | The increase in the balance during 2011 represents accrued interest and penalties as reflected in a demand letter received from the venture’s lenders. We have not been provided the calculation of such interest and penalties and have not confirmed the increase in the balance. As discussed in Note 12, we dispute the enforceability of this guarantee and ultimate resolution of this matter will be addressed through litigation and/or settlements. |
Surety Bonds. We and our joint venture partners also indemnify third party surety providers with respect to performance bonds issued on behalf of certain of our joint ventures. If a joint venture does not perform its obligations, the surety bond could be called. If these surety bonds are called and the joint venture fails to reimburse the surety, we and our joint venture partners would be obligated to make such payments. These surety indemnity arrangements are generally joint and several obligations with our joint venture partners. Although a majority of the required work may have been performed, these bonds are typically not released until all development specifications have been met. None of these bonds have been called to date and we believe it is unlikely that any of these bonds will be called or if called, that any such amounts would be material to us. See the table below under the heading “Off-Balance Sheet Arrangements – Other” for detail of our surety bonds.
60
The joint venture obligations, guarantees and indemnities discussed above are generally provided by us or one or more of our subsidiaries. In joint ventures involving other homebuilders or developers, support for these obligations is generally provided by the parent companies of the joint venture partners. In connection with our periodic real estate impairment reviews, we may accrue for any such commitments where we believe our obligation to pay is probable and can be reasonably estimated. In such situations, our accrual represents the portion of the total joint venture obligation related to our relative ownership percentage. In the limited cases where our venture partners, some of whom are homebuilders or developers who may be experiencing financial difficulties as a result of current market conditions, may be unable to fulfill their pro rata share of a joint venture obligation, we may be fully responsible for these commitments if such commitments are joint and several. We continue to monitor these matters and reserve for these obligations if and when they become probable and can be reasonably estimated.
Off-Balance Sheet Arrangements — Other. We typically acquire lots from various development entities pursuant to option and purchase agreements. The purchase price generally approximates the market price at the date the contract is executed, although in light of the recent economic condition, over the last several years we have been successful in renegotiating more preferential terms on some of the lots that we still have under contract. See Note 3 for further discussion.
We provide letters of credit and performance, maintenance and other bonds in support of our related obligations with respect to joint ventures, option deposits, the development of our projects and other corporate purposes. The amount of these obligations outstanding at any time varies depending on the stage and level of our development activities. In the event a letter of credit or bond is drawn upon, we would be obligated to reimburse the issuer. We believe it is unlikely that any significant amounts of these letters of credit or bonds will be drawn upon. The table below outlines our letter of credit and surety bond obligations (in thousands):
| December 31, 2011 | December 31, 2010 | |||||||||||||||
| Outstanding | Estimated work remaining to complete |
Outstanding | Estimated work remaining to complete |
|||||||||||||
| Sureties: |
||||||||||||||||
| Sureties related to joint ventures |
$ | 1,594 | $ | 32 | $ | 1,594 | $ | 32 | ||||||||
| Sureties related to owned projects and lots under contract |
65,921 | 37,252 | 57,399 | 26,968 | ||||||||||||
|
|
|
|
|
|
|
|
|
|||||||||
| Total Sureties |
$ | 67,515 | $ | 37,284 | $ | 58,993 | $ | 27,000 | ||||||||
|
|
|
|
|
|
|
|
|
|||||||||
| Letters of Credit (“LOCs”): |
||||||||||||||||
| LOCs for land development |
$ | 6,451 | N/A | $ | 2,488 | N/A | ||||||||||
| LOCs for general corporate operations |
4,960 | N/A | 6,460 | N/A | ||||||||||||
|
|
|
|
|
|||||||||||||
| Total LOCs |
$ | 11,411 | N/A | $ | 8,948 | N/A | ||||||||||
|
|
|
|
|
|||||||||||||
Warranty Reserves. We have certain obligations related to post-construction warranties and defects for closed homes. With the assistance of an actuary for the structural related warranty, we have estimated these reserves based on the number of home closings and historical data and trends for our communities. We also use industry data with respect to similar product types and geographic areas in markets where our experience is incomplete to draw a meaningful conclusion. We regularly review our warranty reserves and adjust them, as necessary, to reflect changes in trends as information becomes available. Based on the historical trends in our warranty costs incurred, we recorded a favorable $2.6 million adjustment to our warranty reserve balance, which reduced our cost of sales in 2011. A summary of changes in our warranty reserves follows (in thousands):
| Year Ended December 31, | ||||||||
| 2011 | 2010 | |||||||
| Balance, beginning of period |
$ | 29,265 | $ | 33,541 | ||||
| Additions to reserve from new home deliveries |
6,692 | 7,016 | ||||||
| Warranty claims |
(10,227 | ) | (11,173 | ) | ||||
| Adjustments to pre-existing reserves |
(2,594 | ) | (119 | ) | ||||
|
|
|
|
|
|||||
| Balance, end of period |
$ | 23,136 | $ | 29,265 | ||||
|
|
|
|
|
|||||
Warranty reserves are included in accrued liabilities on the accompanying consolidated balance sheets, and additions and adjustments to the reserves are included in cost of sales within the accompanying consolidated statements of operations. These reserves are intended to cover costs associated with our contractual and statutory warranty obligations, which include, among other items, claims involving defective workmanship and materials. We believe that our total reserves, coupled with our contractual relationships and rights with our trades and the general liability insurance we maintain, are sufficient to cover our general warranty obligations. However, as unanticipated changes in legal, weather, environmental or other conditions could have an impact on our actual warranty costs, future costs could differ significantly from our estimates.
61
During the first quarter of 2009, we became aware that a limited number of the homes we constructed were exhibiting symptoms typical of defective Chinese drywall. As of December 31, 2011, we have confirmed that approximately 100 homes we built in 2005 and 2006 were constructed using defective Chinese drywall installed by subcontractors. Of those homes, approximately 95 are located in Florida and the remaining homes are located in the Houston, Texas area. We are continuing to conduct investigations to determine if other Texas and/or Florida homes are impacted, although it currently appears at this time that additional exposure is limited. As of December 31, 2011, we have completed the repair of 80 homes, and we are in the process of repairing approximately 10 additional homes. The warranty reserves we have recorded as of December 31, 2011 include reserves that we believe are sufficient to cover the completion of our repair of the remaining affected homes and the resulting damage related to defective Chinese drywall. If our continuing investigations reveal other homes containing defective Chinese drywall, it may be necessary to increase our warranty reserves. We have received reimbursement for a good portion of the costs we have incurred or expect to incur related to defective Chinese drywall from a manufacturer and supplier of the defective drywall and from our general liability insurance carrier, and we continue to seek reimbursement of the remainder of such costs as well as the costs we expect to incur in the future related to defective Chinese drywall.
Recently Issued Accounting Pronouncements. In May 2011, the Financial Accounting Standards Board (“FASB”) issued ASU 2011-04, Fair Value Measurement (“ASU 2011-04”), which amended ASC 820, Fair Value Measurements (“ASC 820”), providing a consistent definition and measurement of fair value, as well as similar disclosure requirements between U.S. GAAP and International Financial Reporting Standards. ASU 2011-04 changes certain fair value measurement principles, clarifies the application of existing fair value measurement and expands the disclosure requirements. ASU 2011-04 will be effective for us beginning January 1, 2012. The adoption of ASU 2011-04 is not expected to have a material effect on our consolidated financial statements or disclosures.
In June 2011, the FASB issued ASU 2011-05, Presentation of Comprehensive Income (“ASU 2011-05”). ASU 2011-05 requires the presentation of comprehensive income in either (1) a continuous statement of comprehensive income or (2) two separate but consecutive statements. ASU 2011-05 will be effective for us beginning January 1, 2012. The adoption of ASU 2011-05 is not expected to have a material effect on our consolidated financial statements or disclosures.
In September 2011, the FASB issued ASU 2011-08, Testing Goodwill for Impairment (“ASU 2011-08”), which amends the guidance in ASC 350-20, Intangibles—Goodwill and Other – Goodwill. ASU 2011-08 provides entities with the option of performing a qualitative assessment before calculating the fair value of the reporting unit when testing goodwill for impairment. If the fair value of the reporting unit is determined, based on qualitative factors, to be more likely than not less than the carrying amount of the reporting unit, the entities are required to perform a two-step goodwill impairment test. ASU 2011-08 will be effective for us beginning January 1, 2012. The adoption of ASU 2011-08 is not expected to have a material effect on our consolidated financial statements or disclosures.
NOTE 2 — REAL ESTATE AND CAPITALIZED INTEREST
Real estate at December 31 consists of the following (in thousands):
| 2011 | 2010 | |||||||
| Homes under contract under construction (1) |
$ | 101,445 | $ | 97,002 | ||||
| Unsold homes, completed and under construction (1) |
97,246 | 87,011 | ||||||
| Model homes (1) |
49,892 | 37,027 | ||||||
| Finished home sites and home sites under development (2) |
467,867 | 435,473 | ||||||
| Land held for development (2) (3) |
69,067 | 59,692 | ||||||
| Land held for sale |
29,908 | 22,723 | ||||||
|
|
|
|
|
|||||
| $ | 815,425 | $ | 738,928 | |||||
|
|
|
|
|
|||||
| (1) | Also includes the allocated land and land development costs associated with each lot for these homes. |
| (2) | Includes communities where we have decided to cease operations (mothball) as we have determined that their economic performance would be maximized by deferring development. In the future, some of these communities may be re-opened while others may be sold to third parties. If we deem our carrying value to not be fully recoverable, we adjust our carrying value for these assets to fair value at the time they are placed into mothball. We do not capitalize interest for such mothballed assets, and all ongoing costs of land ownership (i.e., property taxes, homeowner association dues, etc.) are expensed as incurred. |
| (3) | Land held for development primarily reflects land and land development costs related for land where development activity is not currently underway but is expected to begin or resume in the future. We may cease development activity on certain land holdings, as they represent a portion of a large land parcel that we plan to build out over several years. |
62
As previously noted, in accordance with ASC 360-10, each of our land inventory and related real estate assets is reviewed for recoverability when impairment indicators are present, as our inventory is considered “long-lived” in accordance with GAAP. Due to the current environment, we evaluate all of our real estate assets for impairment on a quarterly basis. ASC 360-10 requires impairment charges to be recorded if the asset is not deemed recoverable and the fair value of such assets is less than their carrying amounts. Our determination of fair value is based on projections and estimates. We also evaluate alternative product offerings in communities where impairment indicators are present and other strategies for the land exist, such as selling or holding the land for sale. Based on these reviews of all our communities, we recorded the following real-estate and joint-venture impairment charges during the years ended December 31, 2011, 2010 and 2009 (in thousands):
| Years Ended December 31, | ||||||||||||
| 2011 | 2010 | 2009 | ||||||||||
| Terminated option/purchase contracts: |
||||||||||||
| West |
$ | 863 | $ | 0 | $ | 7,038 | ||||||
| Central |
1,904 | 1,030 | 60,645 | |||||||||
| East |
0 | 0 | 3,270 | |||||||||
|
|
|
|
|
|
|
|||||||
| Total |
$ | 2,767 | $ | 1,030 | $ | 70,953 | ||||||
|
|
|
|
|
|
|
|||||||
| Real estate inventory impairments (1): |
||||||||||||
| West |
$ | 3,797 | $ | 274 | $ | 18,459 | ||||||
| Central |
1,610 | 4,809 | 16,744 | |||||||||
| East |
696 | 321 | 5,334 | |||||||||
|
|
|
|
|
|
|
|||||||
| Total |
$ | 6,103 | $ | 5,404 | $ | 40,537 | ||||||
|
|
|
|
|
|
|
|||||||
| Impairments of joint venture investments: |
||||||||||||
| West |
$ | 0 | $ | 295 | $ | 274 | ||||||
| Central |
0 | 0 | 2,558 | |||||||||
| East |
0 | 0 | 0 | |||||||||
|
|
|
|
|
|
|
|||||||
| Total |
$ | 0 | $ | 295 | $ | 2,832 | ||||||
|
|
|
|
|
|
|
|||||||
| Impairments of land held for sale: |
||||||||||||
| West |
$ | 5,928 | $ | 0 | $ | 7,815 | ||||||
| Central |
127 | 17 | 6,911 | |||||||||
| East |
399 | 0 | 0 | |||||||||
|
|
|
|
|
|
|
|||||||
| Total |
$ | 6,454 | $ | 17 | $ | 14,726 | ||||||
|
|
|
|
|
|
|
|||||||
| Total impairments: |
||||||||||||
| West |
$ | 10,588 | $ | 569 | $ | 33,586 | ||||||
| Central |
3,641 | 5,856 | 86,858 | |||||||||
| East |
1,095 | 321 | 8,604 | |||||||||
|
|
|
|
|
|
|
|||||||
| Total |
$ | 15,324 | $ | 6,746 | $ | 129,048 | ||||||
|
|
|
|
|
|
|
|||||||
| (1) | Included in the real estate inventory impairments are impairments of individual homes in a community where the underlying community was not also impaired, as follows (in thousands): |
| Years Ended December 31, | ||||||||||||
| 2011 | 2010 | 2009 | ||||||||||
| Individual home impairments: |
||||||||||||
| West |
$ | 700 | $ | 274 | $ | 7,969 | ||||||
| Central |
1,149 | 2,912 | 6,136 | |||||||||
| East |
341 | 321 | 3,208 | |||||||||
|
|
|
|
|
|
|
|||||||
| Total |
$ | 2,190 | $ | 3,507 | $ | 17,313 | ||||||
|
|
|
|
|
|
|
|||||||
63
The tables below reflect the number of communities with real estate inventory impairments for the years ended December 31, 2011, 2010 and 2009, excluding home-specific impairments (as noted above) and the fair value of these communities (dollars in thousands):
| Number of
Communities Impaired |
Impairment Charges |
Fair Value of
Communities Impaired (Carrying Value less Impairments) |
||||||||||
| Year Ended December 31, 2011 | ||||||||||||
| West |
5 | $ | 3,097 | $ | 19,963 | |||||||
| Central |
8 | 461 | 17,104 | |||||||||
| East |
1 | 355 | 2,006 | |||||||||
|
|
|
|
|
|
|
|||||||
| Total |
14 | $ | 3,913 | $ | 39,073 | |||||||
|
|
|
|
|
|
|
|||||||
| Year Ended December 31, 2010 | ||||||||||||
| West |
0 | $ | 0 | $ | N/A | |||||||
| Central |
7 | 1,897 | 13,073 | |||||||||
| East |
0 | 0 | N/A | |||||||||
|
|
|
|
|
|
|
|||||||
| Total |
7 | $ | 1,897 | $ | 13,073 | |||||||
|
|
|
|
|
|
|
|||||||
| Year Ended December 31, 2009 | ||||||||||||
| West |
12 | $ | 10,490 | $ | 43,542 | |||||||
| Central |
17 | 10,608 | 28,845 | |||||||||
| East |
6 | 2,126 | 7,476 | |||||||||
|
|
|
|
|
|
|
|||||||
| Total |
35 | $ | 23,224 | $ | 79,863 | |||||||
|
|
|
|
|
|
|
|||||||
Subject to sufficient qualifying assets, we capitalize our development period interest costs incurred in connection with the development and construction of real estate. Capitalized interest is allocated to real estate when incurred and charged to cost of closings when the related property is delivered. A summary of our capitalized interest is as follows (in thousands):
| Years Ended December 31, | ||||||||
| 2011 | 2010 | |||||||
| Capitalized interest, beginning of year |
$ | 11,679 | $ | 14,187 | ||||
| Interest incurred |
43,393 | 43,442 | ||||||
| Interest expensed |
(30,399 | ) | (33,722 | ) | ||||
| Interest amortized to cost of home, land closings and impairments |
(9,863 | ) | (12,228 | ) | ||||
|
|
|
|
|
|||||
| Capitalized interest, end of year (1) |
$ | 14,810 | $ | 11,679 | ||||
|
|
|
|
|
|||||
| (1) | Approximately $750,000 of the capitalized interest is related to our joint venture investments and is a component of “Investments in unconsolidated entities” in our consolidated balance sheet as of December 31, 2011 and 2010. |
NOTE 3 — VARIABLE INTEREST ENTITIES AND CONSOLIDATED REAL ESTATE NOT OWNED
We enter into option and purchase agreements for land or lots as part of the normal course of business. These option and purchase agreements enable us to acquire properties at one or multiple future dates at pre-determined prices. We believe these acquisition structures reduce our financial risk associated with land acquisitions and holdings and allow us to better maximize our cash position.
Based on the provisions of the relevant accounting guidance, we have concluded that when we enter into an option or purchase agreement to acquire land or lots from an entity, a variable interest entity, or “VIE”, may be created. We evaluate all option and purchase agreements for land to determine whether they are a VIE. ASC 810, Consolidations, requires that for each VIE, we assess whether we are the primary beneficiary and, if we are, we consolidate the VIE in our financial statements and reflect such assets and liabilities as “Real estate not owned.” The liabilities related to consolidated VIEs are excluded from our debt covenant calculations. We had no such consolidated VIEs at December 31, 2011. At December 31, 2010, we had $866,000 of assets identified as “Real estate not owned”.
In order to assess if we are the primary beneficiary, we must first determine if we have the ability to control the activities of the VIE that most significantly impact its economic performance. Such activities include, but are not limited to, the ability to determine the budget and scope of land development work, if any; the ability to control financing decisions for the VIE;
64
the ability to acquire additional land into the VIE or dispose of land in the VIE not under contract with Meritage; and the ability to change or amend the existing option contract with the VIE. If we are not determined to control such activities, we are not considered the primary beneficiary of the VIE. If we do have the ability to control such activities, we will continue our analysis by determining if we are also expected to absorb a potentially significant amount of the VIE’s losses or, if no party absorbs the majority of such losses, if we will benefit from a potentially significant amount of the VIE’s expected gains.
In substantially all cases, creditors of the entities with which we have option agreements have no recourse against us and the maximum exposure to loss in our option agreements is limited to non-refundable option deposits and any capitalized pre-acquisition costs. Often, we are at risk for items over budget related to land development on property we have under option if we are the land developer. In these cases, we have contracted to complete development at a fixed cost on behalf of the land owner and any budget savings or shortfalls are borne by us. Some of our option deposits may be refundable to us if certain contractual conditions are not performed by the party selling the lots.
The table below presents a summary of our lots under option at December 31, 2011 (dollars in thousands):
| Number of Lots |
Purchase Price |
Option/ Earnest Money Deposits–Cash |
||||||||||
| Option contracts recorded on balance sheet as real estate not owned (1) |
0 | $ | 0 | $ | 0 | |||||||
| Option contracts not recorded on balance sheet — non-refundable deposits, committed (1) |
1,876 | 98,245 | 9,790 | |||||||||
| Purchase contracts not recorded on balance sheet — non-refundable deposits, committed (1) |
512 | 40,918 | 4,636 | |||||||||
| Purchase contracts not recorded on balance sheet — refundable deposits, committed |
447 | 18,600 | 441 | |||||||||
|
|
|
|
|
|
|
|||||||
| Total committed (on and off balance sheet) |
2,835 | 157,763 | 14,867 | |||||||||
|
|
|
|
|
|
|
|||||||
| Purchase contracts not recorded on balance sheet — refundable deposits, uncommitted (2) |
680 | 17,316 | 341 | |||||||||
|
|
|
|
|
|
|
|||||||
| Total uncommitted |
680 | 17,316 | 341 | |||||||||
|
|
|
|
|
|
|
|||||||
| Total lots under option or contract |
3,515 | 175,079 | 15,208 | |||||||||
|
|
|
|
|
|
|
|||||||
| Total option contracts not recorded on balance sheet |
3,515 | $ | 175,079 | $ | 15,208 | (3) | ||||||
|
|
|
|
|
|
|
|||||||
| (1) | Deposits are non-refundable except if certain contractual conditions are not performed by the selling party. |
| (2) | Deposits are refundable at our sole discretion. We have not completed our acquisition evaluation process and we have not internally committed to purchase these lots. |
| (3) | Amount is reflected in our consolidated balance sheet in the line item “Deposits on real estate under option or contract” as of December 31, 2011. |
Generally, our options to purchase lots remain effective so long as we purchase a pre-established minimum number of lots each month or quarter, as determined by the respective agreement. Although the pre-established number is typically structured to approximate our expected rate of home construction starts, during a weakened homebuilding market, as we have experienced over the last several years, we may purchase lots at an absorption level that exceeds our sales and home starts pace needed to meet the pre-established minimum number of lots or restructure our original contract to terms that more accurately reflect our revised sales pace expectations.
65
NOTE 4 — SENIOR AND SENIOR SUBORDINATED NOTES AND LETTERS OF CREDIT FACILITIES
Senior and senior subordinated notes consist of the following (in thousands):
| At December 31, 2011 |
At December 31, 2010 |
|||||||
| 6.25% senior notes due 2015. At December 31, 2011 and 2010, there was approximately $451 and $594 in unamortized discount, respectively |
284,549 | 284,406 | ||||||
| 7.731% senior subordinated notes due 2017 |
125,875 | 125,875 | ||||||
| 7.15% senior notes due 2020. At December 31, 2011 and 2010, there was approximately $4,015 and $4,501 in unamortized discount, respectively |
195,985 | 195,499 | ||||||
|
|
|
|
|
|||||
| $ | 606,409 | $ | 605,780 | |||||
|
|
|
|
|
|||||
The indentures for our 6.25% senior notes and 7.731% senior subordinated notes contain covenants that require maintenance of certain minimum financial ratios, place limitations on investments we can make, and the payment of dividends and redemptions of equity, and limit the incurrence of additional indebtedness, asset dispositions, mergers, certain investments and creations of liens, among other items. As of December 31, 2011, we believe we were in compliance with our covenants. The indenture for our 7.15% senior notes contains covenants including, among others, limitations on the amount of secured debt we may incur, and limitations on sale and leaseback transactions and mergers. The covenants contained in the 7.15% senior notes are generally no more restrictive, and in many cases less restrictive, than the covenants contained in the indentures for the 6.25% senior notes and 7.731% senior subordinated notes.
Obligations to pay principal and interest on the senior and senior subordinated notes are guaranteed by all of our wholly-owned subsidiaries (collectively, the “Guarantor Subsidiaries”), each of which is directly or indirectly 100% owned by Meritage Homes Corporation. Such guarantees are full and unconditional, and joint and several. We do not provide separate financial statements of the Guarantor Subsidiaries because Meritage (the parent company) has no independent assets or operations and the guarantees are full and unconditional and joint and several,. Subsidiaries of Meritage Homes Corporation that are non-guarantor subsidiaries, if any, are, individually and in the aggregate, minor. There are no significant restrictions on the ability of the Company or any Guarantor Subsidiary to obtain funds from their respective subsidiaries, as applicable, by dividend or loan.
During 2010, we completed an offering of $200 million aggregate principal amount of 7.15% senior notes due 2020. The notes were issued at a 97.567% discount to par value. Concurrent with the issuance of the 2020 notes, we repurchased all of our $130 million 7.0% senior notes maturing 2014 and $65 million of our 6.25% senior notes maturing 2015. In connection with these transactions, we recorded a $3.5 million net loss on early extinguishment of debt, which is reflected in our statement of operations for the year ending December 31, 2010.
During 2009, we retired $24.1 million of 7.731% senior subordinated notes maturing in 2017 by issuing approximately 783,000 shares of our common stock in privately-negotiated transactions at an average 41% discount from the face value of the notes, resulting in a $9.4 million gain on early extinguishment of debt for the year ending December 31, 2009.
Scheduled principal maturities of our senior and subordinated notes as of December 31, 2011 follow (in thousands):
| Year Ended December 31, |
||||
| 2012 |
$ | 0 | ||
| 2013 |
0 | |||
| 2014 |
0 | |||
| 2015 |
285,000 | |||
| 2016 |
0 | |||
| Thereafter |
325,875 | |||
|
|
|
|||
| $ | 610,875 | |||
|
|
|
|||
The aggregate capacity of our secured letters of credit facilities is approximately $75.0 million. These outstanding letters of credit are secured by corresponding pledges of restricted cash accounts totaling $12.1 million and $9.3 million as of December 31, 2011 and 2010, respectively, and are reflected as restricted cash on our consolidated balance sheets.
66
NOTE 5 — FAIR VALUE DISCLOSURES
We account for non-recurring fair value measurements of our non-financial assets and liabilities in accordance with ASC 820-10 Fair Value Measurement and Disclosures. This guidance defines fair value, establishes a framework for measuring fair value and defines disclosures about fair value measurements. This standard establishes a three-level hierarchy for fair value measurements based upon the significant inputs used to determine fair value. Observable inputs are those which are obtained from market participants external to the company while unobservable inputs are generally developed internally, utilizing management’s estimates, assumptions and specific knowledge of the assets/liabilities and related markets. The three levels are defined as follows:
| • | Level 1 — Valuation is based on quoted prices in active markets for identical assets and liabilities. |
| • | Level 2 —Valuation is determined from quoted prices for similar assets or liabilities in active markets, quoted prices for identical or similar instruments in markets that are not active, or by model-based techniques in which all significant inputs are observable in the market. |
| • | Level 3 — Valuation is derived from model-based techniques in which at least one significant input is unobservable and based on the company’s own estimates about the assumptions that market participants would use to value the asset or liability. |
If the only observable inputs are from inactive markets or for transactions which the company evaluates as “distressed”, the use of Level 1 inputs should be modified by the company to properly address these factors, or the reliance of such inputs may be limited, with a greater weight attributed to Level 3 inputs.
A summary of our assets re-measured at fair value on December 31, 2011 and 2010 is as follows (in thousands):
| Year
Ended December 31, |
||||||||||||
| Hierarchy | 2011 | 2010 (2) | ||||||||||
| Description: |
||||||||||||
| Adjusted Basis of Long-Lived Real Estate Assets (1) |
Level 3 | $ | 68,179 | $ | 35,781 | |||||||
| Impairments |
$ | 15,324 | $ | 6,451 | ||||||||
| Initial Basis of Long-Lived Real Estate Assets |
$ | 83,503 | $ | 42,232 | ||||||||
| Adjusted Basis of Long-Term Other Assets |
Level 2 | $ | 952 | N/A | ||||||||
| Impairments |
$ | 848 | N/A | |||||||||
| Initial Basis of Other Assets |
$ | 1,800 | N/A | |||||||||
| (1) | The fair values in the table above represent only those real estate assets whose carrying values were adjusted in 2011 or 2010. |
| (2) | The carrying values for these communities may have increased or decreased from the fair value reported due to activities that have occurred since the measurement date. |
Financial Instruments: The fair value of our fixed-rate debt is derived from quoted market prices by independent dealers and is as follows (in thousands):
| December 31, 2011 | December 31, 2010 | |||||||||||||||
| Aggregate Principal |
Estimated
Fair Value |
Aggregate Principal |
Estimated
Fair Value |
|||||||||||||
| Financial Liabilities |
||||||||||||||||
| 6.25% senior notes |
$ | 285,000 | $ | 278,588 | $ | 285,000 | $ | 285,000 | ||||||||
| 7.731% senior subordinated notes |
$ | 125,875 | $ | 110,770 | $ | 125,875 | $ | 114,861 | ||||||||
| 7.15% senior notes |
$ | 200,000 | $ | 190,000 | $ | 200,000 | $ | 198,500 | ||||||||
Due to the short-term nature of other financial assets and liabilities, we consider the carrying amounts of our other short-term financial instruments to approximate fair value.
67
NOTE 6 — (LOSS)/EARNINGS PER SHARE
Basic and diluted (loss)/earnings per share for the years ended December 31, 2011, 2010 and 2009 were calculated as follows (in thousands, except per share amounts):
| 2011 | 2010 | 2009 | ||||||||||
| Basic weighted average number of shares outstanding |
32,382 | 32,060 | 31,350 | |||||||||
| Effect of dilutive securities: |
||||||||||||
| Options to acquire common stock and unvested restricted stock (1) |
0 | 262 | 0 | |||||||||
|
|
|
|
|
|
|
|||||||
| Diluted average shares outstanding |
32,382 | 32,322 | 31,350 | |||||||||
|
|
|
|
|
|
|
|||||||
| Net (loss)/income |
$ | (21,106 | ) | $ | 7,150 | $ | (66,456 | ) | ||||
|
|
|
|
|
|
|
|||||||
| Basic (loss)/earnings per share |
$ | (0.65 | ) | $ | 0.22 | $ | (2.12 | ) | ||||
|
|
|
|
|
|
|
|||||||
| Diluted (loss)/earnings per share |
$ | (0.65 | ) | $ | 0.22 | $ | (2.12 | ) | ||||
|
|
|
|
|
|
|
|||||||
| Antidilutive stock options not included in the calculation of diluted earnings per share |
1,731 | 699 | 2,128 | |||||||||
|
|
|
|
|
|
|
|||||||
| (1) | For periods with a net loss, basic weighted average shares outstanding is used for diluted calculations as required by GAAP because all options and non-vested shares outstanding are considered anti-dilutive. |
NOTE 7 — STOCK BASED COMPENSATION
We have a stock compensation plan, the Meritage Stock Option Plan (the “Plan”), that was adopted in 2006, and superceded a prior stock compensation plan which has been amended from time to time. The Plan was approved by our stockholders and is administered by our Board of Directors. The provisions of the Plan allow for the grant of stock appreciation rights, restricted stock awards, performance share awards and performance-based awards in addition to non-qualified and incentive stock options. The Plan authorizes awards to officers, key employees, non-employee directors and consultants for up to 7,750,000 shares of common stock, of which 724,381 shares remain available for grant at December 31, 2011. We believe that such awards provide a means of performance-based compensation to attract and retain qualified employees and better align the interests of our employees with those of our stockholders. Option awards are granted with an exercise price equal to the market price of Meritage stock at the date of grant, and generally have a five-year ratable vesting period and a seven-year contractual term. Restricted stock awards are usually granted with either a three-year or five-year ratable vesting period.
The fair value of option awards is estimated using a Black-Scholes option pricing model that uses the assumptions noted in the following table. Expected volatilities are based on a combination of implied volatilities from traded options on our stock and historical volatility of our stock. Expected term/life, which represents the period of time that options granted are expected to be outstanding, is estimated using historical data. The risk-free interest rate is based on the U.S. Treasury yield curve for the expected term of the grant. Groups of employees that have similar historical exercise behavior are considered separately for valuation purposes. We did not grant any stock options in 2010 or 2011.
| 2011 | 2010 | 2009 | ||||||||||
| Expected dividend yield |
N/A | N/A | 0 | % | ||||||||
| Risk-free interest rate |
N/A | N/A | 1.66 | % | ||||||||
| Expected volatility |
N/A | N/A | 86.60 | % | ||||||||
| Expected life (in years) |
N/A | N/A | 4 | |||||||||
| Weighted average fair value of options |
N/A | N/A | $ | 8.75 | ||||||||
68
Summary of Stock Option Activity:
| Year Ended December 31, 2011 | ||||||||||||||||
| Options | Weighted Average Exercise Price |
Weighted Average Remaining Contractual Life |
Aggregate Intrinsic Value |
|||||||||||||
| (In thousands) | ||||||||||||||||
| Options outstanding at beginning of year |
1,332,767 | $ | 23.80 | |||||||||||||
| Granted |
0 | N/A | ||||||||||||||
| Exercised |
(171,800 | ) | $ | 15.21 | ||||||||||||
| Cancelled |
(263,200 | ) | $ | 30.24 | ||||||||||||
|
|
|
|||||||||||||||
| Outstanding at end of year |
897,767 | $ | 23.56 | 2.98 | $ | 4,565 | ||||||||||
|
|
|
|||||||||||||||
| Vested and expected to vest at end of year |
880,167 | $ | 23.71 | 2.96 | $ | 4,435 | ||||||||||
| Exercisable at end of year |
550,359 | $ | 26.29 | 2.75 | $ | 2,316 | ||||||||||
| Price range of options exercised |
$ | 8.06 - $21.10 | ||||||||||||||
| Price range of options outstanding |
$ | 8.06 - $44.44 | ||||||||||||||
| Total shares reserved for existing or future grants at end of year |
2,782,405 | |||||||||||||||
| Years Ended December 31, | ||||||||||||||||
| 2010 | 2009 | |||||||||||||||
| Options | Weighted Average Exercise Price |
Options | Weighted Average Exercise Price |
|||||||||||||
| Options outstanding at beginning of year: |
1,620,167 | $ | 23.19 | 2,017,527 | $ | 24.16 | ||||||||||
| Granted |
0 | N/A | 369,500 | $ | 14.75 | |||||||||||
| Exercised |
(133,400 | ) | $ | 15.46 | (275,140 | ) | $ | 17.30 | ||||||||
| Cancelled |
(154,000 | ) | $ | 24.58 | (491,720 | ) | $ | 24.07 | ||||||||
|
|
|
|
|
|||||||||||||
| Outstanding at end of year |
1,332,767 | $ | 23.80 | 1,620,167 | $ | 23.19 | ||||||||||
|
|
|
|
|
|||||||||||||
| Exercisable at end of year |
740,376 | $ | 26.79 | 668,442 | $ | 26.83 | ||||||||||
| Price range of options exercised |
$ | 8.06 - $21.10 | $ | 8.06 - $19.30 | ||||||||||||
| Price range of options outstanding |
$ | 8.06 - $44.44 | $ | 8.06 - $44.44 | ||||||||||||
Stock options Outstanding at December 31, 2011:
| Stock Options Outstanding |
Stock Options Exercisable | |||||||||||||||||||
| Range of Exercise Prices |
Number Outstanding |
Weighted Average Contractual Life |
Weighted Average Exercise Price |
Number Exercisable |
Weighted Average Exercise Price |
|||||||||||||||
| $8.06 - $14.00 |
268,736 | 3.51 | $ | 13.71 | 101,622 | $ | 13.72 | |||||||||||||
| $15.98 - $15.98 |
208,214 | 2.93 | $ | 15.98 | 146,422 | $ | 15.98 | |||||||||||||
| $17.98 - $40.55 |
177,390 | 3.49 | $ | 20.95 | 103,054 | $ | 21.34 | |||||||||||||
| $42.82 - $42.82 |
242,427 | 2.07 | $ | 42.82 | 198,261 | $ | 42.82 | |||||||||||||
| $44.44 - $44.44 |
1,000 | 1.77 | $ | 44.44 | 1,000 | $ | 44.44 | |||||||||||||
|
|
|
|
|
|||||||||||||||||
| 897,767 | 550,359 | |||||||||||||||||||
|
|
|
|
|
|||||||||||||||||
69
The total intrinsic value of option exercises for the years ended December 31, 2011, 2010 and 2009 was $1.4 million, $0.8 million and $1.2 million, respectively. The intrinsic value of a stock option is the amount by which the market value of the underlying stock exceeds the exercise price of the stock option.
In addition to time-based restricted shares, in 2009 we began granting restricted shares with performance requirements to our executive management group. The 2009 awards vest in equal tranches over three years from the anniversary of the date of grant. The 2010 and 2011 awards vest in total on the third anniversary of the date of grant. All performance shares only vest upon the attainment of certain financial and operational criteria as established and approved by our Board of Directors
Summary of Nonvested (Restricted) Shares Activity:
| Nonvested Restricted Share Activity (time-based) |
Weighted Average Grant Date Fair Value |
Nonvested Restricted Share Activity (performance- Based) |
Weighted Average Grant Date Fair Value |
|||||||||||||
| Outstanding at 1/1/09 |
137,832 | $ | 44.93 | — | N/A | |||||||||||
| Granted |
234,000 | $ | 14.36 | 202,500 | $ | 14.27 | ||||||||||
| Vested (Earned/Released) |
(64,553 | ) | $ | 38.47 | — | N/A | ||||||||||
| Forfeited (2) |
(2,000 | ) | $ | 42.82 | — | N/A | ||||||||||
|
|
|
|
|
|
|
|
|
|||||||||
| Outstanding as of 12/31/09 |
305,279 | $ | 19.11 | 202,500 | $ | 14.27 | ||||||||||
| Granted |
315,000 | $ | 21.30 | 67,500 | $ | 22.18 | ||||||||||
| Vested (Earned/Released) |
(118,278 | ) | $ | 24.75 | (67,500 | ) | $ | 14.27 | ||||||||
| Forfeited (2) |
(36,750 | ) | $ | 20.99 | — | N/A | ||||||||||
|
|
|
|
|
|
|
|
|
|||||||||
| Outstanding at 12/31/10 |
465,251 | $ | 19.01 | 202,500 | $ | 16.91 | ||||||||||
| Granted |
357,000 | $ | 25.57 | 56,250 | $ | 25.65 | ||||||||||
| Vested (Earned/Released) (1) |
(141,335 | ) | $ | 17.76 | (33,750 | ) | $ | 14.27 | ||||||||
| Forfeited (2) |
(31,400 | ) | $ | 23.23 | (33,750 | ) | $ | 14.27 | ||||||||
|
|
|
|
|
|
|
|
|
|||||||||
| Outstanding at 12/31/11 |
649,516 | $ | 22.68 | 191,250 | $ | 20.41 | ||||||||||
|
|
|
|
|
|
|
|
|
|||||||||
| (1) | Amounts based on 2011 performance targets; shares to be released during the first quarter of 2012. |
| (2) | Forfeitures on time-based nonvested shares as a result of terminations of employment, while forfeitures on performance-based nonvested shares are a result of failing to attain certain goals as outlined in our executive management’s group compensation agreements. |
.
70
Compensation cost related to stock-based compensation arrangements granted under the Plans are recognized on a straight-line basis over the remaining respective vesting periods. Below is a summary of compensation expense and stock award activity (dollars in thousands):
| Twelve Months
Ended December 31, |
||||||||||||
| 2011 | 2010 | 2009 | ||||||||||
| Stock-based compensation expense |
$ | 7,410 | $ | 5,358 | $ | 6,204 | ||||||
| Cash Received from exercises |
$ | 2,613 | $ | 2,062 | $ | 4,753 | ||||||
The following table includes additional information regarding our Plans (dollars in thousands):
| As of | ||||||||
| December 31, 2011 | December 31, 2010 | |||||||
| Unrecognized stock-based compensation cost |
$ | 9,058 | $ | 7,816 | ||||
| Weighted average years remaining vesting period |
2.05 | 2.16 | ||||||
| Total equity awards outstanding (vested and unvested shares) |
1,738,533 | 2,000,518 | ||||||
NOTE 8 — INCOME TAXES
Components of income tax expense/(benefit) are as follows (in thousands):
| Years Ended December 31, | ||||||||||||
| 2011 | 2010 | 2009 | ||||||||||
| Current taxes: |
||||||||||||
| Federal |
$ | 0 | $ | (5,526 | ) | $ | (88,343 | ) | ||||
| State |
730 | 860 | 0 | |||||||||
|
|
|
|
|
|
|
|||||||
| 730 | (4,666 | ) | (88,343 | ) | ||||||||
|
|
|
|
|
|
|
|||||||
| Deferred taxes: |
||||||||||||
| Federal |
0 | 0 | 0 | |||||||||
| State |
0 | 0 | 0 | |||||||||
|
|
|
|
|
|
|
|||||||
| 0 | 0 | 0 | ||||||||||
|
|
|
|
|
|
|
|||||||
| Total |
$ | 730 | $ | (4,666 | ) | $ | (88,343 | ) | ||||
|
|
|
|
|
|
|
|||||||
Income taxes differ for the years ended December 31, 2011, 2010 and 2009, from the amounts computed using the expected federal statutory income tax rate of 35% as a result of the following (in thousands):
| Years Ended December 31, | ||||||||||||
| 2011 | 2010 | 2009 | ||||||||||
| Expected taxes at current federal statutory income tax rate |
$ | (7,132 | ) | $ | 869 | $ | (54,180 | ) | ||||
| State income taxes, net of federal tax benefit |
475 | 559 | (2,414 | ) | ||||||||
| Change in valuation allowance |
4,126 | (2,570 | ) | (34,494 | ) | |||||||
| Change in state effective tax rate |
1,750 | 0 | 0 | |||||||||
| Recognition of tax benefits |
0 | (4,592 | ) | 0 | ||||||||
| Non-deductible costs and other |
1,511 | 1,068 | 2,745 | |||||||||
|
|
|
|
|
|
|
|||||||
| Income tax expense/(benefit) |
$ | 730 | $ | (4,666 | ) | $ | (88,343 | ) | ||||
|
|
|
|
|
|
|
|||||||
Due to the effects of the deferred tax asset valuation allowance, carrybacks of net operating losses (“NOLs”), and changes in unrecognized tax benefits, the effective tax rates in 2011, 2010 and 2009 are not meaningful percentages as there is no correlation between the effective tax rates and the amount of pretax income or losses for those periods.
71
Deferred tax assets and liabilities have been recognized in the consolidated balance sheets due to the following temporary differences at December 31 (in thousands):
| 2011 | 2010 | |||||||
| Deferred tax assets: |
||||||||
| Real estate |
$ | 30,381 | $ | 30,537 | ||||
| Goodwill |
12,485 | 15,536 | ||||||
| Warranty reserve |
13,983 | 13,028 | ||||||
| Wages payable |
892 | 804 | ||||||
| Reserves and allowances |
793 | 493 | ||||||
| Equity-based compensation |
4,317 | 3,587 | ||||||
| Accrued expenses |
3,826 | 5,050 | ||||||
| Net operating loss carry-forwards |
32,130 | 25,585 | ||||||
| State franchise taxes |
0 | 301 | ||||||
|
|
|
|
|
|||||
| Total deferred tax assets |
98,807 | 94,921 | ||||||
| Valuation allowance |
(94,125 | ) | (89,999 | ) | ||||
|
|
|
|
|
|||||
| Total deferred tax assets net of valuation allowance |
4,682 | 4,922 | ||||||
|
|
|
|
|
|||||
| Deferred tax liabilities: |
||||||||
| Deferred revenue |
3,623 | 3,729 | ||||||
| Prepaids |
519 | 210 | ||||||
| Fixed assets |
474 | 835 | ||||||
| Other |
66 | 148 | ||||||
|
|
|
|
|
|||||
| Total deferred tax liabilities |
4,682 | 4,922 | ||||||
|
|
|
|
|
|||||
| Net deferred tax asset |
$ | 0 | $ | 0 | ||||
|
|
|
|
|
|||||
The following is a tabular reconciliation of the total amounts of unrecognized tax benefits for the years ended December 31 (in thousands):
| 2011 | 2010 | |||||||
| Beginning of year |
$ | 0 | $ | 4,592 | ||||
| Increases of prior year items |
0 | 100 | ||||||
| Decreases due to lapse of statute of limitations |
0 | (4,692 | ) | |||||
|
|
|
|
|
|||||
| End of year |
$ | 0 | $ | 0 | ||||
|
|
|
|
|
|||||
At December 31, 2011, we have no unrecognized tax benefits due to the lapse of the statue of limitations and completion of audits in prior years. We believe that our current income tax filing positions and deductions will be sustained on audit and do not anticipate any adjustments that will result in a material change. Our policy is to accrue interest and penalties on unrecognized tax benefits and include them in federal income tax expense.
In accordance with ASC 740-10, Income Taxes, we evaluate our deferred tax assets, including the benefit from NOLs, to determine if a valuation allowance is required. Companies must assess whether a valuation allowance should be established based on the consideration of all available evidence using a “more likely than not” standard with significant weight being given to evidence that can be objectively verified. This assessment considers, among other matters, the nature, frequency and severity of current and cumulative losses, forecasts of future profitability, the length of statutory carryforward periods, our experience with operating losses and our experience of utilizing tax credit carryforwards and tax planning alternatives. Based upon a review of all available evidence, we recorded a full valuation allowance against our deferred tax assets during 2008. We continue to maintain a full non-cash valuation allowance against the entire amount of our remaining net deferred tax assets at December 31, 2011 as we have determined that the weight of the negative evidence exceeds that of the positive evidence and it continues to be more likely than not that we will not be able to utilize all of our deferred tax assets and NOL carryovers.
At December 31, 2011 and 2010, we had a valuation allowance of $94.1 million ($70.2 million federal and $23.9 million state) and $90.0 million ($63.4 million federal and $26.6 million state), respectively, against deferred tax assets which include the tax benefit from NOL carryovers. Our future deferred tax asset realization depends on sufficient taxable income in the carryforward periods under existing tax laws. Federal net operating loss carryforwards may be used to offset future taxable income for 20 years and begin to expire in 2030. State net operating loss carryforwards may be used to offset future taxable income for a period of time ranging from 5 to 20 years, depending on the state, and begin to expire in 2012. Deferred tax assets include tax-effected federal and state net operating loss carryforwards of $32.1 million and $25.6 million in 2011 and 2010, respectively. On an ongoing basis, we will continue to review all available evidence to determine if and when we expect to realize our deferred tax assets and NOL carryovers.
72
We conduct business and are subject to tax in the U.S. and several states. With few exceptions, we are no longer subject to U.S. federal, state, or local income tax examinations by taxing authorities for years prior to 2007. We are not subject to any federal or state income tax examinations at this time. The federal tax audit that began in 2008 was expanded to include 2004 through 2009 due to our carryback of the 2009 net operating loss to prior tax years. The federal audit was completed in 2010. Unrelated to the federal audit, we amended our 2006 federal and state tax returns. Additional tax and interest on the amended 2006 returns are expected to offset the federal audit benefit. Taken together, we do not believe there will be a material effect on our deferred tax assets, which are subject to a full valuation allowance.
The tax benefits from the Company’s net operating losses, built-in losses, and tax credits would be materially reduced or potentially eliminated if the Company experienced an “ownership change” as defined under IRC §382. Based on the Company’s analysis performed as of December 31, 2011, the Company does not believe that it has experienced an ownership change as of December 31, 2011. As a protective measure, our stockholders held a Special Meeting of Stockholders on February 16, 2009 and approved an amendment to our Articles of Incorporation that restricts certain transfers of our common stock. The amendment helps us avoid an unintended ownership change and thereby preserve the value of our tax benefits for future utilization.
NOTE 9 — SUPPLEMENTAL DISCLOSURE OF CASH FLOW INFORMATION
The following table presents certain supplemental cash flow information (in thousands):
| 2011 | 2010 | 2009 | ||||||||||
| Cash paid during the year for: |
||||||||||||
| Interest, net of interest capitalized |
$ | 28,871 | $ | 31,971 | $ | 32,462 | ||||||
| Income taxes |
$ | 759 | $ | 4,915 | $ | 17 | ||||||
| Non-cash operating activities (decrease)/increase: |
||||||||||||
| Real estate not owned |
$ | (866 | ) | $ | (9,661 | ) | $ | 4,765 | ||||
| Non-cash investing activities: |
||||||||||||
| Distributions from unconsolidated entities |
$ | 0 | $ | 294 | $ | 279 | ||||||
| Non-cash financing activities: |
||||||||||||
| Equity issued for debt extinguishment |
$ | 0 | $ | 0 | $ | 14,320 | ||||||
NOTE 10 — RELATED PARTY TRANSACTIONS
From time to time, in the normal course of business, we have transacted with related or affiliated companies and with certain of our officers and directors. We believe that the terms and fees negotiated for all transactions listed below are no less favorable than those that could be negotiated in arm’s length transactions.
During 2009, we entered into an FDIC insured bank deposit account agreement with Alliance Bank of Arizona (“Alliance Bank”) through the Certificate of Deposit Account Registry Service (“CDARS”). CDARS is an accepted and recognized service through which participating banks may accept and provide FDIC insurance coverage for large deposits that would otherwise exceed FDIC insurance limits (currently $250,000) by placing, as custodian for the deposit customer (Meritage), that portion of the deposit exceeding FDIC insurance limits with other CDARS banks participating in the program such that for FDIC insurance purposes, the deposit is divided into insured amounts and deposited with other network banks to allow for full FDIC coverage. At December 31, 2011 and 2010, we placed cash deposits in the aggregate amount of $149.4 million and $89.3 million, respectively, through Alliance Bank as the CDARS custodian or relationship bank. Alliance Bank has divided this amount into FDIC insured amounts deposited with other CDARS participating FDIC insured institutions. We do not pay any separate fees to Alliance Bank for this program. Rather, Alliance Bank receives a small fee from the other CDARS institutions for certain funds placed. Robert Sarver, a Meritage director, is a director and the chief executive officer of Western Alliance Bancorporation, the parent company of Alliance Bank. In addition, Steven Hilton, our Chairman and CEO is also a director of Western Alliance Bancorporation. We earned market-rate interest on deposits placed with Western Alliance Bancorporation pursuant to the CDARS program of $767,000 and $653,000 in 2011 and 2010, respectively.
73
NOTE 11 — OPERATING AND REPORTING SEGMENTS
As defined in ASC 280-10, Segment Reporting, we have seven operating segments (the seven states in which we operate). These segments are engaged in the business of acquiring and developing land, constructing homes, marketing and selling those homes and providing warranty and customer services. We aggregate our operating segments into a reporting segment based on similar long-term economic characteristics and geographical proximity. Our reportable homebuilding segments are as follows:
West: California and Nevada
Central: Texas, Arizona and Colorado
East: Florida and North Carolina
Management’s evaluation of segment performance is based on segment operating income/(loss), which we define as homebuilding and land revenues less cost of home construction, commissions and other sales costs, land development and other land sales costs and other costs incurred by or allocated to each segment, including impairments. Each reportable segment follows the same accounting policies described in Note 1, “Business and Summary of Significant Accounting Policies.” Operating results for each segment may not be indicative of the results for such segment had it been an independent, stand-alone entity for the periods presented. The following segment information is in thousands:
| Year Ended December 31, | ||||||||||||
| 2011 | 2010 | 2009 | ||||||||||
| Revenue (1): |
||||||||||||
| West |
$ | 132,912 | $ | 163,200 | $ | 146,151 | ||||||
| Central |
628,991 | 693,984 | 771,822 | |||||||||
| East |
99,341 | 84,472 | 52,340 | |||||||||
|
|
|
|
|
|
|
|||||||
| Consolidated total |
861,244 | 941,656 | 970,313 | |||||||||
| Operating income/(loss) (2): |
||||||||||||
| West |
(8,612 | ) | 9,479 | (35,713 | ) | |||||||
| Central |
24,691 | 33,133 | (61,924 | ) | ||||||||
| East |
6,858 | 8,924 | (12,971 | ) | ||||||||
|
|
|
|
|
|
|
|||||||
| Segment operating income/(loss) |
22,937 | 51,536 | (110,608 | ) | ||||||||
| Corporate and unallocated costs (3) |
(20,925 | ) | (20,422 | ) | (23,485 | ) | ||||||
| Earnings from unconsolidated entities, net |
5,849 | 5,243 | 4,013 | |||||||||
| Interest expense |
(30,399 | ) | (33,722 | ) | (36,531 | ) | ||||||
| (Loss)/gain on extinguishment of debt, net of transaction costs |
0 | (3,454 | ) | 9,390 | ||||||||
| Other income, net |
2,162 | 3,303 | 2,422 | |||||||||
|
|
|
|
|
|
|
|||||||
| Net(loss)/income before income taxes |
$ | (20,376 | ) | $ | 2,484 | $ | (154,799 | ) | ||||
|
|
|
|
|
|
|
|||||||
| (1) | Revenue includes the following land closing revenue, by segment: 2011 – $360,000 in the Central Region; 2010 – $1.3 million in the Central Region; 2009 – $2.9 million in the West Region and $4.6 million in the Central Region. |
| (2) | See Note 2 to these consolidated financial statements for breakout of real estate-related impairment by Region. |
| (3) | Balance consists primarily of corporate costs and numerous shared service functions that are not allocated to the reporting segments. |
74
| At December 31, 2011 | ||||||||||||||||||||
| West | Central | East | Corporate and Unallocated (1) |
Total | ||||||||||||||||
| Deposits on real estate under option or contract |
$ | 3,216 | $ | 11,158 | $ | 834 | $ | 0 | $ | 15,208 | ||||||||||
| Real estate |
207,656 | 529,885 | 77,884 | 0 | 815,425 | |||||||||||||||
| Investments in unconsolidated entities |
176 | 10,245 | 14 | 653 | 11,088 | |||||||||||||||
| Other assets |
8,911 | 90,532 | 8,842 | 271,372 | 379,657 | |||||||||||||||
|
|
|
|
|
|
|
|
|
|
|
|||||||||||
| Total assets |
$ | 219,959 | $ | 641,820 | $ | 87,574 | $ | 272,025 | $ | 1,221,378 | ||||||||||
|
|
|
|
|
|
|
|
|
|
|
|||||||||||
| At December 31, 2010 | ||||||||||||||||||||
| West | Central | East | Corporate and Unallocated (1) |
Total | ||||||||||||||||
| Deposits on real estate under option or contract |
$ | 50 | $ | 9,754 | $ | 555 | $ | 0 | $ | 10,359 | ||||||||||
| Real estate |
191,882 | 499,176 | 47,870 | 0 | 738,928 | |||||||||||||||
| Investments in unconsolidated entities |
110 | 10,507 | 29 | 341 | 10,987 | |||||||||||||||
| Other assets |
3,501 | 32,961 | 7,873 | 420,329 | 464,664 | |||||||||||||||
|
|
|
|
|
|
|
|
|
|
|
|||||||||||
| Total assets |
$ | 195,543 | $ | 552,398 | $ | 56,327 | $ | 420,670 | $ | 1,224,938 | ||||||||||
|
|
|
|
|
|
|
|
|
|
|
|||||||||||
| (1) | Balance consists primarily of cash and other corporate assets not allocated to the reporting segments. |
NOTE 12 — COMMITMENTS AND CONTINGENCIES
We are involved in various routine legal proceedings incidental to our business, some of which are covered by insurance. With respect to the majority of pending litigation matters, our ultimate legal and financial responsibility, if any, cannot be estimated with certainty and, in most cases, any potential losses related to those matters are not considered probable. We evaluate our litigation reserves at least quarterly and, as appropriate, adjust them to reflect (i) facts and circumstances known to us at the time; (ii) advice and analyses of outside counsel (if applicable); and (iii) assumptions and judgment of management. We have reserved approximately $10.2 million related to litigation and asserted claims where our ultimate exposure is considered probable and the potential loss can be reasonably estimated, which is classified within accrued liabilities, “other” accruals, on our December 31, 2011 balance sheet. Additionally, we have $23.1 million of warranty reserves, primarily relating to general customer warranty claims and the correction of home construction defects. Historically, most of these matters are resolved prior to litigation. We believe that none of these matters will have a material adverse impact upon our consolidated financial condition, results of operations, or cash flows.
Joint Venture Litigation
We are a defendant in litigation filed by the lenders related to a project commonly known as “South Edge” or “Inspirada”, and we are also an appellant of an appeal relating to an arbitration proceeding instituted by a co-venturer in the project. The project involves a large master-planned community located in Henderson, Nevada, which was acquired by an unconsolidated joint venture with capital supplied by the co-venturers, and a syndicated loan on the project. In connection with the loan obtained by the venture, we provided various narrowly crafted guarantees (including a repayment guarantee that could only be triggered upon a “bankruptcy event”) relating to the project, covering our 3.53% pro rata amount of the project financing.
On December 9, 2010, three of the lenders filed a petition seeking to place the venture into an involuntary bankruptcy (JP Morgan Chase Bank, N.A. v. South Edge, LLC (Case No. 10-32968-bam)). On June 6, 2011, we received a demand letter from the lenders, requesting full payment of $13.2 million the lenders claimed to be owed under the springing repayment guarantee, including past-due interest and penalties. The lenders claim that an involuntary bankruptcy filed by three of the lenders triggered the “springing” repayment guarantee. We do not believe the lenders have an enforceable position associated with their $13.2 million claim and do not believe we will be required to pay such amount because, among other reasons, the lenders breached their contract with us by refusing to accept the April 2008 tender of our performance and by refusing to release their lien in connection with our second and final takedown in this project and we do not believe the repayment guarantee was triggered by the lenders’ filing of the involuntary bankruptcy. As a result, on August 19, 2011, we filed a lawsuit against JP Morgan Chase Bank, NA (“JP Morgan”) in the Court of Common Pleas in Franklin County, Ohio (Case No. 11CVH0810353) regarding the repayment guarantee. In reaction to that lawsuit, on August 25, 2011, JP Morgan filed a lawsuit against us in the US District Court of Nevada regarding most of the same issues addressed in the Ohio litigation (Case No. 2: 11-CV-01364-PMP). On October 26, 2011, the Bankruptcy Court approved a Plan pursuant to which the lenders have received all payment they are entitled to. The project has been conveyed to an entity owned by four of the co-
75
venturers in the South Edge entity (KB Home, Toll Brothers, Pardee Homes and Beazer Homes) and pursuant to which the four co-venturer builders claim to have succeeded to the lenders’ repayment guarantee claim against Meritage. As a result, it is anticipated that the pending lawsuits regarding repayment guarantee claims will be litigated between those four builders, JP Morgan, and us, and the arbitration appeal claim will be litigated between those four builders and us. In connection with the on-going legal proceedings, we have established reserves for amounts that we believe are appropriate for both potential settlements and legal costs. The amount we have reserved is less than the aggregate amount of our repayment guaranty and our pro rata share of a damage claim entered in the arbitration proceeding that is currently subject to appeal, because it takes into account: (i) defenses we believe we possess, many of which are unique to our position in the venture, as well as (ii) potential claims, defenses and offsets we may have against the joint venture, the lenders, and our co-venturers. At December 31, 2011, our maximum pro rata exposure under the repayment guarantee was $13.2 million. Our 3.53% investment in the venture has been previously fully impaired. We do not believe that the ultimate disposition of these matters will have a material adverse affect on our financial condition.
We lease office facilities, model homes and equipment under various operating lease agreements. Approximate future minimum lease payments for non-cancelable operating leases as of December 31, 2011, are as follows (in thousands):
| Years Ended December 31, |
||||
| 2012 |
$ | 6,440 | ||
| 2013 |
6,204 | |||
| 2014 |
2,329 | |||
| 2015 |
334 | |||
| 2016 |
0 | |||
| Thereafter |
0 | |||
|
|
|
|||
| $ | 15,307 | |||
|
|
|
|||
Rent expense approximated $6.1 million, $7.5 million and $9.7 million in 2011, 2010 and 2009, respectively, and is included within general and administrative expense or in commissions and other sales costs on our consolidated statements of operations. Included in our 2011 and 2010 results are $0.2 million and $0.6 million, respectively, of charges related to the early termination or vacant space expense for some of our facilities.
See Note 1 for contingencies related to our warranty obligations.
NOTE 13 — SELECTED QUARTERLY FINANCIAL DATA (UNAUDITED)
Quarterly results for the years ended December 31, 2011 and 2010 follow (in thousands, except per share amounts):
| First | Second | Third | Fourth | |||||||||||||
| 2011 |
||||||||||||||||
| Total closing revenue |
$ | 177,589 | $ | 220,131 | $ | 217,534 | $ | 245,990 | ||||||||
| Gross profit (1) |
$ | 30,389 | $ | 39,587 | $ | 37,943 | $ | 33,189 | ||||||||
| (Loss)/earnings before income taxes |
$ | (6,444 | ) | $ | 747 | $ | (3,075 | ) | $ | (11,604 | ) | |||||
| Net (loss)/earnings |
$ | (6,659 | ) | $ | 562 | $ | (3,235 | ) | $ | (11,774 | ) | |||||
| Per Share Data: |
||||||||||||||||
| Basic (loss)/earnings per share (2) |
$ | (0.21 | ) | $ | 0.02 | $ | (0.10 | ) | $ | (0.36 | ) | |||||
| Diluted (loss)/earnings per share (2) |
$ | (0.21 | ) | $ | 0.02 | $ | (0.10 | ) | $ | (0.36 | ) | |||||
| 2010 |
||||||||||||||||
| Total closing revenue |
$ | 201,804 | $ | 291,405 | $ | 233,803 | $ | 214,644 | ||||||||
| Gross profit (3) |
$ | 38,256 | $ | 52,896 | $ | 42,561 | $ | 33,983 | ||||||||
| Earnings/(loss) before income taxes |
$ | 2,781 | $ | 4,391 | $ | 731 | $ | (5,419 | ) | |||||||
| Net earnings/(loss) |
$ | 2,660 | $ | 4,166 | $ | 1,219 | $ | (895 | ) | |||||||
| Per Share Data: |
||||||||||||||||
| Basic earnings/(loss) per share (2) |
$ | 0.08 | $ | 0.13 | $ | 0.04 | $ | (0.03 | ) | |||||||
| Diluted earnings/(loss) per share (2) |
$ | 0.08 | $ | 0.13 | $ | 0.04 | $ | (0.03 | ) | |||||||
| (1) | In accordance with ASC 360-10 and as previously discussed in Note 1, in 2011 we recorded $6.1 million of inventory impairments, $2.8 million of option deposit and pre-acquisition write-offs, and $6.5 of impairments on land held for sale. |
| (2) | Due to the computation of earnings/(loss) per share, the sum of the quarterly amounts may not equal the full-year results. |
| (3) | In 2010 we recorded $5.4 million of inventory impairments, $1.0 million of option deposit and pre-acquisition write-offs, $295,000 of joint venture impairments and $17,000 of impairments on land held for sale. |
76
We typically experience seasonal variability in our quarterly operating results and capital requirements. Historically, we sell more homes in the first half of the year, which results in more working capital requirements and home closings in the third and fourth quarters. However, during the current economic downturn and the enactment and expiration of certain government incentives, our results may not follow our historical trends.
| Item 9. | Changes in and Disagreements with Accountants on Accounting and Financial Disclosure |
None
| Item 9A. | Controls and Procedures |
Management, including our Chief Executive Officer (“CEO”) and Chief Financial Officer (“CFO”), evaluated the effectiveness of the design and operation of our disclosure controls and procedures (as defined in Rules 13a-15(e) and 15d-15(e) under the Exchange Act). Based upon that evaluation, our CEO and CFO concluded that our disclosure controls and procedures were effective as of the end of the period covered by this report to ensure that information required to be disclosed in the reports we file and submit under the Exchange Act is recorded, processed, summarized and reported as and when required.
There was no change in our internal control over financial reporting (as defined in Rules 13a-15(f) and 15d-15(f) under the Exchange Act) identified in connection with the foregoing evaluation that occurred during our last fiscal quarter that has materially affected, or is reasonably likely to materially affect, our internal control over financial reporting.
77
Management’s Annual Report on Internal Control over Financial Reporting
Our management is responsible for establishing and maintaining adequate internal control over financial reporting, as such term is defined in Exchange Act Rule 13a-15(f). Internal control over financial reporting is a process to provide reasonable assurance regarding the reliability of our financial reporting and the preparation of financial statements for external purposes in accordance with accounting principles generally accepted in the United States. Because of its inherent limitations, internal control over financial reporting is not intended to provide absolute assurance that a misstatement of our financial statements would be prevented or detected. Also, projections of any evaluation of internal control effectiveness to future periods are subject to the risk that controls may become inadequate because of changes in conditions, or that the degree of compliance with internal control policies or procedures may deteriorate. Under the supervision and with the participation of our management, including our CEO and CFO, we conducted an evaluation of the effectiveness of our internal control over financial reporting based on the framework in Internal Control—Integrated Framework issued by the Committee of Sponsoring Organizations of the Treadway Commission. Based on this evaluation, our management concluded that our internal control over financial reporting was effective as of December 31, 2011. The effectiveness of our internal control over financial reporting as of December 31, 2011 has been audited by Deloitte & Touche LLP, an independent registered accounting firm, as stated in their attestation report, which is included herein.
78
REPORT OF INDEPENDENT REGISTERED PUBLIC ACCOUNTING FIRM
To the Board of Directors and Stockholders of
Meritage Homes Corporation
Scottsdale, Arizona
We have audited the internal control over financial reporting of Meritage Homes Corporation and subsidiaries (the “Company”) as of December 31, 2011, based on criteria established in Internal Control—Integrated Framework issued by the Committee of Sponsoring Organizations of the Treadway Commission. The Company’s management is responsible for maintaining effective internal control over financial reporting and for its assessment of the effectiveness of internal control over financial reporting, included in the accompanying Management’s Annual Report on Internal Control over Financial Reporting. Our responsibility is to express an opinion on the Company’s internal control over financial reporting based on our audit.
We conducted our audit in accordance with the standards of the Public Company Accounting Oversight Board (United States). Those standards require that we plan and perform the audit to obtain reasonable assurance about whether effective internal control over financial reporting was maintained in all material respects. Our audit included obtaining an understanding of internal control over financial reporting, assessing the risk that a material weakness exists, testing and evaluating the design and operating effectiveness of internal control based on the assessed risk, and performing such other procedures as we considered necessary in the circumstances. We believe that our audit provides a reasonable basis for our opinion.
A company’s internal control over financial reporting is a process designed by, or under the supervision of, the company’s principal executive and principal financial officers, or persons performing similar functions, and effected by the company’s board of directors, management, and other personnel to provide reasonable assurance regarding the reliability of financial reporting and the preparation of financial statements for external purposes in accordance with generally accepted accounting principles. A company’s internal control over financial reporting includes those policies and procedures that (1) pertain to the maintenance of records that, in reasonable detail, accurately and fairly reflect the transactions and dispositions of the assets of the company; (2) provide reasonable assurance that transactions are recorded as necessary to permit preparation of financial statements in accordance with generally accepted accounting principles, and that receipts and expenditures of the company are being made only in accordance with authorizations of management and directors of the company; and (3) provide reasonable assurance regarding prevention or timely detection of unauthorized acquisition, use, or disposition of the company’s assets that could have a material effect on the financial statements.
Because of the inherent limitations of internal control over financial reporting, including the possibility of collusion or improper management override of controls, material misstatements due to error or fraud may not be prevented or detected on a timely basis. Also, projections of any evaluation of the effectiveness of the internal control over financial reporting to future periods are subject to the risk that the controls may become inadequate because of changes in conditions, or that the degree of compliance with the policies or procedures may deteriorate.
In our opinion, the Company maintained, in all material respects, effective internal control over financial reporting as of December 31, 2011, based on the criteria established in Internal Control—Integrated Framework issued by the Committee of Sponsoring Organizations of the Treadway Commission.
We have also audited, in accordance with the standards of the Public Company Accounting Oversight Board (United States), the consolidated financial statements as of and for the year ended December 31, 2011 of the Company and our report dated February 24, 2012 expressed an unqualified opinion on those consolidated financial statements.
/s/ DELOITTE & TOUCHE LLP
Phoenix, Arizona
February 24, 2012
79
| Item 9B. | Reserved |
| Item 10. | Directors, Executive Officers and Corporate Governance |
Except as set forth herein, information required in response to this item is incorporated by reference from the information contained in our 2012 Proxy Statement (which will be filed with the Securities and Exchange Commission no later than 120 days following the Company’s fiscal year end). The information required by Item 10 regarding our executive officers appears in Part II, Item 5 of this Annual Report as permitted by General Instruction G(3).
| Item 11. | Executive Compensation |
Information required in response to this item is incorporated by reference to our 2012 Proxy Statement, which will be filed with the SEC within 120 days following the Company’s fiscal year end.
| Item 12. | Security Ownership of Certain Beneficial Owners and Management and Related Stockholder Matters |
Information required in response to this item is incorporated by reference from our 2012 Proxy Statement, which will be filed with the SEC within 120 days following the Company’s fiscal year end.
| Item 13. | Certain Relationships and Related Transactions, and Director Independence |
Information required in response to this item is incorporated by reference from our 2012 Proxy Statement, which will be filed with the SEC within 120 days following the Company’s fiscal year end.
| Item 14. | Principal Accountant Fees and Services |
Information required in response to this item is incorporated by reference from our 2012 Proxy Statement, which will be filed with the SEC within 120 days following the Company’s fiscal year end.
| Item 15. | Exhibits and Financial Statement Schedules |
| (a) | Financial Statements and Schedules |
| (i) | Financial Statements: |
| (1) | Report of Deloitte & Touche LLP |
| (2) | Consolidated Financial Statements and Notes to Consolidated Financial Statements of the Company, including Consolidated Balance Sheets as of December 31, 2011 and 2010 and related Consolidated Statements of Operations, Stockholders’ Equity and Cash Flows for each of the years in the three-year period ended December 31, 2011 |
| (ii) | Financial Statement Schedules: |
Schedules have been omitted because of the absence of conditions under which they are required or because the required information is included in the Consolidated Financial Statements or Notes thereto.
80
| (b) | Exhibits |
| Exhibit Number |
Description |
Page or Method of Filing | ||||
| 2.1 | Agreement and Plan of Reorganization, dated as of September 13, 1996, by and among Homeplex, the Monterey Merging Companies and the Monterey Stockholders | Incorporated by reference to Appendix A of Form S-4 Registration Statement No. 333-15937. | ||||
| 3.1 | Restated Articles of Incorporation of Meritage Homes Corporation | Incorporated by reference to Exhibit 3 of Form 8-K dated June 20, 2002. | ||||
| 3.1.1 | Amendment to Articles of Incorporation of Meritage Homes Corporation | Incorporated by reference to Exhibit 3.1 of Form 8-K dated September 15, 2004. | ||||
| 3.1.2 | Amendment to Articles of Incorporation of Meritage Homes Corporation | Incorporated by reference to Appendix A of the Proxy Statement for the 2006 Annual Meeting of Stockholders. | ||||
| 3.1.3 | Amendment to Articles of Incorporation of Meritage Homes Corporation | Incorporated by reference to Appendix B of Proxy Statement for the 2008 Annual Meeting of Stockholders. | ||||
| 3.1.4 | Amendment to Articles of Incorporation of Meritage Homes Corporation | Incorporated by reference to Appendix A of the Definitive Proxy Statement filed with the Securities and Exchange Commission on January 9, 2009. | ||||
| 3.2 | Amended and Restated Bylaws of Meritage Homes Corporation | Incorporated by reference to Exhibit 3.1 of Form 8-K dated August 21, 2007. | ||||
| 3.2.1 | Amendment to Amended and Restated Bylaws of Meritage Homes Corporation | Incorporated by reference to Exhibit 3.1 of Form 8-K filed on December 24, 2008. | ||||
| 3.2.2 | Amendment No. 2 to Meritage Homes Corporation Amended and Restated Bylaws | Incorporated by reference to Exhibit 3.1 of Form 8-K dated May 19, 2011. | ||||
| 4.1 | Form of Specimen of Common Stock Certificate | Incorporated by reference to Exhibit 4.1 of Form 10-K for the year ended December 31, 2007. | ||||
| 4.2 | Indenture dated March 10, 2005 (re 61/4% Senior Notes due 2015) and form of 6.25% Senior Notes due 2015 | Incorporated by reference to Exhibit 4.4 of Form 10-K for the year ended December 31, 2004. | ||||
| 4.2.1 | First Supplemental Indenture, dated April 18, 2005 (re 6.25% Senior Notes due 2015) | Incorporated by reference to Exhibit 4.1.1 of Form S-4 Registration Statement No. 333-123661. | ||||
| 4.2.2 | Second Supplemental Indenture, dated September 22, 2005 (re 6.25% Senior Notes due 2015) | Incorporated by reference to Exhibit 4.2 of Form 10-Q for the quarterly period ended September 30, 2005. | ||||
| 4.2.3 | Third Supplemental Indenture, dated July 10, 2007 (re 6.25% Senior Notes due 2015) | Incorporated by reference to Exhibit 4.3.3 of Form 10-K for the year ended December 31, 2008. | ||||
| 4.2.4 | Instrument of Resignation, Appointment and Acceptance, dated as of May 27, 2008 (re 7% Senior Notes due 2014 and 6.25% Senior Notes due 2015) | Incorporated by reference to Exhibit 4.1 of Form 8-K filed on May 28, 2008. | ||||
| 4.2.5 | Fourth Supplemental Indenture, dated March 6, 2009 (re 6.25% Senior Notes due 2015) | Incorporated by reference to Exhibit 4.2 of Form 10-Q for the quarter ended March 31, 2009. | ||||
| 4.2.6 | Fifth Supplemental Indenture (re 6.25% Senior Notes due 2015) | Incorporated by reference to Exhibit 4.1 of Form 10-Q for the quarter ended March 31, 2011). | ||||
81
| Exhibit Number |
Description |
Page or Method of Filing | ||||
| 4.2.7 | Sixth Supplemental Indenture (re 6.25% Senior Notes due 2015) | Filed herewith. | ||||
| 4.3 | Indenture, dated February 23, 2007 (re 7.731% Senior Subordinated Notes due 2017) | Incorporated by reference to Exhibit 4.1 of Form 8-K dated February 23, 2007. | ||||
| 4.3.1 | First Supplemental Indenture, dated July 10, 2007 (re 7.731% Senior Subordinated Notes due 2017) | Incorporated by reference to Exhibit 4.4.1 of Form 10-K for the year ended December 31, 2008. | ||||
| 4.3.2 | Instrument of Resignation, Appointment and Acceptance, dated as of May 27, 2008 (re 7.731% Senior Subordinated Notes due 2017) | Incorporated by reference to Exhibit 4.2 of Form 8-K filed on May 28, 2008. | ||||
| 4.3.3 | Second Supplemental Indenture, dated March 6, 2009 (re 7.731% Senior Subordinated Notes due 2017) | Incorporated by reference to Exhibit 4.1 of Form 10-Q for the quarter ended March 31, 2009 | ||||
| 4.3.4 | Third Supplemental Indenture (re 7.731% Senior Subordinated Noted due 2017) | Incorporated by reference to Exhibit 4.3 of Form 10-Q for the quarter ended March 31, 2011). | ||||
| 4.3.5 | Fourth Supplemental Indenture (re 7.731% Senior Subordinated Notes due 2017) | Filed herewith. | ||||
| 4.4 | Indenture, dated April 13, 2010 (re 7.15% Senior Notes due 2020) | Incorporated by reference to Exhibit 4.1 of Form 8-K filed on April 14, 2010 | ||||
| 4.4.1 | First Supplemental Indenture (re 7.15% Senior Notes due 2020) | Incorporated by reference to Exhibit 4.2 of Form 10-Q for the quarter ended March 31, 2011). | ||||
| 4.4.2 | Second Supplemental Indenture (re 7.15% Senior Notes due 2020) | Filed herewith. | ||||
| 10.1 | 2006 Annual Incentive Plan* | Incorporate by reference to Appendix B of the Proxy Statement for the 2010 Annual Meeting of Stockholders | ||||
| 10.2 | Amended 1997 Meritage Stock Option Plan * | Incorporated by reference to Exhibit 10.3 of Form 10-K for the year ended December 31, 2004. | ||||
| 10.3 | Meritage Homes Corporation 2006 Stock Incentive Plan, as amended * | Incorporated by reference to Exhibit 4.8 of Form S-8 Registration Statement No. 333-166991 | ||||
| 10.3.1 | Representative Form of Restricted Stock Agreement * | Incorporated by reference to Exhibit 4.9 of Form S-8 Registration Statement No. 333-166991. | ||||
| 10.3.2 | Representative Form of Restricted Stock Agreement (2006 Plan; Executive Officer) * | Incorporated by reference to Exhibit 4.9.1 of Form S-8 Registration Statement No. 333-166991 | ||||
| 10.3.3 | Representative Form of Restricted Stock Agreement (2006 Plan; Non-Employee Director) * | Incorporated by reference to Exhibit 4.9.2 of Form S-8 Registration Statement No. 333-166991 | ||||
| 10.3.4 | Representative Form of Non-Qualified Stock Option Agreement (2006 Plan) * | Incorporated by reference to Exhibit 4.10 of Form S-8 Registration Statement No. 333-166991 | ||||
| 10.3.5 | Representative Form of Incentive Stock Option Agreement (2006 Plan)* | Incorporated by reference to Exhibit 4.4 of Form S-8 Registration Statement No. 333-134637. | ||||
| 10.3.6 | Representative Form of Stock Appreciation Rights Agreement (2006 Plan)* | Incorporated by reference to Exhibit 4.5 of Form S-8 Registration Statement No. 333-134637. | ||||
| 10.4 | Third Amended and Restated Employment Agreement between the Company and Steven J. Hilton* | Incorporated by reference to Exhibit 10.1 of Form 8-K dated January 19, 2010. | ||||
82
| Exhibit Number |
Description |
Page or Method of Filing | ||||
| 10.4.1 | Third Amended and Restated Change of Control Agreement between the Company and Steven J. Hilton* | Incorporated by reference to Exhibit 10.5 of Form 8-K dated January 19, 2010. | ||||
| 10.5 | Third Amended and Restated Employment Agreement between the Company and Larry W. Seay* | Incorporated by reference to Exhibit 10.2 of Form 8-K dated January 19, 2010. | ||||
| 10.5.1 | Third Amended and Restated Change of Control Agreement between the Company and Larry W. Seay* | Incorporated by reference to Exhibit 10.6 of Form 8-K dated January 19, 2010. | ||||
| 10.6 | Amended and Restated Employment Agreement between the Company and Steven Davis* | Incorporated by reference to Exhibit 10.4 of Form 8-K dated January 19, 2010. | ||||
| 10.6.1 | Amended and Restated Change of Control Agreement between the Company and Steven Davis* | Incorporated by reference to Exhibit 10.8 of Form 8-K dated January 19, 2010. | ||||
| 10.7 | Amended and Restated Employment Agreement between the Company and C. Timothy White * | Incorporated by reference to Exhibit 10.3 of Form 8-K dated January 19, 2010. | ||||
| 10.7.1 | Amended and Restated Change of Control Agreement between the Company and C. Timothy White * | Incorporated by reference to Exhibit 10.7 of Form 8-K dated January 19, 2010. | ||||
| 21 | List of Subsidiaries | Filed herewith. | ||||
| 23.1 | Consent of Deloitte & Touche LLP | Filed herewith. | ||||
| 24 | Powers of Attorney | See Signature Page. | ||||
| 31.1 | Rule 13a-14(a)/15d-14(a) Certification of Steven J. Hilton, Chief Executive Officer | Filed herewith. | ||||
| 31.2 | Rule 13a-14(a)/15d-14(a) Certification of Larry W. Seay, Chief Financial Officer | Filed herewith. | ||||
| 32.1 | Section 1350 Certification of Chief Executive Officer and Chief Financial Officer | Filed herewith. | ||||
| 101 | The following financial statements from Meritage Homes Corporation Annual Report on Form 10-K for the year ended December 31, 2011, filed on February 24, 2012, formatted in XBRL (Extensible Business Reporting Language); (i) Consolidated Balance Sheets, (ii) Consolidated Statements of Operations, (iii) Consolidated Statements of Cash Flows, (iv) Consolidated Statements of Stockholders’ Equity and (v) the Notes to Consolidated Financial Statements, tagged as blocks of text (1). | |||||
| * | Indicates a management contract or compensation plan. |
| (1) | In accordance with Rule 406T of Regulation S-T, the XBRL related to information in Exhibit 101 to this Annual Report on Form 10-K shall not be deemed to be “filed” for purposes of Section 18 of Exchange Act,or otherwise subject to the liability of that section, and shall not be part of any registration or other document filed under the Securities Act or the Exchange Act, except as shall be expressly set forth by specific reference in such filing. |
83
Pursuant to the requirements of Section 13 or 15(d) of the Securities Exchange Act of 1934, the registrant has duly caused this report to be signed on its behalf by the undersigned, thereunto duly authorized, this 23rd day of February 2012.
| MERITAGE HOMES CORPORATION, a Maryland Corporation | ||
| By | /s/ STEVEN J. HILTON | |
| Steven J. Hilton Chairman and Chief Executive Officer | ||
| By |
/s/ LARRY W. SEAY | |
| Larry W. Seay Executive Vice President and Chief Financial Officer (Principal Financial Officer) | ||
84
KNOW ALL MEN BY THESE PRESENTS, that each person whose signature appears below constitutes and appoints Steve J. Hilton and Larry W. Seay, and each of them, his or her true and lawful attorneys-in-fact and agents, with full power of substitution and resubstitution, for him or her and in his or her name, place and stead, in any and all capacities, to sign any and all amendments to this Annual Report on Form 10-K, and to file the same, with all exhibits thereto and other documents in connection therewith the Securities and Exchange Commission, granting unto said attorneys-in-fact and agents, and each of them, full power and authority to do and perform each and every act and thing requisite and necessary to be done in and about the premises, as fully and to all intents and purposes as he or she might or could do in person hereby ratifying and confirming all that said attorneys-in-fact and agents, or his or her substitute or substitutes, may lawfully do or cause to be done by virtue hereof.
Pursuant to the requirements of the Securities Exchange Act of 1934, this report has been signed by the following persons on behalf of the registrant and in the capacities and on the dates indicated below:
| Signature |
Title |
Date | ||
| /s/ STEVEN J. HILTON Steven J. Hilton |
Chairman and Chief Executive Officer | February 23, 2012 | ||
| /s/ LARRY W. SEAY Larry W. Seay |
Executive Vice President, Chief Financial Officer (Principal Financial Officer) |
February 23, 2012 | ||
| /s/ HILLA SFERRUZZA Hilla Sferruzza |
Vice President, Corporate Controller and Chief Accounting Officer (Principal Accounting Officer) |
February 23, 2012 | ||
| /s/ PETER L. AX Peter L. Ax |
Director | February 23, 2012 | ||
| /s/ RAYMOND OPPEL Raymond Oppel |
Director | February 23, 2012 | ||
| /s/ ROBERT G. SARVER Robert G. Sarver |
Director | February 23, 2012 | ||
| /s/ RICHARD T. BURKE, SR. Richard T. Burke, Sr. |
||||