UNITED STATES
SECURITIES AND EXCHANGE COMMISSION
Washington, D.C. 20549
FORM 10-K
(Mark One)
|
| |
ý | ANNUAL REPORT PURSUANT TO SECTION 13 OR 15(d) OF THE SECURITIES EXCHANGE ACT OF 1934 |
For the fiscal year ended December 31, 2018
OR
|
| |
¨ | TRANSITION REPORT PURSUANT TO SECTION 13 OR 15(d) OF THE SECURITIES EXCHANGE ACT OF 1934 |
For the transition period from to
Commission File Number 1-9977
Meritage Homes Corporation
(Exact Name of Registrant as Specified in its Charter)
|
| | |
Maryland | | 86-0611231 |
(State or Other Jurisdiction of Incorporation or Organization) | | (IRS Employer Identification No.) |
| |
8800 E. Raintree Drive, Suite 300, Scottsdale, Arizona | | 85260 |
(Address of Principal Executive Offices) | | (Zip Code) |
(480) 515-8100
(Registrant’s telephone number, including area code)
Securities registered pursuant to Section 12(b) of the Act:
|
| | |
Title of Each Class | | Name of Each Exchange on which Registered |
Common Stock, $.01 par value | | New York Stock Exchange |
Securities registered pursuant to Section 12(g) of the Act: None
|
| | | | | | |
Indicate by check mark if the registrant is a well-known seasoned issuer, as defined in Rule 405 of the Securities Act. | | Yes | ý | | No | ¨
|
| | | | | | |
Indicate by check mark if the registrant is not required to file reports pursuant to Section 13 or Section 15(d) of the Act. | | Yes | ¨ | | No | ý |
| | | | | | |
Indicate by check mark whether the registrant (1) has filed all reports required to be filed by Section 13 or 15(d) of the Securities Exchange Act of 1934 during the preceding 12 months (or for such shorter period that the registrant was required to file such reports), and (2) has been subject to such filing requirements for the past 90 days. | | Yes | ý | | No | ¨ |
| | | | | | |
Indicate by check mark whether the registrant has submitted electronically every Interactive Data File required to be submitted pursuant to Rule 405 of Regulation S-T (§ 232.405 of this chapter) during the preceding 12 months (or for such shorter period that the registrant was required to submit such files). | | Yes | ý | | No | ¨ |
| | | | | | |
Indicate by check mark if disclosure of delinquent filers pursuant to Item 405 of Regulation S-K (§ 229.405) is not contained herein, and will not be contained, to the best of registrant’s knowledge, in definitive proxy or information statements incorporated by reference in Part III of this Form 10-K or any amendment to this Form 10-K. | | | ¨ | | | |
| | | | | | |
Indicate by check mark whether the registrant is a large accelerated filer, an accelerated filer, a non-accelerated filer, a smaller reporting company, or an emerging growth company. See the definitions of “large accelerated filer”,“accelerated filer”,“smaller reporting company”, and "emerging growth company" in Rule 12b-2 of the Exchange Act. | | | | | | |
|
| | | | | | |
Large accelerated filer | | ý | | Accelerated Filer | | ¨ |
| | | | | | |
Non-accelerated filer | | ¨ | | Smaller reporting company | | ¨ |
|
| | | | | | |
If an emerging growth company, indicate by a check mark if the registrant has elected not to use the extended transition period for complying with any new or revised financial accounting standards provided to Section 13(a) of the Exchange Act. | | | ¨ | | | |
|
| | | | | | |
Indicate by checkmark whether the registrant is a shell company (as defined in Rule 12b-2 of the Act). | | Yes | ¨ | | No | ý |
The aggregate market value of common stock held by non-affiliates of the registrant (40,649,453 shares) as of June 29, 2018, was $1.7 billion based on the closing sales price per share as reported by the New York Stock Exchange on such date.
The number of shares outstanding of the registrant’s common stock on February 13, 2019 was 38,129,299.
DOCUMENTS INCORPORATED BY REFERENCE
Portions from the registrant’s Proxy Statement relating to the 2019 Annual Meeting of Stockholders have been incorporated by reference into Part III, Items 10, 11, 12, 13 and 14.
MERITAGE HOMES CORPORATION
FORM 10-K
TABLE OF CONTENTS
PART I
Item 1. Business
The Company
Meritage Homes is a leading designer and builder of single-family homes. We primarily build in historically high-growth regions of the United States and offer a variety of homes that are designed with a focus on first-time and first move-up buyers. We have homebuilding operations in three regions: West, Central and East, which are comprised of nine states: Arizona, California, Colorado, Texas, Florida, Georgia, North Carolina, South Carolina and Tennessee. These three regions are our principal homebuilding reporting segments. We also operate a wholly-owned title company, Carefree Title Agency, Inc. ("Carefree Title"). Carefree Title's core business includes title insurance and closing/settlement services we offer to our homebuyers. Managing our own title operations allows us greater control over the entire escrow and closing cycles in addition to generating additional revenue. Revenue and expense from Carefree Title are included in our Financial Services segment in the accompanying consolidated financial statements.
Our homebuilding and marketing activities are conducted under the name of Meritage Homes in each of our homebuilding markets. In limited cases, we also offer luxury homes in some markets under the name of Monterey Homes. At December 31, 2018, we were actively selling homes in 272 communities, with base prices ranging from approximately $182,000 to $1,286,000. Our average sales price on closings and orders were approximately $407,000 and $401,000, respectively, for the year ended December 31, 2018.
Available Information; Corporate Governance
Meritage Homes Corporation was incorporated in 1988 as a real estate investment trust in the State of Maryland. On December 31, 1996, through a merger, we acquired the homebuilding operations of our predecessor company. Since that time, we have engaged in homebuilding and related activities and ceased to operate as a real estate investment trust. Meritage Homes Corporation operates as a holding company and has no independent assets or operations. Its homebuilding construction, development and sales activities are conducted through its subsidiaries.
Information about our company and communities is provided on our Internet website at www.meritagehomes.com. The information contained on our website is not considered part of this Annual Report on Form 10-K. Our periodic and current reports, including any amendments, filed or furnished pursuant to section 13(a) or 15(d) of the Securities Exchange Act of 1934 (the “Exchange Act”) are available, free of charge, on our website as soon as reasonably practicable after they are electronically filed with or furnished to the Securities and Exchange Commission (“SEC”).
Meritage operates within a comprehensive plan of corporate governance for the purpose of defining responsibilities and setting high standards for ethical conduct. Our Board of Directors has established an audit committee, executive compensation committee, nominating/governance committee and land committee. The charters for each of these committees are available on our website, along with our Code of Ethics, Corporate Governance Principles and Practices, Conflict of Interest Policy and Securities Trading Policy. All of our employees, officers and directors, are required to comply with our Code of Ethics and to immediately report through the appropriate channels, any known instances of non-compliance. Our committee charters, Code of Ethics, Corporate Governance Principles and Practices, Conflict of Interest Policy and Securities Trading Policy are also available in print, free of charge, to any stockholder who requests any of them by calling us or by writing to us at our principal executive offices at the following address: Meritage Homes Corporation, 8800 East Raintree Drive, Suite 300, Scottsdale, Arizona 85260, Attention: General Counsel. Our telephone number is (480) 515-8100.
Strategy
All facets of Meritage's operations are governed by our core values that define our culture and operational parameters, ensuring that our actions are aligned around our brand promise of delivering to each of our customers a LIFE. BUILT. BETTER.®
Our six core values include:
•Start With Heart
•Integrity Above All Else
•Develop to Empower
•Think Strategically
•Build Value, and
•Play to Win
These values combine our entrepreneurial spirit, cutting-edge innovation and organizational agility to strive for industry-leading results in all of our functional areas, including: management, land acquisition and development, finance, marketing, sales, purchasing, construction and customer care. The main tenets of these core values are:
| |
• | Value, recognize and appreciate our employees, our trade partners and our customers; provide the highest level of customer service by bringing passion and care to every customer interaction and make a difference by giving back to the communities we serve; |
| |
• | Always act with honesty, character and integrity by demonstrating openness and transparency with our customers; |
| |
• | Strive to have the best team available through investing in our people and fostering an environment that embraces continual growth and learning; |
| |
• | Continuously and purposefully renew, rethink and innovate with the customer in mind by supporting and encouraging new ideas and recognizing efforts that grow shareholder value; |
| |
• | Be relentless in our pursuit of excellence and never settling by leading with action; and |
| |
• | Foster an environment of positive energy and alignment by collaborating and leveraging each other's strengths in order to win as a team and celebrate and reward success. |
These core values are evident in the operational decisions we make in each of our divisions and communities, all of which contribute to the successes we have achieved with our customers, within the marketplace and within the homebuilding industry.
Over the last couple of years we have made a strategic shift in our business, focusing on the growing demand for entry-level homes with our LiVE.NOW® communities targeted to the first-time buyer. Our LiVE.NOW® communities are designed to simplify and streamline our construction and sales processes to create a stress-free buying experience for our customers while also enabling our trade partners and suppliers to work more efficiently and cost effectively which allows us to pass these savings on to our customers. We have historically had a significant presence with move-up buyers and we recently began introducing a re-imagined design center experience intended to simplify the sale and design center processes in our move-up communities. We believe the changes we are making address the need for well-appointed yet lower-priced homes, given rising interest rates and home prices in today's environment. The end result is that of thinking strategically to simplify and maximize our business.
We continue to focus on innovation in every new home we build, employing industry-leading building techniques and technologies aimed at setting the standard for energy-efficient homebuilding. Accordingly, at a minimum, every new home we construct meets ENERGY STAR® standards, with many of our communities greatly surpassing those levels, offering our customers homes that utilize, on average, half of the energy of similarly sized standard US homes. Our commitment to incorporate these energy standards into all of our homes has resulted in our achievement of design, purchasing and production efficiencies that have allowed us to offer these as standard features to our home buyers for nominal additional cost while providing significant additional value. In addition, all the homes we build include home automation features through our M.Connected Home Automation Suite®. This technology includes features that allow homeowners to monitor and control key components of their homes, such as Wi-Fi enabled lighting, video doorbells and smart door locks.
Year after year, the homes we design and build help deliver short- and long-term energy savings to our homeowners. As a result, for the sixth consecutive year, we have earned the EPA's highest ENERGY STAR award, "Partner of the Year - Sustained Excellence". Because of our recognized industry leadership, utility companies and the US Department of Energy
periodically partner with us to demonstrate scale advanced building technologies in the homes we build that further differentiate our product in the marketplace when compared against both new and resale homes.
We believe responsible corporate governance and social responsibility is important for the long-term sustainability of the business. We are committed to sustainability through the homes we build, the communities in which we live and work, and the ways we conduct ourselves every day. We provide information regarding these topics on our website and within publicly filed reports, including our Corporate Social Responsibility Report within the Investor Relations area of our website.
Markets
We currently build and sell homes in the following markets:
|
| |
| |
Markets | Year Entered |
Phoenix, AZ | 1985 |
Dallas/Ft. Worth, TX | 1987 |
Austin, TX | 1994 |
Tucson, AZ | 1995 |
Houston, TX | 1997 |
East Bay/Central Valley, CA | 1998 |
Sacramento, CA | 1998 |
San Antonio, TX | 2003 |
Inland Empire, CA | 2004 |
Denver, CO | 2004 |
Orlando, FL | 2004 |
Raleigh, NC | 2011 |
Tampa, FL | 2011 |
Charlotte, NC | 2012 |
Nashville, TN | 2013 |
Atlanta, GA | 2014 |
Greenville, SC | 2014 |
South Florida | 2016 |
Recent Industry and Company Developments
2018 was a year of growth and transition for the real estate and homebuilding industries, as they benefited during most of the year from strong underlying economic and housing market fundamentals evidenced by low unemployment levels, wage growth and a shortage in the supply of homes, particularly at entry-level price points. This strong demand waned in the later months of 2018 as rising interest rates and home prices caused buyers to delay their home purchasing decisions. With plentiful mortgage availability, improving economic metrics for most segments of the population, the meaningful re-entry of millennials into the home buying sector and downsizing needs of the baby boomer generation, we believe demand for new homes will be stable over the next decade and the largest population of buyers will be looking for smaller starter or move-down homes. Homebuilders with attractive, lower price-point product in desirable locations should be poised to capture this pent-up demand as millennial and move-down buyers look for nicely appointed but affordable homes.
Over the last couple of years we have been executing a strategy to address the demand for more affordable homes by acquiring communities and designing homes that can be delivered at a lower cost by simplifying our product and our construction processes, starting more spec homes to allow buyers to move in quicker, and by enhancing and making the entire home buying experience easier for our customers. In line with historical trends in the homebuilding industry, the performance of individual housing markets continue to vary. Accordingly, we experienced healthy orders and average sales price growth in some markets and more tempered growth or declines in our year-over-year results in other markets. We remain focused on positioning ourselves in well-located and highly-desired communities in many of the top residential real-estate markets in the United States. We believe we successfully differentiate ourselves from our competition by offering a lineup of extremely livable and efficient plans featuring new designs that highlight the benefits of our industry-leading energy-efficient building features and home technology which we believe are particularly appealing to the first-time buyer. We believe the longer-term economic data supports a continuation in the homebuilding cycle although the next several quarters may be choppy as the market absorbs the psychological impact of higher home prices and increasing interest rates.
Higher closing volume contributed to another year of revenue growth in 2018, generating 9.0% higher home closing revenue for the year ended December 31, 2018 compared to the prior year. We also made progress on our strategic initiatives. Home closing gross margin improved by 60 basis points to 18.2% in 2018 compared to 17.6% in 2017 with notable improvements in our East Region. Our 2018 net earnings increased by 58.7% with a 63.6% increase in diluted EPS compared to prior year. We expanded the number of LiVE.NOW communities that target the first-time buyer, and a third of our communities at December 31, 2018 and over 40% of our 2018 orders represented our entry-level product.
We carefully manage our liquidity and balance sheet, particularly during times of limited economic visibility. During 2018, we increased the capacity of our unsecured revolving credit facility (the "Credit Facility") to $780.0 million, extended the maturity date of the Credit Facility to July 2022, and issued $200.0 million in 6.00% senior notes due 2025 (the "Additional Notes"). The Additional Notes were issued as an add-on to the existing $200.0 million of 6.00% Senior Notes due 2025 that were issued in June 2015 which resulted in a combined $400.0 million aggregate principal amount of 6.00% Senior Notes due 2025 outstanding at December 31, 2018. The net proceeds from the Additional Notes were used to repay outstanding borrowings under the Credit Facility, which included borrowings used for the redemption of the Company's 4.50% Senior Notes that were due to mature on March 1, 2018. We ended the year with cash and cash equivalents totaling $311.5 million as compared to $170.7 million at December 31, 2017. Our debt-to-capital ratio was 43.2% and our net debt-to-capital ratio was 36.7% at December 31, 2018, compared to 44.9% and 41.4%, respectively, at December 31, 2017. We maintained a consistent lot supply with 34,553 lots under control at December 31, 2018 versus 34,319 in 2017 but we spent $209.2 million less on land and land development in 2018 than we did in 2017, due to negotiated land purchase terms and less expensive lots to supply our entry-level business.
In July 2018, the Board of Directors approved a new stock repurchase program, authorizing the expenditure of up to $100.0 million to repurchase shares of our common stock. Prior to December 31, 2018, we repurchased the entire $100.0 million allowed under the program at an average price of $38.71 per share, retiring 2.6 million shares of our common stock.
Land Acquisition and Development
Our current land pipeline goal is to maintain an approximate four-to-five year supply of lots, which we believe provides an appropriate planning horizon to address regulatory matters, perform land development and manage to our business plan for future closings. To grow our business and to better leverage our existing overhead, we are currently focused on adding to our current lot positions and expanding our market share in our existing markets and their surrounding submarkets while also exploring opportunities outside of our existing markets, when available. As of December 31, 2018 we have a 4.1-year supply of lots, based on 2018 closings. We continually evaluate our markets, monitoring and adjusting our lot supplies through lot and land acquisitions to ensure we have a sufficient pipeline that is in sync with local market dynamics as well as our goals for growth in those markets. Approximately 85.0% of the 2018 newly controlled lots are designated for entry-level communities.
We are currently purchasing primarily partially-developed or undeveloped lots as the opportunity to purchase substantially finished lots in desired locations is more limited. Finished lots are those on which the development has already been completed by a third party, and which are ready for immediate home construction. Undeveloped land and partially finished lots require a longer lead time to allow for development activities before our new communities are able to open for sales. Typically, undeveloped and partially finished lots are purchased at a lower cost than finished lots as we are responsible for improvements on the land, rather than paying a mark-up on improvements from a prior developer. When evaluating any land acquisition, our selection is based upon a variety of factors, including:
| |
• | financial feasibility of the proposed project, including projected profit margins, return on capital invested, and the capital payback period; |
| |
• | suitability of the land to achieve desired shift in product mix toward entry-level and first move-up product; |
| |
• | management’s judgment as to the local real estate market and economic trends, and our experience in particular markets; |
| |
• | existing concentration of owned and contracted lots in surrounding markets, including nearby Meritage communities; |
| |
• | timeline for development, generally within a three to five-year time period from the beginning of the development process to the delivery of the last home; |
| |
• | surrounding demographics based on extensive marketing studies, including surveys of both new and resale homebuyers; |
| |
• | the ability to secure governmental approvals and entitlements, if required; |
| |
• | results of environmental and legal due diligence; |
| |
• | proximity to schools and to local traffic and employment corridors and amenities; |
| |
• | entitlement and development risks and timelines; and |
| |
• | availability of seller-provided purchase options or agreements that allow us to defer lot purchases until needed for production. |
When purchasing undeveloped or partially developed land, we strive to defer the closing for the land until after most necessary entitlements have been obtained to eliminate or minimize risk and so that development or construction may begin as market conditions dictate. The term “entitlements” refers to appropriate zoning, development agreements and preliminary or tentative maps or plats, depending on the jurisdiction within which the land is located. Entitlements generally give the developer the right to obtain building permits upon compliance with conditions that are ordinarily within the developer’s control. Even though entitlements are usually obtained before land is purchased, we are typically still required to secure a variety of other governmental approvals and permits prior to and during development, and the process of obtaining such approvals and permits can be lengthy. We may consider the purchase of unentitled property when we can do so in a manner consistent with our business strategy. Currently, we are purchasing and developing parcels that on average range from 100 to 200 lots.
Once we secure undeveloped land, we generally supervise and control the development of the land through contractual agreements with subcontractors. These activities include site planning and engineering, as well as constructing road, sewer, water, utilities, drainage, landscaping improvements, and recreation amenities and other improvements and refinements. We may build homes in master-planned communities with home sites that are along or near major amenities, such as golf courses or recreation facilities.
The factors used to evaluate finished lot purchases are similar to those for land we intend to develop ourselves, although the development risks associated with the undeveloped land—financial, environmental, legal and governmental—have been borne by others. Therefore, these finished lots may be more attractive to us, despite their higher price, as we can immediately bring the community to market and begin home construction as well as mitigate potential cost and time risks that can occur during the land development cycle.
We develop a design and marketing plan tailored to each community, which includes the determination of type, size, style and price range of homes. We may also determine street layout, individual lot size and layout, and overall community design for each project we develop. The homes offered depend upon many factors, including the guidelines, if any, of the existing community, housing available in the area, the needs and desired housing product for a particular market, and our lot sizes, though we are increasingly able to use standardized design plans across most of our communities.
As a means of accessing parcels of land with minimal cash outlay, we may use rolling option contracts. Acquiring our land through option contracts, when available, allows us to leverage our balance sheet by controlling the timing and volume of lot and land purchases from third parties. These contracts provide us the right, but generally not the obligation, to buy lots and are usually structured to approximate our projected absorption rate at the time the contract is negotiated. Lot option contracts are generally non-recourse and typically require the payment of non-refundable deposits of 5% to 20% of the total land purchase price. The use of option contracts limits the market risks associated with land ownership by allowing us to re-negotiate option terms or terminate options in the event of market downturns. In the event we elect to cancel an option contract, our losses are typically limited to the forfeiture of our option deposits and any associated capitalized pre-acquisition costs. The cost of obtaining land through such option contracts is generally higher than if we were to purchase land in bulk, although the financial leverage they can provide can outweigh the financing costs associated with them. However, during a period of gross margin contraction, we diligently analyze each option contract to ensure financial feasibility and will generally only contract for lots in this manner if we are still able to achieve desired margins. During 2018 we were successful in securing approximately 2,400 lots through such options. Land purchases are generally financed through our working capital, including corporate borrowings.
At December 31, 2018, in addition to our 24,009 owned lots, we also had 10,544 lots under purchase or option contracts with a total purchase price of approximately $533.2 million secured by $47.4 million in cash deposits. We purchase and develop land primarily to support our homebuilding operations, although we may sell land and lots to other developers and homebuilders from time to time where we have excess land positions or for other strategic reasons. Information related to lots and land under option is presented in Note 3—Variable Interest Entities and Consolidated Real Estate Not Owned in the accompanying consolidated financial statements.
All land and lot acquisitions are reviewed by our corporate land acquisition committee, which is comprised of certain members of our executive management team and key operating executives. All land acquisitions exceeding a specified dollar amount must also be approved by our Board of Directors' Land Committee.
Investments in Unconsolidated Entities — Joint Ventures
We may enter into joint ventures as a means of accessing larger parcels of land, expanding our market opportunities, managing our risk profile and leveraging our capital base. While purchasing land through a joint venture can be beneficial, we currently do not view joint ventures as critical to the success of our homebuilding operations. We currently have only three such active ventures. In addition to land development joint ventures, we also participate in one mortgage business joint venture. The mortgage joint venture is engaged in mortgage activities, primarily providing services to our customers.
In connection with our land development joint ventures, we may also provide certain types of guarantees to associated lenders and municipalities.
Construction Operations
We typically act as the general contractor for our projects and hire experienced subcontractors on a geographic basis to complete construction at fixed prices. We usually enter into agreements with subcontractors and materials suppliers on an individual basis after receiving competitive bids. In certain markets at high risk for cost increases, we enter into fixed-fee bids when it makes economic sense to do so. We also enter into longer-term and national or regional contracts with subcontractors and suppliers, where possible, to obtain more favorable terms, minimize construction costs and to control product consistency and availability. Our contracts require that our subcontractors comply with all laws and labor practices pertaining to their work, follow local building codes and permits, and meet performance, warranty and insurance requirements. Our purchasing and construction managers coordinate and monitor the activities of subcontractors and suppliers, and monitor compliance with zoning, building and safety codes. At December 31, 2018, we employed approximately 765 full-time construction and warranty employees.
We specify that quality durable materials be used in the construction of our homes and we do not maintain significant inventories of construction materials, except for work in process materials for homes under construction. When possible, we negotiate price and volume discounts and rebates with manufacturers and suppliers on behalf of our subcontractors so we can take advantage of production volume. Our raw materials consist primarily of lumber, concrete, drywall, roofing materials and similar construction materials and are frequently purchased on a national or regional level. Such materials have historically been available from multiple suppliers and therefore we do not believe there is a supplier risk concentration. However, because such materials are substantially comprised of natural resource commodities, their cost and availability is subject to national and worldwide price fluctuations and inflation, each of which could be impacted by legislation or regulation relating to energy, climate change or tariffs.
We generally build and sell homes in phases within our larger projects, which we believe creates efficiencies in land development, home construction operations and cash management. We also believe it improves customer satisfaction by reducing the number of vacant lots and construction activity surrounding completed homes. Our homes are typically completed within three to five months from the start of construction, depending upon the geographic location and the size and complexity of the home. Construction schedules may vary depending on the size of the home, availability of labor, materials and supplies, product type, location, municipal requirements and weather. Our homes are usually designed to promote efficient use of space and materials, and to minimize construction costs and time. We typically do not enter into any derivative contracts to hedge against weather or materials fluctuations as we do not believe they are particularly advantageous to our operations, although we do lock in short and mid-term pricing with our vendors for certain key construction commodities.
Marketing and Sales
We believe that we have an established reputation for building a diversified line of attractive, high quality and efficient homes, which helps generate demand in our communities. Our communication and marketing plans are tailored to target and reach our different customer segments. Part of these plans involve reaching new customers through a combination of advertising and other promotional activities targeting key consumer segments through online advertising, online listings, social media, email, articles and posts to drive consumers to our website at www.meritagehomes.com. In addition, our local marketing efforts are focused to drive consumers to visit specific communities in the market via incremental online promotions, direct mail, grass roots marketing campaigns and events, and to a more limited extent magazine, newspaper or radio advertisements, as well as strategically placed signs in the vicinities near our communities. Our marketing strategy is aimed at differentiating Meritage from resale homes, as well as new homes offered by other homebuilders. We solidify this differentiation across all of our marketing and sales efforts to explain how we have thoughtfully selected and incorporated every home's energy-efficient features and benefits as part of a larger, integrated system that enables us to deliver on our LIFE. BUILT. BETTER.® brand promise to our customers, which means having a home that is quieter, cleaner, healthier, smarter and safer.
We sell our homes using furnished model homes as a marketing tool to demonstrate to prospective homebuyers the advantages of the designs and features of our homes. At December 31, 2018, we owned 356 completed model homes, 42 models under construction and leased back an additional 8 model homes. We generally employ or contract with interior and
landscape designers who enhance the appeal of our model homes, which highlight the features and options available for the product line within a project. We typically build between one and three model homes for each actively selling community, depending upon the products to be offered and the number of homes to be built in the project. We strive to implement marketing strategies that will educate our buyers on how our unique building techniques and the energy efficient and home automation features in our homes differentiate them from other homes. In our communities, we have built "learning centers" and in-home displays in order to inform our buyers about our many energy-efficient and home automation features and help them understand how and to what extent a Meritage home can help them realize savings through reduced energy bills, and experience and enjoy better health, improved comfort and peace of mind. For our move-up buyers, we recently began introducing a completely re-imagined design center experience. We believe buyers prioritize quality, personal expression and beautiful design along with savings and efficient timelines when choosing their home. With the introduction of our new design center experience, we believe we will deliver this experience to our buyers.
Our homes generally are sold by our commissioned sales associate employees who work from a sales office typically located in a converted garage of one of the model homes for each community. We also employ a team of online sales associates who offer assistance to potential buyers viewing our communities and products online. At December 31, 2018, we had approximately 500 full-time sales and marketing personnel. Our goal is to ensure that our sales force has extensive knowledge of our housing product, our energy efficient and innovative features, our sales strategies, mortgage options, and community dynamics, in order to fully execute our marketing message. To achieve this goal, we train our sales associates and conduct regular meetings to update them on our product, communities, sales techniques, competition in the area, financing availability, construction schedules, marketing and advertising plans, available product lines, pricing, options and warranties offered, as well as the numerous benefits and savings our energy efficient product provides. Our sales associates are licensed real estate agents where required by law. We may offer various sales incentives, including price concessions, assistance with closing costs, and landscaping or interior upgrades, to attract buyers. The use, type and amount of incentives depends largely on economic and local competitive market conditions. Third-party brokers may also sell our homes, and are usually paid a sales commission based on the price of the home. Frequently, third-party brokers bring prospective buyers to our communities. We have a robust loyalty program for these brokers and we aim to regularly educate them on the benefits of owning a Meritage home and our community offerings, which we believe helps enhance the impact of our marketing message.
We differentiate ourselves from our competitors with our highly desirable and affordable community and plan offerings and our simplified home buying process to effectively meet the needs of today's homebuyers. We also differentiate ourselves through the superior design and value of our communities and homes, our energy-efficiency and other technologies, and our offerings and enhancements made pursuant to the results of ongoing surveying and product research efforts. We believe our commitment to design and build energy-efficient homes is aligned with buyer sensitivities about how eco-friendly designs, features and materials help impact the environment and the livability of homes, as well as their pocketbooks. As evidenced in our strategic shift to focus primarily on first-time and first move-up buyers through our LiVE.NOW. and Design Collections offerings, we are committed to continually evaluating buyer preferences and making adjustments to the homes we offer and the targeted price points in accordance with buyer demand. We believe these efforts set us apart from both other new homes available for sale and the re-sale home market.
Backlog
Our sales contracts require cash deposits and may be subject to certain contingencies such as the buyer’s ability to qualify for financing. Homes covered by such sales contracts but which are not yet closed are considered “backlog” and are representative of potential future revenues. Started homes are excluded from backlog until a sales contract is signed and are referred to as unsold or “spec” inventory. A contract contingent upon the sale of a customer’s existing home is not considered a sale and not included in backlog until the contingency is removed. All of our entry-level homes are started as spec homes whereas a signed sales contract is generally required to release a lot to start construction of a move-up home, although on a regular basis we also start a certain number of move-up homes for speculative sales inventory. We may also start construction on spec homes to accelerate or facilitate the close-out of a community. As a result of our strategic shift to expand our entry-level home product offerings and communities and increase the availability of quick move-in home opportunities, our spec inventory increased to 9.2 specs per active community as of December 31, 2018 as compared to 8.5 in 2017. At December 31, 2018, 78.8% of our 2,433 homes in backlog were under construction.
We do not recognize any revenue from a home sale until a finished home is delivered to the homebuyer, payment is collected and other criteria for sale and profit recognition are met. At December 31, 2018, of our total unsold homes in inventory excluding completed model homes, 68.7% were under construction without sales contracts and 31.3% were completed homes without sales contracts. A portion of the unsold homes resulted from homesites that began construction with valid sales contracts that were subsequently canceled. We believe that during 2019 we will deliver to customers substantially all homes in backlog at December 31, 2018 under existing or, in the case of cancellations, replacement sales contracts.
The number of units in backlog decreased 15.4% to 2,433 units at December 31, 2018 from 2,875 units at December 31, 2017 with a corresponding decrease in the value of backlog to $1.0 billion from $1.2 billion.
Customer Financing
Most of our homebuyers require financing. Accordingly, we refer them to mortgage lenders that offer a variety of financing options. While our homebuyers may obtain financing from any mortgage provider of their choice, we have a joint venture arrangement with an established mortgage broker that allows it to act as a preferred mortgage broker to our buyers in most of our markets to help facilitate the financing process as well as generate additional revenue for us through our interest in the joint venture (See Note 4 for additional information on joint venture financial results). In some markets, we may also have referral relationships with unaffiliated preferred mortgage lenders. We may pay a portion of the closing costs to assist homebuyers who obtain financing from our preferred lenders.
Customer Relations, Quality Control and Warranty Programs
We believe that positive customer relations and an adherence to stringent quality control standards are fundamental to our continued success, and that our commitment to buyer satisfaction and quality control has significantly contributed to our reputation as a high-quality builder.
In accordance with our company-wide standards, one or more Meritage project manager or superintendent generally monitors compliance with quality control standards for each community through the building phase of our homes. These employees perform the following tasks:
| |
• | oversee home construction; |
| |
• | monitor subcontractor and supplier performance; |
| |
• | manage scheduling and construction completion deadlines; and |
| |
• | conduct formal inspections as specific stages of construction are completed. |
At the time a home is completed and delivered to a buyer, the customer relationship is transitioned to a customer relations employee who manages the warranty and customer care efforts.
We generally provide a one-to two-year limited warranty on workmanship and building materials and a ten-year warranty for the structural integrity of the homes we build. We require our subcontractors to provide evidence of insurance before beginning work and provide a warranty to us and to indemnify us from defects with their work and therefore any claims relating to workmanship and materials are generally the subcontractors’ responsibility. In certain markets and for certain attached product, we offer an owner-controlled insurance program to our subcontractors which, if accepted, is the insurance for damage resulting from construction defects in lieu of some of the insurance we require from the subcontractor. Although our subcontractors are generally required to repair and replace any product or labor defects (and for those operating in markets with our owner-controlled insurance program, pay a deductible as a condition to such coverage), we are, during applicable warranty periods, ultimately responsible to the homeowner for making such repairs. Accordingly, with the assistance of an actuary, we have estimated and established reserves for future structural warranty costs based on the number of home closings and historical data trends for warranty work within our communities. Warranty reserves generally range between 0.1% to 0.6% of a home’s sale price. Those projections are subject to variability due to uncertainties regarding structural warranty claims relating to the construction of our homes, the markets in which we build, claim settlement history, and insurance and legal interpretations, among other factors and we are, therefore, constantly monitoring such reserves. Historically, these reserves have been sufficient to cover net out-of-pocket warranty costs.
Competition and Market Factors
The construction and sale of homes is a highly-competitive industry. We compete for sales in each of our markets with national, regional and local developers and homebuilders, as well as existing resale homes, condominiums and rental housing. Some of our competitors have significantly greater financial resources and may have lower costs than we do. Competition among residential homebuilders of all sizes is based on a number of interrelated factors, including location, reputation, product type, amenities, design, innovation, quality and price. We believe that we compare favorably to other homebuilders in the markets in which we operate due to our:
| |
• | ability to recognize and adapt to changing market conditions, from both a capital and human resource perspective; |
| |
• | streamlined construction processes that allow us to save on materials, labor and time and pass those savings to our customers in the form of lower prices; |
| |
• | experience within our geographic markets which allows us to develop and offer products that provide superior design and quality in line with the needs and desires of the targeted demographic; |
| |
• | ENERGY STAR® standards in all of our communities and incremental energy-efficient features that create a variety of benefits to our customers and differentiate our product from competing new and existing home inventories; |
| |
• | inclusion of home automation through our new M.Connected Home Automation Suite®; |
| |
• | ability to capitalize on opportunities to acquire land on favorable terms; and |
| |
• | reputation for outstanding service and quality products and our exceptional customer and warranty service. |
Our product offerings and strategic locations are successfully competing with both existing homes inventory and surrounding new-home communities as evidenced by our relative orders volume and market share in most of our divisions. We expect that the strengths noted above will continue to provide us with long-term competitive advantages.
We have an extensive market research department that assists the operating divisions in each of our markets to better compete with other homebuilders and the inventory of re-sale homes in surrounding neighborhoods. Our strategic operations team conducts in-depth community-level reviews in each of our markets, including a detailed analysis of existing inventory, pricing, buyer demographics and the identification of each location’s key buyer metrics. This analysis and resulting analytical tools assist in decision-making regarding product designs, positioning, and pricing and underwriting standards for land purchases and land development. Additionally, our market research department is focused on evaluating and identifying new market opportunities.
Government Regulation and Environmental Matters
To the extent that we acquire undeveloped land, we prefer to close the acquisition of such land after all or most entitlements have been obtained. Construction may begin almost immediately on such entitled land upon compliance with and receipt of specified permits, approvals and other conditions, which generally are within our control. The time needed to obtain such approvals and permits affects the carrying costs of unimproved property acquired for development and construction. The continued effectiveness of permits already granted is subject to factors such as changes in government policies, rules and regulations, and their interpretation and application. The government approval processes discussed above have caused some timing delays but have not had a material adverse effect on our development activities, although there is no assurance that these and other restrictions will not adversely affect future operations as, among other things, sunset clauses may exist on some of our entitlements and they could lapse.
Local and state governments have broad discretion regarding the imposition of development fees for projects under their jurisdictions. These fees are normally established when maps or plats are recorded and building permits obtained. Governing agencies may also require concessions or may require the builder to construct certain improvements to public places such as parks and streets. In addition, governing agencies may impose construction moratoriums. Because most of our land is entitled, construction moratoriums typically would not affect us in the near term unless they arise from health, safety or welfare issues, such as insufficient water, electric or sewage facilities. We could become subject to delays or may be precluded entirely from developing communities due to building moratoriums, “no growth” or “slow growth” initiatives or building permit allocation ordinances, which could be implemented in the future.
In addition, there is constantly a variety of new legislation being enacted, or considered for enactment at the federal, state and local level relating to energy and climate change. Some of this legislation relates to items such as carbon dioxide emissions control and building codes that impose energy efficiency standards. New building code requirements that impose stricter energy efficiency standards could significantly increase the cost to construct homes, although our energy-efficiency technologies and offerings meet, and in many instances exceed, current and expected energy efficiency thresholds. As climate change concerns continue to grow, legislation and regulations of this nature are expected to continue and may result in increased costs and longer approval and development timelines. Similarly, energy and environment-related initiatives affect a wide variety of companies throughout the United States and the world, and because our operations are heavily dependent on significant amounts of raw materials, such as lumber, steel, and concrete, such initiatives could have an indirect adverse impact on our operations and profitability to the extent the manufacturers and suppliers of our materials are burdened with expensive carbon dioxide emissions control and other environmental and energy-related regulations.
We are also subject to a variety of local, state, and federal statutes, ordinances, rules and regulations concerning the protection of health and the environment. In some markets, we are subject to environmentally sensitive land ordinances that mandate open space areas with public elements in housing developments, and prevent development on hillsides, wetlands and other protected areas. We must also comply with open space restrictions, flood plain restrictions, desert wash area restrictions, native plant regulations, endangered species acts and view restrictions. These and similar laws and regulations may result in delays, cause substantial compliance and other costs, and prohibit or severely restrict development in certain environmentally sensitive regions or areas. To date, compliance with such laws and regulations has not materially affected our operations, although it may do so in the future.
We condition our obligation to acquire property on, among other things, an environmental review of the land. To date, we have not incurred any material unanticipated liabilities relating to the removal or remediation of unknown toxic wastes or other environmental conditions. However, there is no assurance that we will not incur material liabilities in the future relating to toxic waste removal or other environmental conditions affecting land currently or previously owned.
In order for our homebuyers to finance their home purchases with FHA-insured or VA-guaranteed or USDA-guaranteed mortgages, we are required to build such homes in accordance with the regulatory requirements of those agencies.
Some states have statutory disclosure requirements governing the marketing and sale of new homes. These requirements vary widely from state to state.
Some states require us to be registered as a licensed contractor, a licensed real estate broker and in some markets our sales agents are required to be registered as licensed real estate agents.
Employees, Subcontractors and Consultants
At December 31, 2018, we had approximately 1,615 full-time employees, including 310 in management and administration, 40 in our title company, 500 in sales and marketing, and 765 in construction and warranty operations. Our operations are carried out through both local and centralized management. Local operations are made up of our division employees, led by management with significant homebuilding experience and who typically possess a depth of knowledge in their particular markets. Our centralized management sets our strategy and leads decisions related to the Company's land acquisition, risk management, finance, cash management and information systems. Our employees are not unionized, and we believe that we have good employee relationships. We pay for a substantial portion of our employees’ insurance costs, with the balance contributed by the employees. We also have a 401(k) savings plan, which is available to all employees who meet the plan’s participation requirements.
We act solely as a general contractor, and all construction operations are coordinated by our project managers and field superintendents who schedule and monitor third party independent subcontractors. We use independent consultants and contractors for architectural, engineering, advertising and some legal services, and we strive to maintain good relationships with our subcontractors and independent consultants and contractors.
Seasonality
Historically, we have experienced seasonal variations in our quarterly operating results and capital requirements. We typically sell more homes in the first half of the fiscal year than in the second half, which creates additional working capital requirements in the second and third quarters to build our inventories to satisfy the deliveries in the second half of the year. We typically benefit from the cash generated from home closings more in the third and fourth quarters than in the first and second quarters. We expect this seasonal pattern to continue over the long term, although it has been and may continue to be affected by volatility in the homebuilding industry.
Executive Officers of the Registrant
The names, ages, positions and business experience of our executive officers are listed below (all ages are as of March 1, 2019).
|
| | | | |
| | | | |
Name | | Age | | Position |
Steven J. Hilton | | 57 | | Chairman of the Board and Chief Executive Officer |
Hilla Sferruzza | | 43 | | Chief Financial Officer, Executive Vice President |
C. Timothy White | | 58 | | General Counsel, Executive Vice President and Secretary |
Phillippe Lord | | 45 | | Chief Operating Officer, Executive Vice President |
Javier Feliciano | | 45 | | Chief Human Resources Officers, Executive Vice President |
Steven J. Hilton co-founded Monterey Homes in 1985, which merged with our predecessor in December 1996. Mr. Hilton served as Co-Chairman and Co-Chief Executive Officer from July 1997 to May 2006 and has been the Chairman and Chief Executive Officer since May 2006.
Hilla Sferruzza was appointed Chief Financial Officer and Executive Vice President in April 2016. Prior to her appointment as Chief Financial Officer and Executive Vice President, Ms. Sferruzza was named Chief Accounting Officer and Corporate Controller in 2010 and has worked in other management roles at the company since 2006.
C. Timothy White has been General Counsel, Executive Vice President and Secretary since October 2005 and served on our Board of Directors from December 1996 until October 2005.
Phillippe Lord has been Chief Operating Officer, Executive Vice President since April 2015. Prior to his appointment as Chief Operating Officer, Mr. Lord was Vice President of Strategic Operations from 2008 through 2012 and served as our Western Region President from 2012 through March 2015.
Javier Feliciano joined Meritage in November 2015 as Chief Human Resources Officer, Executive Vice President. From January 2013 through November 2015, Mr. Feliciano was employed by Apollo Education Group as Vice President, Human Resources and as HR Director from June 2010 through January 2013.
Item 1A. Risk Factors
The risk factors discussed below are factors that we believe could significantly impact our business, if they occur. These factors could cause results to differ materially from our historical results or our future expectations.
Risk Factors Related to our Business
Increases in interest rates and decreases in mortgage availability may make purchasing a home more difficult or less desirable and may negatively impact the ability to sell new and existing homes.
In general, housing demand is adversely affected by increases in interest rates and a lack of availability of mortgage financing. Most of our buyers finance their home purchases through our mortgage joint venture or third-party lenders providing mortgage financing. If mortgage interest rates increase and, consequently, the ability of prospective buyers to finance home purchases is adversely affected, our home sales and cash flow may be adversely affected and the impact may be material. These risks can also indirectly impact us to the extent our customers need to sell their existing home to purchase a new home from us if the potential buyers of our customer's homes are unable to obtain mortgage financing. Although long-term interest rates currently are slightly above historically low levels, they have risen over the last year and it is difficult to predict future increases or decreases in market interest rates.
Mortgage lenders are subject to underwriting standards by the regulatory authorities which oversee them. Regulations, standards, rules and requirements, as and when implemented, could restrict the availability of loans and/or increase the costs to borrowers to obtain such loans. While lending requirements have loosened in the past couple of years, mortgage lending underwriting standards are more restrictive than in the previous homebuilding cycle, potentially limiting the number of buyers able to obtain a mortgage. The FHA insures mortgage loans that generally have lower credit requirements and is an important source for financing some of our home sales. Changes or restrictions in FHA programs may negatively affect the availability or affordability of FHA financing. Financing through programs offered by the VA, USDA and other certain housing finance agencies are subject to changes in regulations, lending standards and government funding levels. There can be no assurance that these programs will continue to be available or that they will be as accommodating as they currently are. Continued legislative and regulatory actions and more stringent underwriting standards could have a material adverse effect on our business if certain buyers are unable to obtain mortgage financing. A prolonged tightening of the financial markets could also negatively impact our business.
Legislation related to tariffs could increase the cost to construct our homes.
The cost of certain building materials is influenced by changes in local and global commodity prices as well as government regulation, such as government-imposed tariffs on building supplies such as lumber and flooring materials. During 2018, we experienced increases in the prices of some building materials as a result of such tariffs. Such cost increases limit our ability to control costs, potentially reducing margins on the homes we build if we are not able to successfully offset the increased costs through higher sales prices. The risk of increasing prices resulting from tariffs is even more pronounced for homes under contract where we are usually precluded from increasing the sales price for unforeseen costs.
Our long-term success depends on the availability of lots and land that meet our land investment criteria.
The availability of lots and land that meet our investment and marketing standards depends on a number of factors outside of our control, including land availability in general, competition with other homebuilders and land buyers, credit market conditions, legal and government agency processes and regulations, inflation in land prices, zoning, availability of utilities, our ability and the costs to obtain building permits, the amount of impact fees, property tax rates and other regulatory requirements. If suitable lots or land becomes less available, or the cost of attractive land increases, it could reduce the number of homes that we may be able to build and sell and reduce our anticipated margins, each of which could adversely impact our financial results. The availability of suitable land assets could also affect the success of our strategic initiative to sustain the number of actively selling communities that support the shift of our product focus to entry-level and first move-up homes, and to maintain profitability.
Shortages in the availability of subcontract labor may delay construction schedules and increase our costs.
We conduct our construction operations only as a general contractor. Virtually all design, architectural, construction and development work is performed by unaffiliated third-party consultants and subcontractors. As a consequence, we depend on the continued availability of and satisfactory performance by these consultants and subcontractors for the design and construction of our communities and homes and to provide related materials. The cost of labor may also be adversely affected by shortages of qualified trades people, changes in laws and regulations relating to union activity and changes in immigration laws and trends in labor migration. Throughout the homebuilding cycle, we have experienced shortages of skilled labor in certain markets, which led to increased labor costs. We cannot be assured that in the future there will be a sufficient supply or satisfactory performance by these unaffiliated third-party consultants and subcontractors, which could have a material adverse effect on our business.
If our current strategic initiatives are not successful, it could have negative consequences on our operations, financial position and cash flows.
We have historically focused our community designs, product offerings and marketing on the first- and second-move-up buyer. As a result of changing demographics and trends, we have shifted our strategy and have undertaken actions to align our pricing and product and community offerings to focus on entry-level and first move-up homes based on our belief that these two product types will comprise the majority of the market demand in the near and medium term outlook. We have invested significant efforts to align our community layouts, lot sizes and product designs toward these buyers. If there is not a resurgence of first-time and first move-up buyers or our entry-level home offerings are not attractive to our customers, it could have negative consequences on our operations, financial position and cash flows.
If home prices decline, potential buyers may not be able to sell their existing homes, which may negatively impact our sales.
As a homebuilder, we are subject to market forces beyond our control. In general, housing demand is impacted by the affordability of housing. Many homebuyers need to sell their existing homes in order to purchase a new home from us, and a weakness in the home resale market could adversely affect that ability. Declines in home prices could have an adverse effect on our homebuilding business margins and cash flows.
Our future operations may be adversely impacted by high inflation.
We, like other homebuilders, may be adversely affected during periods of high inflation, mainly from higher land, construction, labor and materials costs. Also, higher mortgage interest rates may significantly affect the affordability of mortgage financing to prospective buyers. Inflation could increase our cost of financing, materials and labor and could cause our financial results or profitability to decline. Traditionally, we have attempted to pass cost increases on to our customers through higher sales prices. Although inflation has not historically had a material adverse effect on our business, sustained increases in material costs have recently had and may continue to have a material adverse effect on our business if we are unable to correspondingly increase home sale prices.
A reduction in our sales absorption levels may force us to incur and absorb additional community-level costs.
We incur certain overhead costs associated with our communities, such as marketing expenses, real estate taxes and HOA assessments and costs associated with the upkeep and maintenance of our model and sales complexes. If our sales absorptions pace decreases and the time required to close out our communities is extended, we would likely incur additional overhead costs, which would negatively impact our financial results. Additionally, we typically incur various land development improvement costs for a community prior to the commencement of home construction. Such costs include infrastructure, utilities, taxes and other related expenses. A reduction in home absorption rates increases the associated holding costs and extends our time and ability to recover such costs.
The value of our real estate inventory may decline, leading to impairments and reduced profitability.
During the last homebuilding cycle downturn, and in certain isolated circumstances afterward, we had to impair many of our real-estate assets to fair-value, incurring large impairment charges which negatively impacted our financial results. Another decline in the homebuilding market may require us to re-evaluate the value of our land holdings and we could incur additional impairment charges, which would decrease both the book value of our assets and stockholders’ equity.
High cancellation rates may negatively impact our business
Our backlog reflects the number and value of homes for which we have entered into non-contingent sales contracts with customers but have not yet delivered those homes. While we may accept sales contracts on a contingent basis in limited circumstances, they are not included in our backlog until the contingency is removed. In connection with the purchase of a
home, our policy is to generally collect a deposit from our customers, although typically this deposit reflects a small percentage of the total purchase price, and due to local regulations, the deposit may, in certain circumstances, be fully or partially refundable prior to closing. If the prices for our homes in a given community decline, our neighboring competitors reduce their sales prices (or increase their sales incentives), interest rates increase, the availability of mortgage financing tightens or there is a downturn in local, regional or national economies, homebuyers may elect to cancel their home purchase contracts with us. Significant cancellations have previously had, and could in the future have, a material adverse effect on our business as a result of lost sales revenue and the accumulation of unsold housing inventory.
If we are unable to successfully compete in the highly competitive housing industry, our financial results and growth may suffer.
The housing industry is highly competitive. We compete for sales in each of our markets with national, regional and local developers and homebuilders, resale of existing homes, condominiums and available rental housing. Some of our competitors have significantly greater financial resources and some may have lower costs than we do. Competition among homebuilders of all sizes is based on a number of interrelated factors, including location, reputation, amenities, design, innovation, quality and price. Competition is expected to continue and may become more intense, and there may be new entrants in the markets in which we currently operate and in markets we may enter in the future and our industry has recently experienced some consolidations. If we are unable to successfully compete, our financial results and growth could suffer.
Expirations, amendments or changes to tax laws, incentives or credits currently available to us and our homebuyers may negatively impact our business.
Under previous tax law, certain expenses of owning a home, including mortgage loan interest costs and real estate taxes, generally were deductible expenses for the purpose of calculating an individual's federal, and in some cases state, tax liability. However, the Tax cuts and Jobs Act (the "Tax Act") signed into law on December 22, 2017 limits these deductions for some individuals starting in 2018. The Tax Act caps individual state and local tax deductions at $10,000 for the aggregate of state and local real property and income taxes or state and local sales taxes. Additionally, the Tax Act reduces the cap on mortgage interest deduction to $750,000 of debt for debt incurred after December 15, 2017 while retaining the $1 million debt cap for debt incurred prior to December 15, 2017, The limits on deductibility of mortgage interest and property taxes may increase the after-tax cost of owning a home for some individuals.
Any increases in personal income tax rates and/or additional tax deduction limits could adversely impact demand for homes, including homes we build, which could adversely affect the results of our operations.
Prior to 2018, we have benefited from the availability of the IRC §45L new energy efficient homes credit. To date, no similar legislation has been passed for 2018 or any subsequent year.
Reduced levels of sales may cause us to re-evaluate the viability of existing option contracts, resulting in a potential termination of these contracts which may lead to impairment charges.
In the prior homebuilding cycle, a significant portion of our lots were controlled under option contracts. Such options generally require a cash deposit that will be forfeited if we do not exercise the option or proceed with the purchase(s). During the last significant downturn, we forfeited significant amounts of deposits and wrote off significant amounts of related pre-acquisition costs related to projects we no longer deemed feasible, as they were not projected to generate acceptable returns. Another downturn in the homebuilding market may cause us to re-evaluate the feasibility of our optioned projects which may result in us forfeiting deposits, which would reduce our assets and stockholders’ equity.
Our business may be negatively impacted by natural disasters or extensive weather.
Our homebuilding operations include operations in Texas, California, North Carolina, South Carolina, Tennessee, Georgia and Florida which occasionally experience extreme weather conditions such as tornadoes and/or hurricanes, earthquakes, wildfires, flooding, landslides, prolonged periods of precipitation, sinkholes and other natural disasters. We may not be able to insure against some of these risks. For example, during 2017 and 2018, several of our markets were impacted by hurricanes. These occurrences could damage or destroy some of our homes under construction or our building lots and community improvements, which may result in uninsured or underinsured losses. We could also suffer significant construction delays or substantial fluctuations in the pricing or availability of building materials due to such disasters. Any of these events could cause a delay in scheduled closings and a decrease in our revenue, cash flows and earnings.
We are subject to home warranty and construction defect claims arising in the ordinary course of business, which may lead to additional reserves or expenses.
Home warranty and construction defect claims are common in the homebuilding industry and can be costly. We sometimes encounter construction defect issues that may be alleged to be widespread within a single community or geographic area and we are currently managing two such issues, one regarding possible foundation design issues within a single community in Texas and the other regarding an alleged widespread stucco application issue in Florida. In order to account for future potential warranty and construction defect obligations, we establish a warranty reserve in connection with every home closing. Additionally, we maintain general liability insurance and generally require our subcontractors to provide a warranty and indemnity to us and insurance coverage for liabilities arising from their work; however, we cannot be assured that our warranty reserves and insurance and those subcontractors warranties, insurance and indemnities will be adequate to cover all warranty and construction defect claims for which we may be held responsible. For example, we may be responsible for applicable self-insured retentions, and certain claims may not be covered by insurance or may exceed applicable coverage limits, which could be material to our financial results.
A major safety incident relating to our operations could be costly in terms of potential liabilities and reputational damage.
Construction sites are inherently dangerous and pose certain inherent health and safety risks to construction workers, employees and other visitors. Due to health and safety regulatory requirements and the number of projects we work on, health and safety performance is important to the success of our development and construction activities. Any failure in health and safety performance may result in penalties for non-compliance with relevant regulatory requirements, and a failure that results in a major or significant health and safety incident is likely to be costly and could expose us to claims resulting from personal injury. Such a failure could generate significant negative publicity and have a corresponding impact on our reputation, our relationships with relevant regulatory agencies or governmental authorities, and our ability to attract customers and employees, which in turn could have a material adverse effect on our business, financial condition and operating results.
Our income tax provision and other tax liabilities may be insufficient if taxing authorities initiate and are successful in asserting tax positions that are contrary to our position.
In the normal course of business, we are audited by various federal, state and local authorities regarding income tax matters. Significant judgment is required to determine our provision for income taxes and our liabilities for federal, state, local and other taxes. We have one state tax audit unresolved at this time. Although we believe our approach to determining the appropriate tax treatment is supportable and in accordance with tax laws and regulations and relevant accounting literature, it is possible that the final tax authority will take a tax position that is materially different than ours. As each audit is conducted, adjustments, if any, are recorded in our consolidated financial statements in the period determined. Such differences could have a material adverse effect on our income tax provision or benefit, or other tax reserves, in the reporting period in which such determination is made and, consequently, on our results of operations, financial position and/or cash flows for such period.
Our ability to acquire and develop raw or partially finished lots may be negatively impacted if we are unable to secure performance bonds.
In connection with land development work on our raw or partially developed land, we are oftentimes required to provide performance bonds or other assurances for the benefit of the respective municipalities or governmental authorities. These performance bonds provide assurance to the beneficiaries that the development will be completed, or that in case we do not perform, that funds from the bonds are available for the municipality or governmental agency to arrange for completion of such work. Although such bonds are currently accessible, in the future additional performance bonds may be difficult to obtain, or may become difficult to obtain on terms that are acceptable to us. If we are unable to secure such required bonds, progress on affected projects may be delayed or halted or we may be required to expend additional cash or provide other forms of surety or security for such obligations, such as letters of credit, which may adversely affect our financial position and ability to grow our operations.
The loss of key personnel may negatively impact us.
Our success largely depends on the continuing services of certain key employees and our ability to attract and retain qualified personnel. We have employment agreements with certain key employees who we believe possess valuable industry knowledge, experience and leadership abilities that would be difficult in the short term to replicate. The loss of the services of such key employees could harm our operations and business plans.
Failure to comply with laws and regulations by our employees or representatives may harm us.
We are required to comply with applicable laws and regulations that govern all aspects of our business including land acquisition, development, home construction, labor and employment, mortgage origination, title and escrow operations, sales and warranty. It is possible that individuals acting on our behalf could intentionally or unintentionally violate some of these laws and regulations. Although we endeavor to take immediate action if we become aware of such violations, we may incur fines, penalties or losses as a result of these actions and our reputation with governmental agencies and our customers may be damaged. Further, other acts of bad judgment may also result in negative publicity and/or financial consequences.
Our lack of geographic diversification could adversely affect us if the homebuilding industry in our markets decline.
We have operations in Texas, Arizona, California, Colorado, Florida, North Carolina, South Carolina, Georgia and Tennessee. Although we have, in recent years, expanded our operations to new markets, our geographic diversification is still limited and could adversely impact us if the homebuilding business in our current markets should decline, since we may not have a balancing opportunity in other geographic regions.
We experience fluctuations and variability in our operating results on a quarterly basis and, as a result, our historical performance may not be a meaningful indicator of future results.
We historically have experienced, and expect to continue to experience, variability in home sales and results of operations on a quarterly basis. As a result of such variability, our historical performance may not be a meaningful indicator of future results. Factors that contribute to this variability include:
| |
• | timing of home deliveries and land sales; |
| |
• | the changing composition and mix of our asset portfolio; |
| |
• | delays in construction schedules due to adverse weather, acts of God, reduced subcontractor availability and governmental requirements and restrictions; |
| |
• | conditions of the real estate market in areas where we operate and of the general economy; |
| |
• | the cyclical nature of the homebuilding industry; and |
| |
• | costs and availability of materials and labor. |
Our level of indebtedness may adversely affect our financial position and prevent us from fulfilling our debt obligations.
The homebuilding industry is capital intensive and requires significant up-front expenditures to secure land and pursue development and construction on such land. Accordingly, we incur substantial indebtedness to finance our homebuilding activities. At December 31, 2018, we had approximately $1.3 billion of indebtedness, $311.5 million of cash and cash equivalents. If we require working capital greater than that provided by our operations and current liquidity position, and $706.0 million available to be drawn under our credit facility, we may be required to seek additional capital in the form of equity or debt financing from a variety of potential sources, including bank financing and securities offerings. There can be no assurance we would be able to obtain such additional capital on terms acceptable to us, if at all. The level of our indebtedness could have important consequences to our stockholders, including the following:
| |
• | our ability to obtain additional financing for working capital, capital expenditures, acquisitions or general corporate purposes could be impaired; |
| |
• | we could have to use a substantial portion of our cash flow from operations to pay interest and principal on our indebtedness, which would reduce the funds available to us for other purposes such as land and lot acquisition, development and construction activities; |
| |
• | we have a moderate level of indebtedness and a lower volume of cash and cash equivalents than some of our competitors, which may put us at a competitive disadvantage and reduce our flexibility in planning for, or responding to, changing conditions in our industry, including increased competition; and |
| |
• | we may be more vulnerable to economic downturns and adverse developments in our business than some of our competitors. |
We expect to generate cash flow to pay our expenses and to pay the principal and interest on our indebtedness with cash flow from operations or from existing working capital. Our ability to meet our expenses thus depends, to a large extent, on our future performance, which will be affected by financial, business, economic and other factors. We will not be able to control many of these factors, such as economic conditions in the markets where we operate and pressure from competitors. If we do not have sufficient funds, we may be required to refinance all or part of our existing debt, sell assets or borrow additional funds. We cannot guarantee that we will be able to do so on terms acceptable to us, if at all. In addition, the terms of existing or future debt agreements may restrict or limit us from pursuing any of these alternatives.
Our ability to obtain third-party financing may be negatively affected by any downgrade of our credit rating from a rating agency
We consider the availability of third-party financing to be a key component of our long-term strategy to grow our business either through acquisitions or through internal expansion. As of December 31, 2018, our credit ratings were BB, Ba2, and BB by Standard and Poor’s Financial Services, Moody’s Investor Services and Fitch Ratings, respectively, the three primary rating agencies. Any downgrades from these ratings may impact our ability to obtain future additional financing, or to obtain such financing on terms that are favorable to us and therefore, may adversely impact our future operations.
We may not be successful in future expansion and integrating acquisitions.
We may consider growth or expansion of our operations in our current markets or in other areas of the country. We may not be successful in future expansion and integrating future acquisitions. Our expansion into new or existing markets could have a material adverse effect on our cash flows and/or profitability as we may incur costs to integrate new markets into our operations in advance of those operations providing a right-sized impact to our bottom line. The magnitude, timing and nature of any future expansion will depend on a number of factors, including suitable additional markets and/or acquisition candidates, the negotiation of acceptable terms, our financial capabilities, the size of the new business, and general economic and business conditions. New acquisitions may result in the incurrence of additional debt. Acquisitions also involve numerous risks, including difficulties and/or delays in the assimilation and integration of the acquired company’s operations, the incurrence of unanticipated liabilities or expenses, the diversion of management’s attention from other business concerns, risks of entering markets in which we have limited or no direct experience and the potential loss of key employees of the acquired company. In our recent acquisitions in Nashville, Atlanta and Greenville, the integration of the operations was slower than originally anticipated. It cannot be assured that integration delays for future acquisitions will not occur, and such delays could have an impact on our operations and our financial results.
We are subject to extensive government regulations that could cause us to incur significant liabilities or restrict our business activities.
Regulatory requirements could cause us to incur significant liabilities and costs and could restrict our business activities. We are subject to local, state and federal statutes and rules regulating labor and employment matters, relationships with trade partners and their employees, certain developmental matters, as well as building and site design. We are subject to various fees and charges of government authorities designed to defray the cost of providing certain governmental services and improvements. We may be subject to additional costs and delays or may be precluded entirely from building projects because of “no-growth” or “slow-growth” initiatives, building permit ordinances, building moratoriums, or similar government regulations that could be imposed in the future due to health, safety, climate, welfare or environmental concerns. We must also obtain licenses, permits and approvals from government agencies to engage in certain activities, the granting or receipt of which are beyond our control and could cause delays in our homebuilding projects.
We are also subject to a variety of local, state and federal statutes, ordinances, rules and regulations concerning the protection of health and the environment. Environmental laws or permit restrictions may result in project delays, may cause substantial compliance and other costs and may prohibit or severely restrict development in certain environmentally sensitive regions or geographic areas. Environmental regulations can also have an adverse impact on the availability and price of certain raw materials, such as lumber.
Our wholly-owned title company, Carefree Title Agency, provides title insurance and closing settlement services for our homebuyers. The title and settlement services provided by Carefree Title Agency are subject to various regulations, including regulation by state banking and insurance regulations. Potential changes to federal and state laws and regulations could have the effect of limiting our activities or how our mortgage joint venture conducts its operations and this could have an adverse effect on our results of operations.
Our mortgage joint venture is engaged in mortgage broker activities and provides services both to our customers and other homebuyers. The mortgage industry remains under intense scrutiny and continues to face increasing regulation at the federal, state and local level. Although we do not originate mortgages, we are directly or indirectly subject to certain of these regulations. In addition, if we are determined to have violated federal or state regulations, we face the loss of our licenses or other required approvals or we could be subject to fines, penalties, civil actions or we could be required to suspend our activities, each of which could have an adverse effect on our reputation, results and operations.
Legislation relating to energy and climate change could increase our costs to construct homes.
There is a variety of new legislation being enacted, or considered for enactment at the federal, state, local and international levels relating to energy and climate change. This legislation relates to items such as carbon dioxide emissions control and building codes that impose energy efficiency standards. New building code requirements that impose stricter energy
efficiency standards could significantly increase our cost to construct homes. As climate change concerns continue to grow, legislation and regulations of this nature are expected to continue and become more costly to comply with. Similarly, energy-related initiatives affect a wide variety of companies throughout the United States and the world and because our operations are heavily dependent on significant amounts of raw materials, such as lumber, steel, and concrete, they could have an indirect adverse impact on our operations and profitability to the extent the manufacturers and suppliers of our materials are burdened with expensive cap and trade and similar energy-related regulations.
Our ability to build energy-efficient technologies at a profitable price point may be replicated by other builders in the future, which could reduce our competitive advantage.
We believe we currently have a competitive advantage over many of the other production homebuilders by virtue of our energy efficiency technologies. Our communities offer a high level of energy-saving features included in the base price of our homes, and most of our home plans are engineered to facilitate the incorporation of optional solar features to further optimize energy savings. If other builders are able to replicate our energy efficient technologies and offer them at a similar price point or are required to do so by changing regulatory standards, it could diminish our competitive advantage in the marketplace.
Information technology failures and data security breaches could harm our business.
We use information technology and other computer resources to carry out important operational and marketing activities as well as maintain our business records. Many of these resources are provided to us and/or maintained on our behalf by third-party service providers pursuant to agreements that specify certain security and service level standards. Although we and our service providers employ what we believe are adequate security, disaster recovery and other preventative and corrective measures, our ability to conduct our business may be impaired if these resources are compromised, degraded, damaged or fail, whether due to a virus or other harmful circumstance, intentional penetration or disruption of our information technology resources by a third party, natural disaster, hardware or software corruption or failure or error (including a failure of security controls incorporated into or applied to such hardware or software), telecommunications system failure, service provider error or failure, intentional or unintentional personnel actions (including the failure to follow our security protocols), or lost connectivity to our networked resources.
A significant and extended disruption in the functioning of these resources could damage our reputation and cause us to lose customers, sales, result in the unintended public disclosure or the misappropriation of proprietary, personal and confidential information (including information about our homebuyers, employees and business partners), and require us to incur significant expense to address and resolve these kinds of issues. The release of confidential information may also lead to litigation or other proceedings against us by affected individuals and/or business partners and/or by regulators, and the outcome of such proceedings, which could include penalties or fines, could have a material and adverse effect on our consolidated financial statements and reputation. In addition, the costs of maintaining adequate protection against such threats, depending on their evolution, pervasiveness and frequency and/or government-mandated standards or obligations regarding protective efforts, are expected to continue to increase and could be material to our consolidated financial statements.
Negative publicity could adversely affect our reputation and our business, financial results and stock price.
Unfavorable media related to our industry, company, brand, personnel, operations, business performance, or prospects may impact our stock price and the performance of our business, regardless of its accuracy or inaccuracy. The speed at which negative publicity is disseminated has increased dramatically through the use of electronic communication, including social media outlets, websites, "tweets", and blogs. Our success in maintaining and expanding our brand image depends on our ability to adapt to this rapidly changing media environment. Adverse publicity or negative commentary from any media outlets could damage our reputation and reduce the demand for our homes, which would adversely affect our business.
Any of the above risk factors could have a material adverse effect on any investment in our bonds and common stock. As a result, investors could lose some or all of their investment.
Special Note of Caution Regarding Forward-Looking Statements
In passing the Private Securities Litigation Reform Act of 1995 (“PSLRA”), Congress encouraged public companies to make “forward-looking statements” by creating a safe-harbor to protect companies from securities law liability in connection with forward-looking statements. We intend to qualify both our written and oral forward-looking statements for protection under the PSLRA.
The words “believe,” “expect,” “anticipate,” “forecast,” “plan,” “intend,” “may,” “will,” “should,” “could,” “estimate,” and “project” and similar expressions identify forward-looking statements, which speak only as of the date the statement was made. All statements we make other than statements of historical fact are forward-looking statements within the meaning of that term in Section 27A of the Securities Act of 1933, and Section 21E of the Exchange Act. Forward-looking statements in this Annual Report include statements concerning our belief that we have ample liquidity; our goals and strategies and the anticipated benefits relating thereto; our intentions and the expected benefits and advantages of our product and land positioning strategies, including with respect to our focus on the first-time and first move-up buyer; the benefits of and our intentions to use options to acquire land; our exposure to supplier concentration risk; our delivery of substantially all of our backlog existing as of year end; our positions and our expected outcome relating to litigation in general; the sufficiency of our warranty reserves; our intentions to not pay dividends; growth in the first-time buyer segment that are seeking entry-level homes; the timing, locations and extent of new community openings in 2019; that we may repurchase our debt and equity securities; our non-use of derivative financial instruments; expectations regarding our industry and our business into 2019 and beyond, the demand for and the pricing of our homes; our land and lot acquisition strategy (including that we will redeploy cash to acquire well-positioned finished lots and that we may participate in joint ventures or opportunities outside of our existing markets if opportunities arise and the benefits relating thereto); that we may expand into new markets; the availability of labor and materials for our operations; that we may seek additional debt or equity capital; our expectation that existing guarantees, letters of credit and performance and surety bonds will not be drawn on; the sufficiency of our insurance coverage and warranty reserves; the sufficiency of our capital resources to support our business strategy; the sufficiency of our land pipeline; the impact of new accounting standards and changes in accounting estimates; trends and expectations concerning sales prices, sales orders, cancellations, construction costs, gross margins, land costs and profitability and future home inventories; our future cash needs; the impact of seasonality; and our future compliance with debt covenants.
Important factors currently known to management that could cause actual results to differ materially from those in forward-looking statements, and that could negatively affect our business are discussed above in this report under the heading “Risk Factors.”
Forward-looking statements express expectations of future events. All forward-looking statements are inherently uncertain as they are based on various expectations and assumptions concerning future events and they are subject to numerous known and unknown risks and uncertainties that could cause actual events or results to differ materially from those projected. Due to these inherent uncertainties, the investment community is urged not to place undue reliance on forward-looking statements. In addition, we undertake no obligations to update or revise forward-looking statements to reflect changed assumptions, the occurrence of unanticipated events or changes to projections over time, except as required by law.
Item 1B. Unresolved Staff Comments
None.
Item 2. Properties
Our corporate office is in a leased building located in Scottsdale, Arizona with 68,393 square feet and a September 30, 2023 lease expiration.
We lease an aggregate of approximately 337,000 square feet of office space (of which approximately 15,000 square feet is currently subleased by us to third parties) in our markets for our operating divisions, corporate and executive offices.
Item 3. Legal Proceedings
We are involved in various routine legal and regulatory proceedings, including, without limitation, warranty claims and litigation and arbitration proceedings alleging construction defects. In general, the proceedings are incidental to our business, and most exposure is subject to and should be covered by warranty and indemnity obligations of our consultants and subcontractors. Additionally, some such claims are also covered by insurance. In addition to our warranty reserve, we have approximately $439,000 of total reserves not related to warranty or construction defect matters. See Note 1 and Note 15 of the accompanying consolidated financial statements for additional information related to construction defect and warranty related reserves. With respect to the majority of pending litigation matters, our ultimate legal and financial responsibility, if any, cannot be estimated with certainty and, in most cases, any potential losses related to these matters are not considered probable. Historically, most disputes regarding warranty claims are resolved prior to litigation.
Since 2010, we were involved in various legal proceedings regarding a Nevada based land acquisition and development joint venture known as South Edge, LLC relating to a Henderson, Nevada project known as Inspirada. In February 2018, we received $4.8 million to settle and conclude our legal claims against certain members of that venture.
We believe there are no pending legal or warranty matters that could have a material adverse impact upon our unaudited consolidated financial condition, results of operations or cash flows that have not been sufficiently reserved.
Item 4. Mine Safety Disclosures
Not applicable.
PART II
Item 5. Market for Registrant’s Common Equity, Related Stockholder Matters and Issuer Purchases of Equity Securities
Our common stock is listed on the New York Stock Exchange under the symbol "MTH".
On February 1, 2019 there were 175 owners of record of our common stock. A substantially greater number of owners of our common stock are beneficial holders, whose shares of record are held by banks, brokers, and other financial institutions.
The transfer agent for our common stock is Computershare, Inc., 250 Royall Street, Canton, MA 02021 (www.computershare.com).
The following graph compares the five-year total return of our common stock with the S&P 500 Index and the Dow Jones US Home Construction Index. The graph assumes $100 invested as of December 31, 2013 in Meritage Common Stock the S&P 500 Index and the Dow Jones US Home Construction Index, and the re-investment of all dividends. The performance of our common stock depicted in the graphs is not indicative of future performance.
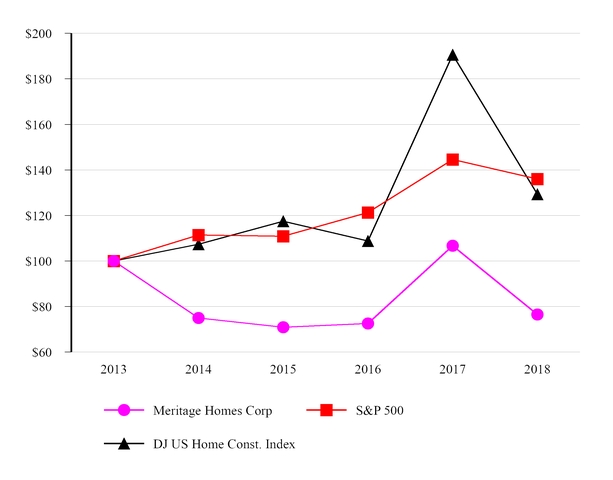
|
| | | | | | | | | | | | | | | | | | |
| | 2013 | | 2014 | | 2015 | | 2016 | | 2017 | | 2018 |
Meritage Homes Corporation | | 100.00 |
| | 74.99 |
| | 70.83 |
| | 72.52 |
| | 106.69 |
| | 76.52 |
|
S&P 500 Index | | 100.00 |
| | 111.42 |
| | 110.83 |
| | 121.30 |
| | 144.56 |
| | 135.96 |
|
Dow Jones US Home Construction Index | | 100.00 |
| | 107.35 |
| | 117.43 |
| | 108.82 |
| | 190.54 |
| | 129.32 |
|
The preceding Performance Graph and related information shall not be deemed to be “soliciting material” or to be “filed” with the Securities and Exchange Commission, nor shall such information be incorporated by reference into any filing under the Securities Act of 1933 or Securities Exchange Act of 1934, each as amended, except to the extent that we specifically incorporate it by reference into such filing.
Historically, we have not declared cash dividends, nor do we intend to declare cash dividends in the foreseeable future. We plan to retain our earnings to finance the continuing operation and growth of the business. Future cash dividends, if any, will depend upon our financial condition, results of operations, capital requirements, statutory requirements, as well as other factors considered relevant by our Board of Directors. See “Management’s Discussion and Analysis of Financial Condition and Results of Operations — Liquidity and Capital Resources”.
Reference is made to Note 10 in the accompanying consolidated financial statements for a description of our stock-based compensation plans.
Issuer Purchases of Equity Securities
On July 25, 2018, our Board of Directors approved a new stock repurchase program, authorizing the expenditure of up to $100.0 million to repurchase shares of our common stock, subject to certain price parameters. This program replaced the previously authorized program that was in place. We acquired 2.6 million shares of our common stock at an aggregate purchase price of $100.0 million between July 30, 2018 and December 31, 2018. The Company retired all shares repurchased. There are no remaining funds available under this program.
A summary of the Company's repurchase activity for the three months ended December 31, 2018 is as follows:
|
| | | | | | | | | | | | | |
Period | Total Number of Shares Purchased | | Average price paid per share | | Total number of shares purchased as part of publicly announced plans or programs | | Approximate dollar value of shares that may yet be purchased under the plans or programs |
October 1, 2018 - October 31, 2018 | 526,800 |
| | $ | 36.26 |
| | 526,800 |
| | $ | 51,544,829 |
|
November 1, 2018 - November 30, 2018 | 1,023,067 |
| | $ | 37.75 |
| | 1,023,067 |
| | $ | 12,921,028 |
|
December 1, 2018 - December 31, 2018 | 347,728 |
| | $ | 37.16 |
| | 347,728 |
| | $ | — |
|
Total | 1,897,595 |
| | | | 1,897,595 |
| | |
Item 6. Selected Financial Data
The following table presents selected historical consolidated financial and operating data of Meritage Homes Corporation and subsidiaries as of and for each of the last five years ended December 31, 2018. The financial data has been derived from our audited consolidated financial statements and related notes for the periods presented. This table should be read in conjunction with “Management’s Discussion and Analysis of Financial Condition and Results of Operations” and the consolidated financial statements and related notes included elsewhere in this Annual Report. These historical results may not be indicative of future results.
|
| | | | | | | | | | | | | | | | | | | | |
| | Historical Consolidated Financial Data Years Ended December 31, |
| | ($ in thousands, except per share amounts) |
| | 2018 | | 2017 | | 2016 | | 2015 | | 2014 |
Income Statement Data: | | | | | | | | | | |
Homebuilding: | | | | | | | | | | |
Total closing revenue | | $ | 3,513,419 |
| | $ | 3,226,772 |
| | $ | 3,029,227 |
| | $ | 2,568,082 |
| | $ | 2,169,643 |
|
Total cost of closings (1) | | (2,884,266 | ) | | (2,660,273 | ) | | (2,498,015 | ) | | (2,079,373 | ) | | (1,717,026 | ) |
Total closing gross profit | | 629,153 |
| | 566,499 |
| | 531,212 |
| | 488,709 |
| | 452,617 |
|
Financial services profit | | 24,044 |
| | 22,055 |
| | 21,902 |
| | 19,271 |
| | 16,178 |
|
Commissions and other sales costs | | (241,897 | ) | | (221,647 | ) | | (215,092 | ) | | (188,418 | ) | | (156,742 | ) |
General and administrative expenses | | (138,478 | ) | | (124,041 | ) | | (123,803 | ) | | (112,849 | ) | | (104,598 | ) |
Earnings/(loss) from unconsolidated entities, net | | 601 |
| | 2,101 |
| | 4,060 |
| | (338 | ) | | (447 | ) |
Interest expense | | (785 | ) | | (3,853 | ) | | (5,172 | ) | | (15,965 | ) | | (5,163 | ) |
Other income/(expense), net | | 10,616 |
| | 6,405 |
| | 4,953 |
| | (946 | ) | | 6,572 |
|
Earnings before income taxes | | 283,254 |
| | 247,519 |
| | 218,060 |
| | 189,464 |
| | 208,417 |
|
Provision for income taxes | | (55,922 | ) | | (104,264 | ) | | (68,519 | ) | | (60,726 | ) | | (66,176 | ) |
Net earnings | | $ | 227,332 |
| | $ | 143,255 |
| | $ | 149,541 |
| | $ | 128,738 |
| | $ | 142,241 |
|
Earnings per common share: | | | | | | | | | | |
Basic | | $ | 5.67 |
| | $ | 3.56 |
| | $ | 3.74 |
| | $ | 3.25 |
| | $ | 3.65 |
|
Diluted (2) | | $ | 5.58 |
| | $ | 3.41 |
| | $ | 3.55 |
| | $ | 3.09 |
| | $ | 3.46 |
|
Balance Sheet Data (December 31): | | | | | | | | | | |
Cash, cash equivalents, investments and securities and restricted cash | | $ | 311,466 |
| | $ | 170,746 |
| | $ | 131,702 |
| | $ | 262,208 |
| | $ | 103,333 |
|
Real estate | | $ | 2,742,621 |
| | $ | 2,731,380 |
| | $ | 2,422,063 |
| | $ | 2,098,302 |
| | $ | 1,877,682 |
|
Total assets (3) | | $ | 3,365,479 |
| | $ | 3,251,258 |
| | $ | 2,888,691 |
| | $ | 2,679,777 |
| | $ | 2,306,011 |
|
Senior and convertible senior notes, net and loans payable and other borrowings (3) | | $ | 1,310,057 |
| | $ | 1,283,804 |
| | $ | 1,127,314 |
| | $ | 1,117,040 |
| | $ | 925,081 |
|
Total liabilities (3) | | $ | 1,644,724 |
| | $ | 1,674,433 |
| | $ | 1,467,196 |
| | $ | 1,420,840 |
| | $ | 1,196,522 |
|
Stockholders’ equity | | $ | 1,720,755 |
| | $ | 1,576,825 |
| | $ | 1,421,495 |
| | $ | 1,258,937 |
| | $ | 1,109,489 |
|
Cash Flow Data: | | | | | | | | | | |
Cash (used in)/provided by: | | | | | | | | | | |
Operating activities | | $ | 262,200 |
| | $ | (87,132 | ) | | $ | (103,402 | ) | | $ | (3,335 | ) | | $ | (211,248 | ) |
Investing activities | | $ | (33,527 | ) | | $ | (17,072 | ) | | $ | (20,106 | ) | | $ | (16,487 | ) | | $ | (62,867 | ) |
Financing activities | | $ | (87,953 | ) | | $ | 143,248 |
| | $ | (6,998 | ) | | $ | 178,697 |
| | $ | 103,312 |
|
| |
(1) | Total cost of closings includes $6.7 million, $6.7 million, $3.8 million, $6.6 million and $3.7 million of home and land impairments for the years ending December 31, 2018, 2017, 2016, 2015 and 2014, respectively. |
| |
(2) | Diluted earnings per common share for the years ended December 31, 2017, 2016, 2015 and 2014 includes adjustments to net earnings to account for the interest attributable to our convertible debt, net of income taxes. See Note 8 of our consolidated financial statements for additional information. |
| |
(3) | Capitalized debt costs were retrospectively reclassified from Prepaids, other assets and goodwill to Senior and convertible senior notes, net as a result of FASB's issuance of ASU 2015-03, Interest - Imputation of Interest (Subtopic 835-30): Simplifying the Presentation of Debt Issuance Costs. Debt costs reclassified from assets to liabilities amounted to $10.7 million, and $10.1 million for December 31, 2015 and 2014, respectively. |
Item 7. Management’s Discussion and Analysis of Financial Condition and Results of Operations
Overview and Outlook
Industry Conditions
2018 was a year of growth and transition for the real estate and homebuilding industries, as they benefited through the first half of the year from strong underlying economic and housing market fundamentals, but that strong demand waned in the second half of 2018 as rising interest rates and home prices caused buyers to delay their home purchasing decisions. This pause in homebuyer activity was most prevalent among move up-buyers, hesitant to sell their existing homes and potentially purchase a new home with a higher underlying interest rate. With the meaningful re-entry of millennials into the home buying market and the desire to downsize in the baby boomer generation, combined with plentiful mortgage availability and improving economic metrics for most segments of the population, we believe this pause is temporary and demand will continue for new homes. Homebuilders with attractive, lower price-point product in desirable locations should be poised to capture this pent-up demand for nicely appointed but affordable homes, as buyers in this environment are primarily motivated by affordability. We believe the longer-term economic data supports continued growth in the current homebuilding cycle, although the outlook of the next several quarters is uncertain as the market absorbs the psychological impact of higher home prices and increasing interest rates.
At Meritage, we continue to focus on our pivot to the first-time and first move-up buyer through our commitment to simplification and our key strategic initiatives of home closing gross margin improvement, selling, general and administrative cost control and community count stability. We believe the successful execution of these initiatives will position us to improve profitability, as we continue our transition. We have made considerable progress as one-third of our current communities are targeted to first-time buyers and those buyers represented approximately 40% of our orders in 2018. We expect to continue to deliver on our initiatives as we are opening an increasing number of communities that target the first-time buyer as well as the first move-up buyer. We believe this strategy will allow us to achieve higher gross margins and better opportunities to leverage our overhead costs.
Summary Company Results
Total home closing revenue increased by 9.0% to $3.5 billion for the year ended December 31, 2018 from $3.2 billion in 2017. Total home closing revenue for the year ended December 31, 2017 was 6.1% higher than the $3.0 billion recorded for the year ended December 31, 2016. Home closing gross margin for the year ended December 31, 2018 improved by 60 basis points to 18.2% while gross margin for both of the years ended December 31, 2017 and 2016 was 17.6%. The improved margin in 2018 reflects efficiencies in our construction process and effective cost controls despite an inflationary cost environment. Improved revenue from higher closing volume resulted in pre-tax net earnings of $283.3 million in 2018 as compared to $247.5 million in 2017 and $218.1 million in 2016. Our 2018 post-tax results benefited significantly from the Tax Act that was enacted in 2017 and became effective beginning in 2018. The result was a 19.7% effective tax rate in 2018 as compared to a 42.1% effective tax rate in 2017. Our effective tax rate in 2016 was 31.4%. The lower rate in 2018 reflects a lower corporate tax rate as a result of the Tax Act as well as additional energy credits captured on homes closed in prior years. The higher rate in 2017 reflects a $19.7 million revaluation of our deferred tax asset for the impact of new corporate tax rates. Refer to Note 11 for additional information related to income taxes. Net income for the year ended December 31, 2018 was $227.3 million compared to $143.3 million in 2017 and $149.5 million in 2016.
Companywide, we experienced increases in closings and orders in 2018 compared to prior year. We ended 2018 with 8,531 closings, a 10.7% increase over 7,709 closings in 2017. Orders improved slightly in 2018 with 8,089 orders for the year compared to 7,957 in 2017. Despite the slight increase in orders, order dollars decreased by 1.7% to $3.2 billion in 2018 compared to $3.3 billion in the prior year related to a 3.3% decrease in average sales price reflecting our transition to entry-level product. At December 31, 2018, our backlog of $1.0 billion on 2,433 units decreased by 18.5% and 15.4%, respectively, compared to $1.2 billion on 2,875 units at December 31, 2017. The decrease in backlog stems from a slowing of orders in the latter part of 2018 due to uncertain market conditions combined with a strong fourth quarter of closings and lower average sales prices from our product mix shift. Our average sales price for homes in backlog decreased by 3.6% compared to prior year at $417,600 from $433,300 at December 31, 2017. Backlog at December 31, 2016 was $1.1 billion on 2,627 units. Our cancellation rate on sales orders as a percentage of gross sales in 2018 increased to 15.7% as compared to 13.4% and 13.1% for the years ended December 31, 2017 and 2016, respectively. Although traffic levels and gross sales in 2018 were on par or an improvement to 2017, an increase in cancellations in the second half of the year reflect heightened caution among buyers as they pause to assess the market.
Company Positioning
We believe that the investments in our new communities, particularly those designed for the first-time and first move-up homebuyer, and industry-leading innovation in energy-efficient product offerings and automation create a differentiated strategy that has aided us in our growth in the highly competitive new home market.
Our focus includes the following strategic initiatives:
| |
• | Expanding the number of LiVE.NOW® communities that target the growing first-time homebuyer; |
| |
• | Improving the overall customer experience, most recently through a simplification of the customer sale, purchase and construction process and option selection process for move-up buyers at Studio M; |
| |
• | Enhancing our website and sales offices through investments in technology. All of our LiVE.NOW® communities feature interactive tools offering homebuyers the ability to search for available homes with their desired home features and based on their preferred availability or move-in dates; |
| |
• | Improving our home closing gross profit by growing revenue while managing costs, allowing us to better leverage our overhead; and |
| |
• | Actively and strategically acquiring and developing land in key markets in order to maintain and grow our lot supply and active community count. |
In order to maintain focus on growing our business, we also remain committed to the following:
| |
• | Increasing orders and order pace through the use of our consumer and market research to ensure that we build homes that offer our buyers their desired features and amenities; |
| |
• | Expanding market share in our smaller markets; |
| |
• | Continuing to innovate and promote our energy efficiency program and our M.Connected® Automation Suite to create differentiation for the Meritage brand; |
| |
• | Managing construction efficiencies and costs through national and regional vendor relationships with a focus on quality construction and warranty management; |
| |
• | Carefully managing our liquidity and a strong balance sheet, as we ended the year with $311.5 million in cash and cash equivalents with a 43.2% debt-to-capital ratio and a 36.7% net debt-to-capital ratio and through the expansion and extension of our Credit Facility; |
| |
• | Maximizing returns to our shareholders, most recently through our share repurchase program; and |
| |
• | Promoting a positive environment for our employees in order to develop and motivate them and to minimize turnover and to maximize recruitment efforts. |
Critical Accounting Policies
We have established various accounting policies that govern the application of United States generally accepted accounting principles (“GAAP”) in the preparation and presentation of our consolidated financial statements. Our significant accounting policies are described in Note 1 of the consolidated financial statements included in this Form 10-K. Certain of these policies involve significant judgments, assumptions and estimates by management that may have a material impact on the carrying value of certain assets and liabilities, and revenue and costs. We are subject to uncertainties such as the impact of future events, economic, environmental, political and regulatory factors and changes in our business environment; therefore, actual results could differ from these estimates. Accordingly, the accounting estimates used in the preparation of our financial statements may change as new events occur, as more experience is acquired, as additional information is obtained and as our operating environment changes. Changes in estimates are revised when circumstances warrant. Such changes in estimates and refinements in methodologies are reflected in our reported results of operations and, if material, the effects of changes in estimates are disclosed in the notes to our consolidated financial statements. The judgments, assumptions and estimates we use and believe to be critical to our business are based on historical experience, knowledge of the accounts, industry practices, and other factors, which we believe to be reasonable under the circumstances. Because of the nature of the judgments and assumptions we have made, actual results may differ from these judgments and estimates and could have a material impact on the carrying values of assets and liabilities and the results of our operations.
The accounting policies that we deem most critical to us and involve the most difficult, subjective or complex judgments are as follows:
Revenue Recognition
We recognize revenue in accordance with ASC 606 Revenue from Contracts with Customers, by applying the following steps in determining the timing and amount of revenue to recognize: (1) identify the contract with our customer; (2) identify the performance obligation(s) in the contract; (3) determine the transaction price; (4) allocate the transaction price to the
performance obligations in the contract, if applicable; and (5) recognize revenue when (or as) we satisfy the performance obligation. The performance obligation and subsequent revenue recognition for our three sources of revenue are outlined below:
| |
• | Revenue from closings of residential real estate is recognized when closings have occurred, the risks and rewards of ownership are transferred to the buyer, and we have no continuing involvement with the property, which is generally upon the close of escrow. Revenue is reported net of any discounts and incentives. |
| |
• | Revenue from land sales is recognized when a significant down payment is received, title passes and collectability of the receivable is reasonably assured, and we have no continuing involvement with the property, which is generally upon the close of escrow. |
| |
• | Revenue from financial services is recognized when closings have occurred and all financial services have been rendered, which is generally upon the close of escrow. |
Real Estate
Real estate is stated at cost unless the community or land is determined to be impaired, at which point the inventory is written down to fair value as required by Financial Accounting Standards Board (“FASB”) Accounting Standards Codification (“ASC”) 360-10, Property, Plant and Equipment. Inventory includes the costs of land acquisition, land development and home construction, capitalized interest, real estate taxes, direct overhead costs incurred during development and home construction that benefit the entire community, less impairments, if any. Land and development costs are typically allocated and transferred to homes under construction when home construction begins. Home construction costs are accumulated on a per-home basis. Cost of home closings includes the specific construction costs of the home and all related allocated land acquisition, land development and other common costs (both incurred and estimated to be incurred) based upon the total number of homes expected to be closed in each community or phase. Any changes to the estimated total development costs of a community or phase are allocated to the remaining homes in the community or phase. When a home closes, we may have incurred costs for goods and services that have not yet been paid. Therefore, an accrual to capture such obligations is recorded in connection with the home closing and charged directly to cost of sales.
We rely on certain estimates to determine our construction and land development costs. Construction and land costs are comprised of direct and allocated costs, including estimated future costs. In determining these costs, we compile project budgets that are based on a variety of assumptions, including future construction schedules and costs to be incurred. Actual results can differ from these budgeted amounts for various reasons, including construction delays, labor or material shortages, slower absorptions, increases in costs that have not yet been committed, changes in governmental requirements, or other unanticipated issues encountered during construction and development and other factors beyond our control. To address uncertainty in these budgets, we assess, update and revise project budgets on a regular basis, utilizing the most current information available to estimate construction and land costs.
Typically, an entitled community’s life cycle ranges from three to five years, commencing with the acquisition of the land, continuing through the land development phase and concluding with the sale, construction and closing of the homes. Actual community lives will vary based on the size of the community, the absorption rates and whether the land purchased was raw land or finished lots. Master-planned communities encompassing several phases and super-block land parcels may have significantly longer lives and projects involving smaller finished lot purchases may be significantly shorter.
All of our land inventory and related real estate assets are reviewed for recoverability, as our inventory is considered “long-lived” in accordance with GAAP. Impairment charges are recorded to write down an asset to its estimated fair value if the undiscounted cash flows expected to be generated by the asset are lower than its carrying amount. Our determination of fair value is based on projections and estimates. Changes in these expectations may lead to a change in the outcome of our impairment analysis, and actual results may also differ from our assumptions. Our analysis is conducted if indicators of a decline in value of our land and real estate assets exist. If an asset is deemed to be impaired, the impairment recognized is measured as the amount by which the assets’ carrying amount exceeds their fair value. The impairment of a community is allocated to each lot on a straight-line basis.
Goodwill
Goodwill represents the excess of the purchase price paid over the fair value of the net assets acquired in business combinations. Goodwill was $33.0 million as of December 31, 2018 and December 31, 2017. In accordance with ASC 350, Intangibles, Goodwill and Other ("ASC 350"), we analyze goodwill on an annual basis (or whenever indicators of impairment exist) through a qualitative assessment to determine whether it is necessary to perform a two-step goodwill impairment test. ASC 350 states that an entity may assess qualitative factors to determine whether it is more likely than not that the fair value of a reporting unit is less than its carrying amount, including goodwill. Such qualitative factors include: (1) macroeconomic conditions, such as a deterioration in general economic conditions, (2) industry and market considerations such as deterioration in the environment in which the entity operates, (3) cost factors such as increases in raw materials, labor costs, etc., and (4) overall financial performance such as negative or declining cash flows or a decline in actual or planned revenue or earnings. If the qualitative analysis determines that additional impairment testing is required, the two-step impairment testing in accordance with ASC 350 would be initiated. We continually evaluate our qualitative inputs to assess whether events and circumstances have occurred that indicate the goodwill balance may not be recoverable.
Warranty Reserves
We use subcontractors for nearly all aspects of home construction. Although our subcontractors are generally required to repair and replace any product or labor defects and cover any resultant damages, we are, during applicable warranty periods, ultimately responsible to the homeowner for making such repairs. As such, warranty reserves are recorded to cover our exposure to costs for materials and labor not expected to be covered by our subcontractors to the extent they relate to warranty-type claims subsequent to the delivery of a home to the homeowner. Reserves are reviewed on a regular basis and, with the assistance of an actuary for the structural warranty, we determine their sufficiency based on our and industry-wide historical data and trends. These reserves are subject to variability due to uncertainties regarding structural defect claims for the products we build, the markets in which we build, claim settlement history, insurance, legal interpretations and expected recoveries, among other factors.
At December 31, 2018, our warranty reserve was $24.6 million, reflecting an accrual of 0.1% to 0.6% of a home’s sale price depending on our loss history in the geographic area in which the home was built. A 10% increase in our warranty reserve rate would have increased our accrual and corresponding cost of sales by approximately $1.6 million in 2018. There were no adjustments to our reserve in 2018 and we recorded net favorable adjustments to our reserve of $1.6 million in 2017. These adjustments were based on historical trends of actual claims paid combined with our success in recovery of expended amounts and the composition of the homes covered under warranty. While we believe that the warranty reserve is sufficient to cover our projected costs, there can be no assurances that historical data and trends will accurately predict our actual warranty costs. Furthermore, there can be no assurances that future economic, financial or legislative developments might not lead to a significant change in the reserve.
Valuation of Deferred Tax Assets
We account for income taxes using the asset and liability method, which requires that deferred tax assets and liabilities be recognized based on future tax consequences of both temporary differences between the financial statement carrying amounts of existing assets and liabilities and their respective tax bases. Deferred tax assets and liabilities are measured using enacted tax rates expected to apply in the years in which the temporary differences are expected to be recovered or settled. The effect on deferred tax assets and liabilities of a change in tax rates is recognized in earnings in the period when the changes are enacted.
On December 22, 2017, the President signed into law the Tax Act. In accordance with ASC 740-10-25-47, we recognized the effects of the new legislation in the period that included the date of enactment. The Tax Act's impact on 2017 was to reduce the value of our net deferred tax balances by $19.7 million at December 31, 2017, which was estimated due to the change in the federal tax rate and has been reflected in our financial statements. At December 31, 2018, we have completed our accounting for the income tax effects of the Tax Act on our deferred tax assets. In accordance with SEC Staff Accounting Bulletin No. 118 and ASC 740, we have revised the valuation of our 2017 deferred tax assets for the impact of the Tax Act based on completion of our 2017 income tax returns. Accordingly, in 2018 we recorded a favorable adjustment of $2.7 million which has been reflected in our financial statements.
In accordance with ASC 740-10, Income Taxes, we evaluate our deferred tax assets by tax jurisdiction, including the benefit from net operating losses ("NOLs") by tax jurisdiction, to determine if a valuation allowance is required. Companies must assess, using significant judgments, whether a valuation allowance should be established based on the consideration of all available evidence using a “more likely than not” standard with significant weight being given to evidence that can be objectively verified. This assessment considers, among other matters, the nature, frequency and severity of current and cumulative losses, forecasts of future profitability, the length of statutory carryforward periods, experience with operating
losses and experience of utilizing tax credit carryforwards and tax planning alternatives. We have no valuation allowance on our deferred tax assets and NOL carryovers at December 31, 2018.
Home Closing Revenue, Home Orders and Order Backlog - Segment Analysis
The composition of our closings, home orders and backlog is constantly changing and is based on a dissimilar mix of communities between periods as new projects and product lines open and existing projects wind down. Further, individual homes within a community can range significantly in price due to differing square footage, option selections, lot sizes and quality and location of lots (e.g. cul-de-sac, view lots, greenbelt lots). These variations result in a lack of meaningful comparability between our home orders, closings and backlog due to the changing mix between periods. The tables on the following pages present operating and financial data that we consider most critical to managing our operations (dollars in thousands): |
| | | | | | | | | | | | | | | |
| | Years Ended December 31, | | Year Over Year |
| | 2018 | | 2017 | | Chg $ | | Chg % |
Home Closing Revenue | | | | | | | | |
Total | | | | | | | | |
Dollars | | $ | 3,474,712 |
| | $ | 3,186,775 |
| | $ | 287,937 |
| | 9.0 | % |
Homes closed | | 8,531 |
| | 7,709 |
| | 822 |
| | 10.7 | % |
Average sales price | | $ | 407.3 |
| | $ | 413.4 |
| | $ | (6.1 | ) | | (1.5 | )% |
West Region | | | | | | | | |
Arizona | | | | | | | | |
Dollars | | $ | 485,867 |
| | $ | 515,410 |
| | $ | (29,543 | ) | | (5.7 | )% |
Homes closed | | 1,505 |
| | 1,535 |
| | (30 | ) | | (2.0 | )% |
Average sales price | | $ | 322.8 |
| | $ | 335.8 |
| | $ | (12.9 | ) | | (3.9 | )% |
California | | | | | | | | |
Dollars | | $ | 588,975 |
| | $ | 581,016 |
| | $ | 7,959 |
| | 1.4 | % |
Homes closed | | 849 |
| | 963 |
| | (114 | ) | | (11.8 | )% |
Average sales price | | $ | 693.7 |
| | $ | 603.3 |
| | $ | 90.4 |
| | 15.0 | % |
Colorado | | | | | | | | |
Dollars | | $ | 342,984 |
| | $ | 323,318 |
| | $ | 19,666 |
| | 6.1 | % |
Homes closed | | 628 |
| | 571 |
| | 57 |
| | 10.0 | % |
Average sales price | | $ | 546.2 |
| | $ | 566.2 |
| | $ | (20.1 | ) | | (3.5 | )% |
West Region Totals | | | | | | | | |
Dollars | | $ | 1,417,826 |
| | $ | 1,419,744 |
| | $ | (1,918 | ) | | (0.1 | )% |
Homes closed | | 2,982 |
| | 3,069 |
| | (87 | ) | | (2.8 | )% |
Average sales price | | $ | 475.5 |
| | $ | 462.6 |
| | $ | 12.9 |
| | 2.8 | % |
Central Region - Texas | | | | | | | | |
Central Region Totals | | | | | | | | |
Dollars | | $ | 1,006,221 |
| | $ | 904,286 |
| | $ | 101,935 |
| | 11.3 | % |
Homes closed | | 2,840 |
| | 2,493 |
| | 347 |
| | 13.9 | % |
Average sales price | | $ | 354.3 |
| | $ | 362.7 |
| | $ | (8.4 | ) | | (2.3 | )% |
East Region | | | | | | | | |
Florida | | | | | | | | |
Dollars | | $ | 455,292 |
| | $ | 353,554 |
| | $ | 101,738 |
| | 28.8 | % |
Homes closed | | 1,078 |
| | 814 |
| | 264 |
| | 32.4 | % |
Average sales price | | $ | 422.3 |
| | $ | 434.3 |
| | $ | (12.0 | ) | | (2.8 | )% |
Georgia | | | | | | | | |
Dollars | | $ | 161,969 |
| | $ | 104,690 |
| | $ | 57,279 |
| | 54.7 | % |
Homes closed | | 468 |
| | 312 |
| | 156 |
| | 50.0 | % |
Average sales price | | $ | 346.1 |
| | $ | 335.5 |
| | $ | 10.5 |
| | 3.1 | % |
North Carolina | | | | | | | | |
Dollars | | $ | 254,207 |
| | $ | 233,028 |
| | $ | 21,179 |
| | 9.1 | % |
Homes closed | | 654 |
| | 533 |
| | 121 |
| | 22.7 | % |
Average sales price | | $ | 388.7 |
| | $ | 437.2 |
| | $ | (48.5 | ) | | (11.1 | )% |
South Carolina | | | | | | | | |
Dollars | | $ | 104,622 |
| | $ | 104,942 |
| | $ | (320 | ) | | (0.3 | )% |
Homes closed | | 309 |
| | 307 |
| | 2 |
| | 0.7 | % |
Average sales price | | $ | 338.6 |
| | $ | 341.8 |
| | $ | (3.2 | ) | | (0.9 | )% |
Tennessee | | | | | | | | |
Dollars | | $ | 74,575 |
| | $ | 66,531 |
| | $ | 8,044 |
| | 12.1 | % |
Homes closed | | 200 |
| | 181 |
| | 19 |
| | 10.5 | % |
Average sales price | | $ | 372.9 |
| | $ | 367.6 |
| | $ | 5.3 |
| | 1.4 | % |
East Region Totals | | | | | | | | |
Dollars | | $ | 1,050,665 |
| | $ | 862,745 |
| | $ | 187,920 |
| | 21.8 | % |
Homes closed | | 2,709 |
| | 2,147 |
| | 562 |
| | 26.2 | % |
Average sales price | | $ | 387.8 |
| | $ | 401.8 |
| | $ | (14.0 | ) | | (3.5 | )% |
|
| | | | | | | | | | | | | | | |
| | Years Ended December 31, | | Year Over Year |
| | 2017 | | 2016 | | Chg $ | | Chg % |
Home Closing Revenue | | | | | | | | |
Total | | | | | | | | |
Dollars | | $ | 3,186,775 |
| | $ | 3,003,426 |
| | $ | 183,349 |
| | 6.1 | % |
Homes closed | | 7,709 |
| | 7,355 |
| | 354 |
| | 4.8 | % |
Average sales price | | $ | 413.4 |
| | $ | 408.4 |
| | $ | 5.0 |
| | 1.2 | % |
West Region | | | | | | | | |
Arizona | | | | | | | | |
Dollars | | $ | 515,410 |
| | $ | 384,767 |
| | $ | 130,643 |
| | 34.0 | % |
Homes closed | | 1,535 |
| | 1,122 |
| | 413 |
| | 36.8 | % |
Average sales price | | $ | 335.8 |
| | $ | 342.9 |
| | $ | (7.2 | ) | | (2.1 | )% |
California | | | | | | | | |
Dollars | | $ | 581,016 |
| | $ | 590,340 |
| | $ | (9,324 | ) | | (1.6 | )% |
Homes closed | | 963 |
| | 1,020 |
| | (57 | ) | | (5.6 | )% |
Average sales price | | $ | 603.3 |
| | $ | 578.8 |
| | $ | 24.6 |
| | 4.2 | % |
Colorado | | | | | | | | |
Dollars | | $ | 323,318 |
| | $ | 310,191 |
| | $ | 13,127 |
| | 4.2 | % |
Homes closed | | 571 |
| | 634 |
| | (63 | ) | | (9.9 | )% |
Average sales price | | $ | 566.2 |
| | $ | 489.3 |
| | $ | 77.0 |
| | 15.7 | % |
West Region Totals | | | | | | | | |
Dollars | | $ | 1,419,744 |
| | $ | 1,285,298 |
| | $ | 134,446 |
| | 10.5 | % |
Homes closed | | 3,069 |
| | 2,776 |
| | 293 |
| | 10.6 | % |
Average sales price | | $ | 462.6 |
| | $ | 463.0 |
| | $ | (0.4 | ) | | (0.1 | )% |
Central Region - Texas | | | | | | | | |
Central Region Totals | | | | | | | | |
Dollars | | $ | 904,286 |
| | $ | 778,964 |
| | $ | 125,322 |
| | 16.1 | % |
Homes closed | | 2,493 |
| | 2,130 |
| | 363 |
| | 17.0 | % |
Average sales price | | $ | 362.7 |
| | $ | 365.7 |
| | $ | (3.0 | ) | | (0.8 | )% |
East Region | | | | | | | | |
Florida | | | | | | | | |
Dollars | | $ | 353,554 |
| | $ | 368,564 |
| | $ | (15,010 | ) | | (4.1 | )% |
Homes closed | | 814 |
| | $ | 895 |
| | (81 | ) | | (9.1 | )% |
Average sales price | | $ | 434.3 |
| | $ | 411.8 |
| | $ | 22.5 |
| | 5.5 | % |
Georgia | | | | | | | | |
Dollars | | $ | 104,690 |
| | $ | 114,137 |
| | $ | (9,447 | ) | | (8.3 | )% |
Homes closed | | 312 |
| | 337 |
| | (25 | ) | | (7.4 | )% |
Average sales price | | $ | 335.5 |
| | $ | 338.7 |
| | $ | (3.1 | ) | | (0.9 | )% |
North Carolina | | | | | | | | |
Dollars | | $ | 233,028 |
| | $ | 278,747 |
| | $ | (45,719 | ) | | (16.4 | )% |
Homes closed | | 533 |
| | 672 |
| | (139 | ) | | (20.7 | )% |
Average sales price | | $ | 437.2 |
| | $ | 414.8 |
| | $ | 22.4 |
| | 5.4 | % |
South Carolina | | | | | | | | |
Dollars | | $ | 104,942 |
| | $ | 103,851 |
| | $ | 1,091 |
| | 1.1 | % |
Homes closed | | 307 |
| | 328 |
| | (21 | ) | | (6.4 | )% |
Average sales price | | $ | 341.8 |
| | $ | 316.6 |
| | $ | 25.2 |
| | 8.0 | % |
Tennessee | | | | | | | | |
Dollars | | $ | 66,531 |
| | $ | 73,865 |
| | $ | (7,334 | ) | | (9.9 | )% |
Homes closed | | 181 |
| | 217 |
| | (36 | ) | | (16.6 | )% |
Average sales price | | $ | 367.6 |
| | $ | 340.4 |
| | $ | 27.2 |
| | 8.0 | % |
East Region Totals | | | | | | | | |
Dollars | | $ | 862,745 |
| | $ | 939,164 |
| | $ | (76,419 | ) | | (8.1 | )% |
Homes closed | | 2,147 |
| | 2,449 |
| | (302 | ) | | (12.3 | )% |
Average sales price | | $ | 401.8 |
| | $ | 383.5 |
| | $ | 18.3 |
| | 4.8 | % |
|
| | | | | | | | | | | | | | | |
| | | | | | | | |
| | Years Ended December 31, | | Year Over Year |
| | 2018 | | 2017 | | Chg $ | | Chg % |
Home Orders (1) | | | | | | | | |
Total | | | | | | | | |
Dollars | | $ | 3,240,091 |
| | $ | 3,296,788 |
| | $ | (56,697 | ) | | (1.7 | )% |
Homes ordered | | 8,089 |
| | 7,957 |
| | 132 |
| | 1.7 | % |
Average sales price | | $ | 400.6 |
| | $ | 414.3 |
| | $ | (13.8 | ) | | (3.3 | )% |
West Region | | | | | | | | |
Arizona | | | | | | | | |
Dollars | | $ | 499,353 |
| | $ | 473,602 |
| | $ | 25,751 |
| | 5.4 | % |
Homes ordered | | 1,522 |
| | 1,417 |
| | 105 |
| | 7.4 | % |
Average sales price | | $ | 328.1 |
| | $ | 334.2 |
| | $ | (6.1 | ) | | (1.8 | )% |
California | | | | | | | | |
Dollars | | $ | 432,134 |
| | $ | 650,287 |
| | $ | (218,153 | ) | | (33.5 | )% |
Homes ordered | | 622 |
| | 1,050 |
| | (428 | ) | | (40.8 | )% |
Average sales price | | $ | 694.7 |
| | $ | 619.3 |
| | $ | 75.4 |
| | 12.2 | % |
Colorado | | | | | | | | |
Dollars | | $ | 331,389 |
| | $ | 284,082 |
| | $ | 47,307 |
| | 16.7 | % |
Homes ordered | | 614 |
| | 497 |
| | 117 |
| | 23.5 | % |
Average sales price | | $ | 539.7 |
| | $ | 571.6 |
| | $ | (31.9 | ) | | (5.6 | )% |
West Region Totals | | | | | | | | |
Dollars | | $ | 1,262,876 |
| | $ | 1,407,971 |
| | $ | (145,095 | ) | | (10.3 | )% |
Homes ordered | | 2,758 |
| | 2,964 |
| | (206 | ) | | (7.0 | )% |
Average sales price | | $ | 457.9 |
| | $ | 475.0 |
| | $ | (17.1 | ) | | (3.6 | )% |
Central Region - Texas | | | | | | | | |
Central Region Totals | | | | | | | | |
Dollars | | $ | 995,473 |
| | $ | 931,069 |
| | $ | 64,404 |
| | 6.9 | % |
Homes ordered | | 2,801 |
| | 2,582 |
| | 219 |
| | 8.5 | % |
Average sales price | | $ | 355.4 |
| | $ | 360.6 |
| | $ | (5.2 | ) | | (1.4 | )% |
East Region | | | | | | | | |
Florida | | | | | | | | |
Dollars | | $ | 422,925 |
| | $ | 433,365 |
| | $ | (10,440 | ) | | (2.4 | )% |
Homes ordered | | 1,004 |
| | 1,007 |
| | (3 | ) | | (0.3 | )% |
Average sales price | | $ | 421.2 |
| | $ | 430.4 |
| | $ | (9.1 | ) | | (2.1 | )% |
Georgia | | | | | | | | |
Dollars | | $ | 157,706 |
| | $ | 121,713 |
| | $ | 35,993 |
| | 29.6 | % |
Homes ordered | | 440 |
| | 372 |
| | 68 |
| | 18.3 | % |
Average sales price | | $ | 358.4 |
| | $ | 327.2 |
| | $ | 31.2 |
| | 9.5 | % |
North Carolina | | | | | | | | |
Dollars | | $ | 224,552 |
| | $ | 242,355 |
| | $ | (17,803 | ) | | (7.3 | )% |
Homes ordered | | 588 |
| | 583 |
| | 5 |
| | 0.9 | % |
Average sales price | | $ | 381.9 |
| | $ | 415.7 |
| | $ | (33.8 | ) | | (8.1 | )% |
South Carolina | | | | | | | | |
Dollars | | $ | 101,426 |
| | $ | 99,738 |
| | $ | 1,688 |
| | 1.7 | % |
Homes ordered | | 299 |
| | 290 |
| | 9 |
| | 3.1 | % |
Average sales price | | $ | 339.2 |
| | $ | 343.9 |
| | $ | (4.7 | ) | | (1.4 | )% |
Tennessee | | | | | | | | |
Dollars | | $ | 75,133 |
| | $ | 60,577 |
| | $ | 14,556 |
| | 24.0 | % |
Homes ordered | | 199 |
| | 159 |
| | 40 |
| | 25.2 | % |
Average sales price | | $ | 377.6 |
| | $ | 381.0 |
| | $ | (3.4 | ) | | (0.9 | )% |
East Region Totals | | | | | | | | |
Dollars | | $ | 981,742 |
| | $ | 957,748 |
| | $ | 23,994 |
| | 2.5 | % |
Homes ordered | | 2,530 |
| | 2,411 |
| | 119 |
| | 4.9 | % |
Average sales price | | $ | 388.0 |
| | $ | 397.2 |
| | $ | (9.2 | ) | | (2.3 | )% |
| |
(1) | Home orders for any period represent the aggregate sales price of all homes ordered, net of cancellations. We do not include orders contingent upon the sale of a customer’s existing home as a sales contract until the contingency is removed. |
|
| | | | | | | | | | | | | | | |
| | Years Ended December 31, | | Year Over Year |
| | 2017 | | 2016 | | Chg $ | | Chg % |
Home Orders (1) | | | | | | | | |
Total | | | | | | | | |
Dollars | | $ | 3,296,788 |
| | $ | 3,001,503 |
| | $ | 295,285 |
| | 9.8 | % |
Homes ordered | | 7,957 |
| | 7,290 |
| | 667 |
| | 9.1 | % |
Average sales price | | $ | 414.3 |
| | $ | 411.7 |
| | $ | 2.6 |
| | 0.6 | % |
West Region | | | | | | | | |
Arizona | | | | | | | | |
Dollars | | $ | 473,602 |
| | $ | 428,204 |
| | $ | 45,398 |
| | 10.6 | % |
Homes ordered | | 1,417 |
| | 1,249 |
| | 168 |
| | 13.5 | % |
Average sales price | | $ | 334.2 |
| | $ | 342.8 |
| | $ | (8.6 | ) | | (2.5 | )% |
California | | | | | | | | |
Dollars | | $ | 650,287 |
| | $ | 559,832 |
| | $ | 90,455 |
| | 16.2 | % |
Homes ordered | | 1,050 |
| | 962 |
| | 88 |
| | 9.1 | % |
Average sales price | | $ | 619.3 |
| | $ | 581.9 |
| | $ | 37.4 |
| | 6.4 | % |
Colorado | | | | | | | | |
Dollars | | $ | 284,082 |
| | $ | 302,124 |
| | $ | (18,042 | ) | | (6.0 | )% |
Homes ordered | | 497 |
| | 575 |
| | (78 | ) | | (13.6 | )% |
Average sales price | | $ | 571.6 |
| | $ | 525.4 |
| | $ | 46.2 |
| | 8.8 | % |
West Region Totals | | | | | | | | |
Dollars | | $ | 1,407,971 |
| | $ | 1,290,160 |
| | $ | 117,811 |
| | 9.1 | % |
Homes ordered | | 2,964 |
| | 2,786 |
| | 178 |
| | 6.4 | % |
Average sales price | | $ | 475.0 |
| | $ | 463.1 |
| | $ | 11.9 |
| | 2.6 | % |
Central Region - Texas | | | | | | | | |
Central Region Totals | | | | | | | | |
Dollars | | $ | 931,069 |
| | $ | 783,504 |
| | $ | 147,565 |
| | 18.8 | % |
Homes ordered | | 2,582 |
| | 2,119 |
| | 463 |
| | 21.8 | % |
Average sales price | | $ | 360.6 |
| | $ | 369.8 |
| | $ | (9.2 | ) | | (2.5 | )% |
East Region | | | | | | | | |
Florida | | | | | | | | |
Dollars | | $ | 433,365 |
| | $ | 367,012 |
| | $ | 66,353 |
| | 18.1 | % |
Homes ordered | | 1,007 |
| | 861 |
| | 146 |
| | 17.0 | % |
Average sales price | | $ | 430.4 |
| | $ | 426.3 |
| | $ | 4.1 |
| | 1.0 | % |
Georgia | | | | | | | | |
Dollars | | $ | 121,713 |
| | $ | 114,074 |
| | $ | 7,639 |
| | 6.7 | % |
Homes ordered | | 372 |
| | 333 |
| | 39 |
| | 11.7 | % |
Average sales price | | $ | 327.2 |
| | $ | 342.6 |
| | $ | (15.4 | ) | | (4.5 | )% |
North Carolina | | | | | | | | |
Dollars | | $ | 242,355 |
| | $ | 254,521 |
| | $ | (12,166 | ) | | (4.8 | )% |
Homes ordered | | 583 |
| | 605 |
| | (22 | ) | | (3.6 | )% |
Average sales price | | $ | 415.7 |
| | $ | 420.7 |
| | $ | (5.0 | ) | | (1.2 | )% |
South Carolina | | | | | | | | |
Dollars | | $ | 99,738 |
| | $ | 114,376 |
| | $ | (14,638 | ) | | (12.8 | )% |
Homes ordered | | 290 |
| | 356 |
| | (66 | ) | | (18.5 | )% |
Average sales price | | $ | 343.9 |
| | $ | 321.3 |
| | $ | 22.6 |
| | 7.0 | % |
Tennessee | | | | | | | | |
Dollars | | $ | 60,577 |
| | $ | 77,856 |
| | $ | (17,279 | ) | | (22.2 | )% |
Homes ordered | | 159 |
| | 230 |
| | (71 | ) | | (30.9 | )% |
Average sales price | | $ | 381.0 |
| | $ | 338.5 |
| | $ | 42.5 |
| | 12.6 | % |
East Region Totals | | | | | | | | |
Dollars | | $ | 957,748 |
| | $ | 927,839 |
| | $ | 29,909 |
| | 3.2 | % |
Homes ordered | | 2,411 |
| | 2,385 |
| | 26 |
| | 1.1 | % |
Average sales price | | $ | 397.2 |
| | $ | 389.0 |
| | $ | 8.2 |
| | 2.1 | % |
| |
(1) | Home orders for any period represent the aggregate sales price of all homes ordered, net of cancellations. We do not include orders contingent upon the sale of a customer’s existing home as a sales contract until the contingency is removed. |
|
| | | | | | | | | | | | | | | | | |
| | | | | | | | | | | |
| Years Ended December 31, |
| 2018 | | 2017 | | 2016 |
| Ending | | Average | | Ending | | Average | | Ending | | Average |
Active Communities | | | | | | | | | | | |
Total | 272 |
| | 258.0 |
| | 244 |
| | 243.5 |
| | 243 |
| | 248.5 |
|
West Region | | | | | | | | | | | |
Arizona | 40 |
| | 39.0 |
| | 38 |
| | 40.0 |
| | 42 |
| | 41.5 |
|
California | 17 |
| | 18.5 |
| | 20 |
| | 24.0 |
| | 28 |
| | 26.0 |
|
Colorado | 20 |
| | 15.5 |
| | 11 |
| | 10.5 |
| | 10 |
| | 13.0 |
|
West Region Totals | 77 |
| | 73 |
| | 69 |
| | 74.5 |
| | 80 |
| | 80.5 |
|
Central Region - Texas | | | | | | | | | | | |
Central Region Totals | 95 |
| | 93.5 |
| | 92 |
| | 86.0 |
| | 80 |
| | 76.0 |
|
East Region | | | | | | | | | | | |
Florida | 31 |
| | 29.5 |
| | 28 |
| | 27.5 |
| | 27 |
| | 29.0 |
|
Georgia | 22 |
| | 20.5 |
| | 19 |
| | 18.0 |
| | 17 |
| | 17.0 |
|
North Carolina | 25 |
| | 21.0 |
| | 17 |
| | 17.0 |
| | 17 |
| | 21.5 |
|
South Carolina | 12 |
| | 12.5 |
| | 13 |
| | 14.0 |
| | 15 |
| | 16.5 |
|
Tennessee | 10 |
| | 8.0 |
| | 6 |
| | 6.5 |
| | 7 |
| | 8.0 |
|
East Region Totals | 100 |
| | 91.5 |
| | 83 |
| | 83.0 |
| | 83 |
| | 92.0 |
|
|
| | | | | | | | | |
| | | | | | |
| | Years Ended December 31, |
| | 2018 | | 2017 | | 2016 |
Cancellation Rates (1) | | | | | | |
Total | | 15.7 | % | | 13.4 | % | | 13.1 | % |
West Region | | | | | | |
Arizona | | 13.8 | % | | 13.6 | % | | 12.7 | % |
California | | 19.8 | % | | 14.6 | % | | 12.9 | % |
Colorado | | 16.2 | % | | 9.5 | % | | 10.6 | % |
West Region Totals | | 15.8 | % | | 13.3 | % | | 12.3 | % |
Central Region - Texas | | | | | | |
Central Region Totals | | 16.5 | % | | 15.0 | % | | 15.3 | % |
East Region | | | | | | |
Florida | | 13.4 | % | | 11.4 | % | | 12.3 | % |
Georgia | | 22.3 | % | | 15.3 | % | | 19.2 | % |
North Carolina | | 14.2 | % | | 10.3 | % | | 9.7 | % |
South Carolina | | 10.7 | % | | 10.5 | % | | 9.4 | % |
Tennessee | | 11.2 | % | | 13.1 | % | | 9.4 | % |
East Region Totals | | 14.8 | % | | 11.8 | % | | 12.0 | % |
| |
(1) | Cancellation rates are computed as the number of canceled units for the period divided by the gross sales units for the same period. |
|
| | | | | | | | | | | | | | | |
| | At December 31, | | Year Over Year |
| | 2018 | | 2017 | | Chg $ | | Chg % |
Order Backlog (1) | | | | | | | | |
Total | | | | | | | | |
Dollars | | $ | 1,015,918 |
| | $ | 1,245,771 |
| | $ | (229,853 | ) | | (18.5 | )% |
Homes in backlog | | 2,433 |
| | 2,875 |
| | (442 | ) | | (15.4 | )% |
Average sales price | | $ | 417.6 |
| | $ | 433.3 |
| | $ | (15.8 | ) | | (3.6 | )% |
West Region | | | | | | | | |
Arizona | | | | | | | | |
Dollars | | $ | 133,567 |
| | $ | 119,535 |
| | $ | 14,032 |
| | 11.7 | % |
Homes in backlog | | 343 |
| | 326 |
| | 17 |
| | 5.2 | % |
Average sales price | | $ | 389.4 |
| | $ | 366.7 |
| | $ | 22.7 |
| | 6.2 | % |
California | | | | | | | | |
Dollars | | $ | 66,391 |
| | $ | 222,909 |
| | $ | (156,518 | ) | | (70.2 | )% |
Homes in backlog | | 91 |
| | 318 |
| | (227 | ) | | (71.4 | )% |
Average sales price | | $ | 729.6 |
| | $ | 701.0 |
| | $ | 28.6 |
| | 4.1 | % |
Colorado | | | | | | | | |
Dollars | | $ | 103,470 |
| | $ | 114,848 |
| | $ | (11,378 | ) | | (9.9 | )% |
Homes in backlog | | 185 |
| | 199 |
| | (14 | ) | | (7.0 | )% |
Average sales price | | $ | 559.3 |
| | $ | 577.1 |
| | $ | (17.8 | ) | | (3.1 | )% |
West Region Totals | | | | | | | | |
Dollars | | $ | 303,428 |
| | $ | 457,292 |
| | $ | (153,864 | ) | | (33.6 | )% |
Homes in backlog | | 619 |
| | 843 |
| | (224 | ) | | (26.6 | )% |
Average sales price | | $ | 490.2 |
| | $ | 542.5 |
| | $ | (52.3 | ) | | (9.6 | )% |
Central Region - Texas | | | | | | | | |
Central Region Totals | | | | | | | | |
Dollars | | $ | 372,826 |
| | $ | 381,517 |
| | $ | (8,691 | ) | | (2.3 | )% |
Homes in backlog | | 981 |
| | 1,020 |
| | (39 | ) | | (3.8 | )% |
Average sales price | | $ | 380.0 |
| | $ | 374.0 |
| | $ | 6.0 |
| | 1.6 | % |
East Region | | | | | | | | |
Florida | | | | | | | | |
Dollars | | $ | 164,728 |
| | $ | 196,265 |
| | $ | (31,537 | ) | | (16.1 | )% |
Homes in backlog | | 372 |
| | 446 |
| | (74 | ) | | (16.6 | )% |
Average sales price | | $ | 442.8 |
| | $ | 440.1 |
| | $ | 2.8 |
| | 0.6 | % |
Georgia | | | | | | | | |
Dollars | | $ | 46,344 |
| | $ | 50,386 |
| | $ | (4,042 | ) | | (8.0 | )% |
Homes in backlog | | 123 |
| | 151 |
| | (28 | ) | | (18.5 | )% |
Average sales price | | $ | 376.8 |
| | $ | 333.7 |
| | $ | 43.1 |
| | 12.9 | % |
North Carolina | | | | | | | | |
Dollars | | $ | 67,316 |
| | $ | 96,579 |
| | $ | (29,263 | ) | | (30.3 | )% |
Homes in backlog | | 177 |
| | 243 |
| | (66 | ) | | (27.2 | )% |
Average sales price | | $ | 380.3 |
| | $ | 397.4 |
| | $ | (17.1 | ) | | (4.3 | )% |
South Carolina | | | | | | | | |
Dollars | | $ | 32,333 |
| | $ | 35,432 |
| | $ | (3,099 | ) | | (8.7 | )% |
Homes in backlog | | 89 |
| | 99 |
| | (10 | ) | | (10.1 | )% |
Average sales price | | $ | 363.3 |
| | $ | 357.9 |
| | $ | 5.4 |
| | 1.5 | % |
Tennessee | | | | | | | | |
Dollars | | $ | 28,943 |
| | $ | 28,300 |
| | $ | 643 |
| | 2.3 | % |
Homes in backlog | | 72 |
| | 73 |
| | (1 | ) | | (1.4 | )% |
Average sales price | | $ | 402.0 |
| | $ | 387.7 |
| | $ | 14.3 |
| | 3.7 | % |
East Region Totals | | | | | | | | |
Dollars | | $ | 339,664 |
| | $ | 406,962 |
| | $ | (67,298 | ) | | (16.5 | )% |
Homes in backlog | | 833 |
| | 1,012 |
| | (179 | ) | | (17.7 | )% |
Average sales price | | $ | 407.8 |
| | $ | 402.1 |
| | $ | 5.6 |
| | 1.4 | % |
| |
(1) | Our backlog represents net sales that have not closed. |
|
| | | | | | | | | | | | | | | |
| | At December 31, | | Year Over Year |
| | 2017 | | 2016 | | Chg $ | | Chg % |
Order Backlog (1) | | | | | | | | |
Total | | | | | | | | |
Dollars | | $ | 1,245,771 |
| | $ | 1,135,758 |
| | $ | 110,013 |
| | 9.7 | % |
Homes in backlog | | 2,875 |
| | 2,627 |
| | 248 |
| | 9.4 | % |
Average sales price | | $ | 433.3 |
| | $ | 432.3 |
| | $ | 1.0 |
| | 0.2 | % |
West Region | | | | | | | | |
Arizona | | | | | | | | |
Dollars | | $ | 119,535 |
| | $ | 161,343 |
| | $ | (41,808 | ) | | (25.9 | )% |
Homes in backlog | | 326 |
| | 444 |
| | (118 | ) | | (26.6 | )% |
Average sales price | | $ | 366.7 |
| | $ | 363.4 |
| | $ | 3.3 |
| | 0.9 | % |
California | | | | | | | | |
Dollars | | $ | 222,909 |
| | $ | 153,638 |
| | $ | 69,271 |
| | 45.1 | % |
Homes in backlog | | 318 |
| | 231 |
| | 87 |
| | 37.7 | % |
Average sales price | | $ | 701.0 |
| | $ | 665.1 |
| | $ | 35.9 |
| | 5.4 | % |
Colorado | | | | | | | | |
Dollars | | $ | 114,848 |
| | $ | 154,084 |
| | $ | (39,236 | ) | | (25.5 | )% |
Homes in backlog | | 199 |
| | 273 |
| | (74 | ) | | (27.1 | )% |
Average sales price | | $ | 577.1 |
| | $ | 564.4 |
| | $ | 12.7 |
| | 2.3 | % |
West Region Totals | | | | | | | | |
Dollars | | $ | 457,292 |
| | $ | 469,065 |
| | $ | (11,773 | ) | | (2.5 | )% |
Homes in backlog | | 843 |
| | 948 |
| | (105 | ) | | (11.1 | )% |
Average sales price | | $ | 542.5 |
| | $ | 494.8 |
| | $ | 47.7 |
| | 9.6 | % |
Central Region - Texas | | | | | | | | |
Central Region Totals | | | | | | | | |
Dollars | | $ | 381,517 |
| | $ | 354,734 |
| | $ | 26,783 |
| | 7.6 | % |
Homes in backlog | | 1,020 |
| | 931 |
| | 89 |
| | 9.6 | % |
Average sales price | | $ | 374.0 |
| | $ | 381.0 |
| | $ | (7.0 | ) | | (1.8 | )% |
East Region | | | | | | | | |
Florida | | | | | | | | |
Dollars | | $ | 196,265 |
| | $ | 116,454 |
| | $ | 79,811 |
| | 68.5 | % |
Homes in backlog | | 446 |
| | 253 |
| | 193 |
| | 76.3 | % |
Average sales price | | $ | 440.1 |
| | $ | 460.3 |
| | $ | (20.2 | ) | | (4.4 | )% |
Georgia | | | | | | | | |
Dollars | | $ | 50,386 |
| | $ | 33,363 |
| | $ | 17,023 |
| | 51.0 | % |
Homes in backlog | | 151 |
| | 91 |
| | 60 |
| | 65.9 | % |
Average sales price | | $ | 333.7 |
| | $ | 366.6 |
| | $ | (32.9 | ) | | (9.0 | )% |
North Carolina | | | | | | | | |
Dollars | | $ | 96,579 |
| | $ | 87,252 |
| | $ | 9,327 |
| | 10.7 | % |
Homes in backlog | | 243 |
| | 193 |
| | 50 |
| | 25.9 | % |
Average sales price | | $ | 397.4 |
| | $ | 452.1 |
| | $ | (54.6 | ) | | (12.1 | )% |
South Carolina | | | | | | | | |
Dollars | | $ | 35,432 |
| | $ | 40,636 |
| | $ | (5,204 | ) | | (12.8 | )% |
Homes in backlog | | 99 |
| | 116 |
| | (17 | ) | | (14.7 | )% |
Average sales price | | $ | 357.9 |
| | $ | 350.3 |
| | $ | 7.6 |
| | 2.2 | % |
Tennessee | | | | | | | | |
Dollars | | $ | 28,300 |
| | $ | 34,254 |
| | $ | (5,954 | ) | | (17.4 | )% |
Homes in backlog | | 73 |
| | 95 |
| | (22 | ) | | (23.2 | )% |
Average sales price | | $ | 387.7 |
| | $ | 360.6 |
| | $ | 27.1 |
| | 7.5 | % |
East Region Totals | | | | | | | | |
Dollars | | $ | 406,962 |
| | $ | 311,959 |
| | $ | 95,003 |
| | 30.5 | % |
Homes in backlog | | 1,012 |
| | 748 |
| | 264 |
| | 35.3 | % |
Average sales price | | $ | 402.1 |
| | $ | 417.1 |
| | $ | (14.9 | ) | | (3.6 | )% |
| |
(1) | Our backlog represents net sales that have not closed. |
Fiscal 2018 Compared to Fiscal 2017
Companywide. Home closing revenue for the year ended December 31, 2018 increased 9.0% to $3.5 billion when compared to $3.2 billion in 2017 due entirely to 822 additional units closed as average sales prices decreased compared to the prior year. Despite challenges encountered from a pause in home buying activity during the latter half of the year, we ended 2018 on a positive comparison year-over-year in home orders with $3.2 billion in order value on 8,089 units in 2018 as compared to $3.3 billion on 7,957 units in 2017. A modest decrease in average sales price for both closings and orders was reflective of our shift to a higher percentage of mix coming from entry-level homes. At December 31, 2018 we had 272 actively selling communities, an 11.5% increase from prior year, although with a 4.0% decline in orders pace to 31.4 in 2018 compared to 32.7 in 2017. We ended the year with 2,433 homes in backlog valued at $1.0 billion, reflecting 15.4% and 18.5% decreases in backlog units and value, respectively, compared to 2017. The decrease in backlog units is primarily driven by the order volume waning and increased cancellations in the latter part of the year. Average sales prices of homes in backlog declined by 3.6% to $417,600 from $433,300 in 2017 primarily a result of our shift to entry-level, as noted above.
West. Our West region led the company in home closing revenue and units in 2018 generating $1.4 billion in revenue, consistent with the prior year. In 2018, the West region closed 2,982 homes, a 2.8% decrease from the 3,069 homes closed in 2017 with a $12,900 increase in average sales price. Despite our strong shift to first-time buyers in the Region, the higher average sales price in 2018 is the result of several high-priced communities in California contributing meaningfully to the closing mix in 2018. The reduction in closing volume was primarily related to California which had 22.9% fewer communities open on average during 2018 compared to 2017. The decline in California community count was driven by strong demand that resulted in many communities selling out faster than anticipated in the first half of the year coupled with postponed community openings due primarily to a combination of municipal and weather-related delays resulting in a gap in replacement communities. The West region ended 2018 with $1.3 billion in order value on 2,758 units compared to $1.4 billion on 2,964 units in 2017, decreases of 10.3% and 7.0%, respectively, over prior year. Arizona and Colorado ended the year with an improvement in orders year-over-year that were offset by a decline in California. The reduction in order volume in California is a result of the lower community count previously mentioned in addition to increased cancellations and a notably slower orders pace in the second half of 2018 as consumer reaction to increased sales prices and interest rates seemed to be most acute in this market. Overall, average community count and orders pace in the Region declined by 2.0% and 5.0%, respectively, in 2018 compared to prior year. These results led to ending backlog in the Region of $303.4 million on 619 units versus $457.3 million on 843 units in 2017, 33.6% and 26.6% decreases over the prior year, respectively, resulting from the decline in orders and increased cancellations coupled with strong closings in the fourth quarter. We opened six communities throughout the Region in the fourth quarter of 2018 and we anticipate opening over twenty new West Region communities in the first half of 2019, all of which are targeted toward the first-time and first move-up homebuyer.
Central. The Central Region, made up of our Texas markets, closed 2,840 units totaling $1.0 billion in home closing revenue for the year ended December 31, 2018. The 13.9% improvement in closing units, offset partially by a 2.3% decline in average sales prices, resulted in $101.9 million higher home closing revenue than in 2017. The Region reported the largest improvement in the Company in orders year-over-year with 8.5% and 6.9% increases in orders and order value, respectively. The improvement in orders was the result of an 8.7% increase in average active communities combined with a consistent orders pace year-over-year. The Region ended the year with 2,801 orders valued at $995.5 million in 2018 compared to 2,582 orders at $931.1 million in the prior year. The Region ended 2018 with backlog of 981 units valued at $372.8 million compared to 1,020 units valued at $381.5 million at December 31, 2017 due to a year-over-year increase in fourth quarter closings.
East. The East Region generated 26.2% and 21.8% increases in closing volume and revenue year-over-year delivering 2,709 closings and $1.1 billion of home closing revenue in 2018 compared to 2,147 closings and $862.7 million of revenue in 2017. The increase in closing volume was partially offset by a 3.5% decrease in average sales price resulting from our transition to offering more entry-level product. Simplifying our business and improving our buyers' experiences through a strategic shift to product and communities that appeal to the first-time buyer has been a key strategic focus for us and we believe our results are reflective of that. Orders and order value in the East region improved by 4.9% and 2.5%, respectively, in 2018 with 2,530 units valued at $981.7 million compared to 2,411 units valued at $957.7 million in the prior year. The improvement in orders is primarily due to a 10.2% increase in average active communities offset partially by a 4.5% decrease in orders pace. The latter half of the year was challenging in the East Region as orders were negatively impacted in the third quarter of 2018 by weather followed by the overall slowdown in the market during the fourth quarter. The high volume of closings coupled with the slow down in orders in the latter part of the year led a decline in backlog in the Region to end 2018 with 833 units in backlog valued at $339.7 million, 17.7% and 16.5% decreases, respectively, compared to the prior year. We are confident in our product offering and community locations throughout the Region and plan to open several new communities throughout the Region in the first half of 2019, the majority of which will be targeted to the first-time and first move-up buyer.
Land Closing Revenue and Gross Profit
From time to time, we may sell certain land parcels to other homebuilders, developers or investors if we feel the sale will provide a greater economic benefit to us than continuing home construction or where we are looking to diversify our land positions in the specific geography. As a result of such sales, we recognized land closing revenue of $38.7 million and $40.0 million for the years ending December 31, 2018 and 2017, respectively. We recognized a loss of $2.8 million in 2018 compared to a profit of $4.4 million in 2017.
Fiscal 2017 Compared to Fiscal 2016
Companywide. Home closing revenue for the year ended December 31, 2017 increased 6.1% to $3.2 billion when compared to 2016 primarily due to 354 additional units closed in 2017. Average sales prices increased slightly compared to 2016, as price increases in some markets were nearly offset by a higher percentage of entry-level homes in our closing mix. Home order value improved 9.8% to $3.3 billion on 7,957 units in 2017 as compared to $3.0 billion on 7,290 units in 2016, assisted by a nominal increase in average sales price also indicative of the shift to a higher percentage of entry-level homes. We ended 2017 with 244 actively selling communities, flat from 2016, although with an improved orders pace of 11.6% to 32.7 in 2017 compared to 29.3 in 2016. We ended 2017 with 2,875 homes in backlog, reflecting a 9.4% increase from 2016 driven almost entirely by volume as average sales prices were beginning to decline primarily a result of the shift to entry-level, as noted.
West. In 2017, our West region led the company in home closing revenue and units, generating $1.4 billion in revenue from 3,069 closings for 2017 compared to $1.3 billion from 2,776 closings in 2016, increases of 10.5% and 10.6%, respectively. Average community count in the Region was down 7.5% in 2017 compared to 2016, although orders pace improved by 15.0%, resulting in 6.4% and 9.1% increases in orders and order value, respectively, over 2016. The West region ended 2017 with $1.4 billion in order value on 2,964 units compared to $1.3 billion on 2,786 units in 2016. These results led to ending backlog in the Region of $457.3 million on 843 units in 2017 versus $469.1 million on 948 units in 2016, 2.5% and 11.1% decreases over 2016, respectively.
Central. The Central Region, made up of our Texas markets, closed 2,493 units totaling $904.3 million in home closing revenue for the year ended December 31, 2017. The 17.0% improvement in closing units, offset by a slight decline in average sales prices, resulted in $125.3 million higher home closing revenue than in 2016. The Region reported the largest improvement in the Company in orders year-over-year for 2017 with 21.8% and 18.8% increases in orders and order value, respectively. The Region ended 2017 with 2,582 orders valued at $931.1 million compared to 2,119 orders at $783.5 million in 2016. The Region ended 2017 with a 9.6% increase in backlog of 1,020 units valued at $381.5 million compared to 931 units valued at $354.7 million at December 31, 2016.
East. Our East Region generated 2,147 closings with $862.7 million of home closing revenue in 2017, 12.3% and 8.1% decreases, respectively, compared to 2016. The Region reported a slight increase in orders year over year, providing $29.9 million of additional order dollars, due to 26 additional units, aided by a $8,200 increase in average sales price compared to 2016. The Region ended 2017 with 1,012 units in backlog valued at $407.0 million, 264-unit and $95.0 million increases in ending backlog and backlog value, respectively, compared to 2016.
Land Closing Revenue and Gross Profit
We recognized land closing revenue of $40.0 million and $25.8 million for the years ending December 31, 2017 and 2016, respectively. For both years, modest profits were achieved on these land sales, $4.4 million in 2017 and $2.4 million in 2016.
Other Operating Information (dollars in thousands)
|
| | | | | | | | | | | | | | | | | | | | | |
| | Years ended December 31, |
| | 2018 | | 2017 | | 2016 |
| | Dollars | | Percent of Home Closing Revenue | | Dollars | | Percent of Home Closing Revenue | | Dollars | | Percent of Home Closing Revenue |
Home Closing Gross Profit (1) | | | | | | | | | | | | |
Total | | $ | 631,950 |
| | 18.2 | % | | $ | 562,139 |
| | 17.6 | % | | $ | 528,842 |
| | 17.6 | % |
| | | | | | | | | | | | |
West | | $ | 258,724 |
| | 18.2 | % | | $ | 250,025 |
| | 17.6 | % | | $ | 222,428 |
| | 17.3 | % |
| | | | | | | | | | | | |
Central | | $ | 198,661 |
| | 19.7 | % | | $ | 184,302 |
| | 20.4 | % | | $ | 156,412 |
| | 20.1 | % |
| | | | | | | | | | | | |
East | | $ | 174,565 |
| | 16.6 | % | | $ | 127,812 |
| | 14.8 | % | | $ | 150,200 |
| | 16.0 | % |
| |
(1) | Home closing gross profit represents home closing revenue less cost of home closings, including impairments. Cost of home closings includes land and lot development costs, direct home construction costs, an allocation of common community costs (such as architectural, legal and zoning costs), interest, sales tax, impact fees, warranty, construction overhead and closing costs. |
Fiscal 2018 Compared to Fiscal 2017
Companywide. Home closing gross margin improved to 18.2% for the year ended December 31, 2018 compared to 17.6% in the prior year. Home closing gross profit increased by $69.8 million to $632.0 million in 2018 versus $562.1 million in 2017, driven by higher home closing revenue and the 60 basis point increase in home closing gross margin. With gains in pricing power and the introduction of new, efficient product in the East region, we have been successful in mitigating the impact of rising labor and commodity costs, particularly lumber.
West. Our West Region reported a 60 basis point improvement in year-over-year home closing gross margin of 18.2% in 2018 versus 17.6% in 2017. We are making concerted efforts to maximize margins in the Region and have been successful with raising average sales prices in certain markets and achieving construction efficiencies to offset the impact of rising costs. The West Region was the first to benefit from our pivot to offer more entry-level homes which simplifies our product, generating construction and cost efficiencies. Home closing gross margin for 2018 would have increased by an additional 20 basis points to 18.4% after adjusting for the impact of a $2.6 million charge incurred to terminate a purchase agreement for land put under contract several years ago in California that is no longer consistent with our strategy. There were no comparable charges in the prior year in the Region.
Central. The Central Region produced the highest home closing gross margin in the company during 2018 at 19.7%, although down slightly from 20.4% in the prior year. We were largely successful in maintaining pricing in alignment with labor, construction and land cost increases. The 70 basis point decline in margins year-over-year was due to the close out of a handful of communities with above-average margins that provided a higher volume of closings in 2017.
East. The East Region experienced a 180 basis point improvement in year-over-year home closing gross margin in 2018 of 16.6% versus 14.8% for 2017. Home closing gross margin in 2018 was negatively impacted by $1.0 million of charges related to the termination of land purchase contracts which impacted home closing gross margin by approximately 10 basis points. Home closing gross margin in 2017 was impacted by 40 basis points due to similar termination costs and costs related to the hurricane in Florida. We attribute the margin improvement to our strategic initiatives to improve profitability as communities with our new product offerings begin to contribute more materially to the closing mix in the Region. The higher volume of closings and associated revenue in the Region also helped leverage construction overhead costs which further improved margins.
Fiscal 2017 Compared to Fiscal 2016
Companywide. Home closing gross margin remained flat at 17.6% for the year ended December 31, 2017 as compared to 2016. While home closing gross profit increased by $33.3 million in 2017 versus 2016, driven by higher home closing revenue, the flat year-over-year home closing gross margin is largely reflective of construction and land cost increases, including those attributed to weather events, offsetting the appreciation in the average sales prices of homes closed during 2017.
West. Our West Region reported a 30 basis point improvement in year-over-year home closing gross margin of 17.6% in 2017 versus 17.3% in 2016. In 2017, we were successful with raising average sales prices in certain markets to offset land and labor cost increases. Higher closing volume and simplified product, particularly in markets with a fast paced, entry-level focus, helped us gain cost efficiencies and leverage construction overhead costs, improving home closing gross margin.
Central. The Central Region produced the highest home closing gross margin in the company in 2017 and improved 30 basis points year over year, with 20.4% in 2017 versus 20.1% in 2016. In 2017, we were successful in maintaining pricing in alignment with labor, construction and land cost increases. The increased volume of closings and higher revenue in the Central Region helped leverage construction overhead costs, resulting in an improved home closing gross margin year-over-year.
East. The East Region home closing gross margin decreased to 14.8% in 2017, compared to 16.0% in 2016. A primary contributor to the decline was reduced leverage of construction overhead costs due to the lower closing volume compared to 2016. The lower gross margin was also partially driven by increased land and labor costs in several markets which we were unable to offset entirely through price increases. Home closing gross margins in the East Region in 2017 were reduced by costs related to the hurricane in Florida as well as other impairment charges including the write off capitalized costs from terminated land purchase contracts. The impact of these charges was 40 basis points in 2017, whereas similar charges in 2016 results had a 30 basis point impact on home closing gross margin.
|
| | | | | | | | | | | |
| Years Ended December 31, |
| ($ in thousands) |
| 2018 | | 2017 | | 2016 |
Financial services profit | $ | 24,044 |
| | $ | 22,055 |
| | $ | 21,902 |
|
Financial services profit. Financial services profit represents the net profit of our financial services operations, including the operating profit generated by our wholly-owned title company, Carefree Title, as well as our portion of earnings from a mortgage joint venture. The increase in financial services profit year-over-year is primarily the result of the increase in home closings and revenue.
|
| | | | | | | | | | | | |
| | | | | | |
| | Years Ended December 31, |
| | ($ in thousands) |
| | 2018 | | 2017 | | 2016 |
Commissions and Other Sales Costs | | | | | | |
Dollars | | $ | (241,897 | ) | | $ | (221,647 | ) | | $ | (215,092 | ) |
Percent of home closing revenue | | 7.0 | % | | 7.0 | % | | 7.2 | % |
General and Administrative Expenses | | | | | | |
Dollars | | $ | (138,478 | ) | | $ | (124,041 | ) | | $ | (123,803 | ) |
Percent of home closing revenue | | 4.0 | % | | 3.9 | % | | 4.1 | % |
Earnings from Other Unconsolidated Entities, Net | | | | | | |
Dollars | | $ | 601 |
| | $ | 2,101 |
| | $ | 4,060 |
|
Interest Expense | | | | | | |
Dollars | | $ | (785 | ) | | $ | (3,853 | ) | | $ | (5,172 | ) |
Other Income, Net | | | | | | |
Dollars | | $ | 10,616 |
| | $ | 6,405 |
| | $ | 4,953 |
|
Provision for Income Taxes | | | | | | |
Dollars | | $ | (55,922 | ) | | $ | (104,264 | ) | | $ | (68,519 | ) |
Fiscal 2018 Compared to Fiscal 2017
Commissions and Other Sales Costs. Commissions and other sales costs are comprised of internal and external commissions and related sales and marketing expenses such as advertising and sales office costs. These costs increased by $20.3 million in 2018 over 2017 as a result of increased closing volume, but remained flat as a percentage of home closing revenue 7.0% in both years.
General and Administrative Expenses. General and administrative expenses represent corporate and divisional overhead expenses such as salaries and bonuses, occupancy, insurance and travel expenses. For the twelve months ended December 31, 2018, general and administrative expenses were $138.5 million or 4.0% of home closing revenue as compared to $124.0 million or 3.9% of home closing revenue for the 2017 period. The dollar increase year over year is largely the result of
increased performance-based compensation resulting from higher closing volume and improved profitability. We continually strive to optimize overhead leverage through cost control efforts at both corporate and divisional levels.
Earnings from Other Unconsolidated Entities, Net. Earnings from other unconsolidated entities, net represents our portion of pre-tax earnings/(losses) from non-financial services joint ventures. Included in this amount is both the pass through of earnings/(losses) from the joint venture's most recently available financial statements as well as any accrued expected earnings/(losses) for the periods presented that might not have been reflected in the joint venture's financial statements provided to us. For the twelve months ended December 31, 2018 we recognized earnings of $0.6 million compared to $2.1 million for the 2017 period. The higher 2017 earnings are related to development reimbursements from municipalities and land sales recorded in our land joint ventures.
Interest Expense. Interest expense is comprised of interest incurred, but not capitalized, on our senior notes and our Credit Facility and in 2017 also our convertible senior notes. Our non-capitalizable interest expense declined to $0.8 million for the twelve months ended December 31, 2018 compared to $3.9 million for the 2017 period due to a higher balance of inventory under development that qualifies for interest capitalization.
Other Income, Net. Other income, net primarily consists of (i) payments and awards related to legal settlements, (ii) sub lease income, (iii) interest earned on our cash and cash equivalents. Beginning in 2018, forfeited deposits are reflected in Home closing revenue resulting from the adoption of ASU 2014-09. Forfeited deposits represented $2.5 million of Other income, net in 2017 results. The remaining difference from 2018 to 2017 results in Other income, net is primarily the result of legal settlements received in 2018, including a $4.8 million settlement from long-standing litigation related to a previous joint venture in Nevada.
Income Taxes. The effective tax rate was 19.7% and 42.1% for 2018 and 2017, respectively. The reduced rate in 2018 is due to lower corporate tax resulting from the Tax Act, extension of the Internal Revenue Code §45L new energy efficient homes credit in early 2018 for homes closed in 2017, additional energy tax credits obtained by qualifying more homes in open prior tax years, and a revaluation adjustment to our deferred tax assets in accordance with the SEC Staff Accounting Bulletin No. 118. The 2017 effective tax rate does not include the benefit of 2017 energy tax credits due to the legislation being passed in 2018, but was favorably impacted by the homebuilder manufacturing deduction which was eliminated in the Tax Act. The higher 2017 effective tax rate also reflects a $19.7 million revaluation adjustment to our deferred tax assets as a result of the Tax Act which was estimated in 2017 and revised in 2018 when our accounting for the income tax effects of the Tax Act was completed.
Fiscal 2017 Compared to Fiscal 2016
Commissions and Other Sales Costs. These costs increased by $6.6 million in 2017 over 2016 as a result of increased closing volume, but decreased as a percentage of home closing revenue to 7.0% in 2017 compared to 7.2% in 2016. This is the result of improved overhead leverage on higher revenues in 2017, targeted initiatives to decrease marketing and selling costs, combined with a revised commission structure in effect for the full year of 2017 as compared to only a partial year impact in 2016.
General and Administrative Expenses. For the twelve months ended December 31, 2017, general and administrative expenses were $124.0 million as compared to $123.8 million for the 2016 period. As a percentage of home closing revenue, general and administrative expenses decreased by 20 basis points for the year ended December 31, 2017 compared to 2016. The improved leverage year-over-year is mainly attributable to the additional closing revenue in 2017 over 2016.
Earnings from Other Unconsolidated Entities, Net. The 2017 earnings of $2.1 million are related to development reimbursements from municipalities and land sales recorded in our land joint ventures and 2016 earnings of $4.1 million are primarily the result of land sales recorded in our land joint ventures.
Interest Expense. Despite a higher amount of interest dollars incurred in 2017, our non-capitalizable interest expense declined to $3.9 million for the twelve months ended December 31, 2017 compared to $5.2 million for the 2016 period due to a higher balance of inventory under development that qualifies for interest capitalization.
Other Income, Net. Other income, net was favorably impacted in 2017 and 2016 primarily by additional interest income from municipalities related to reimbursable land development costs and forfeited buyer deposits.
Income Taxes. The effective tax rate was 42.1% and 31.4% for 2017 and 2016, respectively. Our 2016 tax rate was favorably impacted by both the homebuilder manufacturing deduction and energy tax credits. The effective tax rate for 2017 was favorably impacted by the homebuilder manufacturing deduction and to a lesser extent additional energy tax credits obtained by qualifying more homes from open prior tax years. These were offset by an unfavorable impact to the 2017
effective tax rate from the Tax Act non-cash estimated revaluation of deferred tax balances of $19.7 million and due to the absence of the energy tax credits for homes closed in 2017.
Liquidity and Capital Resources
Overview of Cash Management
Our principal uses of capital for 2018 were acquisition and development of new and strategic lot positions, operating expenses, home construction, repurchasing our common stock and the payment of routine liabilities. In addition, in 2018 we used the net proceeds of our new senior notes to pay off our maturing senior notes. We remain focused on acquiring desirable land positions, generating increasing margins in our homebuilding operations and maintaining a strong balance sheet to support future needs and growth, while leveraging land options where possible.
Operating Cash Flow Activities
During the year ended December 31, 2018, net cash provided by operations totaled $262.2 million. During the years ended December 31, 2017 and December 31, 2016 net cash used in operations totaled $87.1 million and $103.4 million, respectively. Operating cash flow results in 2018 benefited from the $227.3 million in net earnings partially offset by a modest $19.4 million increase in real estate, and a $12.8 million decrease in accounts payable and accrued liabilities. Operating cash flow results in 2017 and 2016 benefited from the $143.3 million and $149.5 million in net earnings, respectively, offset mainly by the $301.5 million and $311.4 million increase in real estate, respectively. Operating cash flow in 2017 also includes a $19.7 million add-back related to a non-cash deferred tax asset revaluation to reflect the impact of new corporate tax rates enacted in 2017 which became effective in 2018.
Investing Cash Flow Activities
During the year ended December 31, 2018, net cash used in investing activities totaled $33.5 million as compared to $17.1 million and $20.1 million for the same period in 2017 and 2016, respectively. Cash used in investing activities in 2018, 2017 and 2016 is mainly attributable to the purchases of property, plant and equipment of $33.4 million, $18.1 million, and $16.7 million, respectively.
Financing Cash Flow Activities
During the year ended December 31, 2018, net cash used in financing activities totaled $88.0 million as compared to net cash provided by financing activities of $143.2 million for the same period in 2017. During the year ended December 31, 2016, net cash used in financing activities totaled $7.0 million. The net cash used in financing activities in 2018 reflects the $175.0 million repayment of our 4.50% senior notes along with the repurchase of $100.0 million of our common stock partially offset by $202.8 million in net proceeds received from our 6.00% bond issuance. The net cash provided by financing activities in 2017 is primarily the result of the $295.9 million in net proceeds from our 5.125% bond issuance, partially offset by the $126.7 million redemption of our Convertible Notes. The use of cash in 2016 primarily reflects $15.0 million in proceeds from the Credit Facility, offset by $21.3 million in repayments of loans payable and other borrowings.
Cash flows for each of our communities depend on their stage of the development cycle, and can differ substantially from reported earnings. Early stages of development or expansion require significant cash outlays for land acquisitions, zoning plat and other approvals, community and lot development, and construction of model homes, roads, utilities, landscape and other amenities. Because these costs are a component of our inventory and are not recognized in our income statement until a home closes, we incur significant cash outlays prior to recognition of earnings. In the later stages of a community, cash inflows may significantly exceed earnings reported for financial statement purposes, as the cash outflow associated with home and land construction was previously incurred. From a liquidity standpoint, we are currently acquiring and developing lots in our markets to maintain and grow our lot supply and active community count. We are also using our cash on hand and draws under our Credit Facility, as needed, to fund operations in newer markets. As we have spent the last several years building a pipeline of desirable land positions to position us for growth in an improving homebuilding environment and to replenish a depleted supply of lots, our cash outlays have exceeded our cash generated from operations. We expect future cash needs to begin to moderate and for cash generated from ongoing operations to support our expected growth.
During 2018, we closed 8,531 homes, purchased approximately 9,400 lots for $380.2 million, spent $400.6 million on land development, and started 8,743 homes. We currently primarily purchase undeveloped land or partially-finished requiring development dollars in order to bring them to a finished status ready for home construction. We exercise strict controls and believe we have a prudent strategy for Company-wide cash management, including those related to cash outlays for land and inventory acquisition and development. We ended 2018 with $311.5 million of cash and cash equivalents, a $140.7 million increase from December 31, 2017 with no outstanding borrowings on our Credit Facility. The increase in cash year over year is primarily due to a $209.2 million reduction in land and development spending in 2018 due to less expensive lots to supply our
entry-level business partially offset by $100.0 million in share repurchases, as discussed below. We expect to generate cash from the sale of our inventory, but we intend to redeploy the majority of that cash to acquire and develop strategic and well-positioned lots to grow our business, while maintaining sufficient cash balances to pay the majority, if not all, of our upcoming 7.15% senior notes due in 2020.
On July 25, 2018, the Board of Directors approved a new stock repurchase program, authorizing the expenditure of up to $100.0 million to repurchase shares of our common stock, subject to certain price parameters. This program replaced the previously authorized program that was in place and there was no stated expiration for this program. Prior to December 31, 2018, we repurchased the entire $100.0 million allowed under the program at an average price of $38.71 per share, retiring 2.6 million shares of our common stock.
In June 2018, we entered into an amendment to our Credit Facility, which among other things, increased the total commitments available from $625.0 million to $780.0 million and extended the maturity date of the Credit Facility from July 2021 to July 2022. In addition, in March 2018, the Company completed an offering of $200.0 million aggregate principal amount of 6.00% Senior Notes due 2025 (the "Additional Notes"). The Additional Notes were issued as an add-on to the existing $200.0 million of 6.00% Senior Notes due 2025 that were issued in June 2015 which resulted in a combined $400.0 million aggregate principal amount of 6.00% Senior Notes due 2025 outstanding at December 31, 2018. The Additional Notes were issued at a premium of 103% of the principal amount and the net proceeds were used to repay outstanding borrowings under the Credit Facility, which included borrowings used for the redemption of the Company's 4.50% Senior Notes that were due to mature on March 1, 2018. Reference is made to Notes 5 and 6 in the accompanying consolidated financial statements.
We believe that we currently have strong liquidity. Nevertheless, we may seek additional capital to strengthen our liquidity position, enable us to opportunistically acquire additional land inventory in anticipation of improving market conditions, and/or strengthen our long-term capital structure. Such additional capital may be in the form of equity or debt financing and may be from a variety of sources. There can be no assurances that we would be able to obtain such additional capital on terms acceptable to us, if at all, and such additional equity or debt financing could dilute the interests of our existing stockholders or increase our interest costs. We may also, from time to time, opportunistically repurchase our senior notes and common stock. Reference is made to Notes 5 and 6 in the accompanying consolidated financial statements.
We believe that our leverage ratios provide useful information to the users of our financial statements regarding our financial position and cash and debt management. Debt-to-capital and net debt-to-capital are calculated as follows (dollars in thousands):
|
| | | | | | | | |
| | At December 31, 2018 | | At December 31, 2017 |
Notes payable and other borrowings | | $ | 1,310,057 |
| | $ | 1,283,804 |
|
Stockholders’ equity | | 1,720,755 |
| | 1,576,825 |
|
Total capital | | $ | 3,030,812 |
| | $ | 2,860,629 |
|
Debt-to-capital (1) | | 43.2 | % | | 44.9 | % |
Notes payable and other borrowings | | $ | 1,310,057 |
| | $ | 1,283,804 |
|
Less: cash and cash equivalents | | (311,466 | ) | | (170,746 | ) |
Net debt | | $ | 998,591 |
| | $ | 1,113,058 |
|
Stockholders’ equity | | 1,720,755 |
| | 1,576,825 |
|
Total net capital | | $ | 2,719,346 |
| | $ | 2,689,883 |
|
Net debt-to-capital (2) | | 36.7 | % | | 41.4 | % |
| |
(1) | Debt-to-capital is computed as senior notes, net and loans payable and other borrowings divided by the aggregate of total senior notes, net and loans payable and other borrowings and stockholders' equity. |
| |
(2) | Net debt-to-capital is computed as net debt divided by the aggregate of net debt and stockholders' equity. Net debt is total senior notes, net and loans payable and other borrowings, less cash and cash equivalents. The most directly comparable GAAP financial measure is the ratio of debt to total capital. We believe the ratio of net debt-to-capital is a relevant financial measure for investors to understand the leverage employed in our operations and as an indicator of our ability to obtain financing. |
Senior Notes
7.15% Senior Notes
During the second quarter of 2010, we completed an offering of $200.0 million aggregate principal amount of 7.15% senior notes due 2020 ("2020 Notes"). The 2020 Notes were issued at 97.567% of par value to yield 7.50%. In the fourth quarter of 2013, we completed a $100.0 million add-on offering to the 2020 Notes at 106.699% of par value to yield 5.875%.
7.00% Senior Notes
In April 2012, we completed an offering of $300.0 million aggregate principal amount of 7.00% Senior Notes due 2022 ("2022 Notes"). The 2022 Notes were issued at par and their associated proceeds were primarily used to pay down the remaining balance of our prior $285.0 million of 6.25% senior notes due 2015.
6.00% Senior Notes
In June 2015, we completed an offering of $200.0 million aggregate principal amount of 6.00% Senior Notes due 2025 ("2025 Notes"). The 2025 Notes were issued at par, and the proceeds were used for general corporate obligations and future land spend. In March 2018, the Company completed an offering of $200.0 million aggregate principal amount of additional 2025 Notes (the "Additional Notes"). The Additional Notes were issued as an add-on to the existing 2025 Notes that were issued in June 2015 which resulted in a combined $400.0 million aggregate principal amount of 6.00% Senior Notes due 2025 outstanding as of December 31, 2018. The Additional Notes were issued at a premium of 103% of the principal amount and the net proceeds were used to repay outstanding borrowings under the Credit Facility, which included borrowings used for the redemption of the Company's $175.0 million of 4.50% Senior Notes that were due to mature on March 1, 2018.
5.125% Senior Notes
In June 2017, we completed an offering of $300.0 million aggregate principal amount of 5.125% Senior Notes due 2027 ("2027 Notes"). The 2027 notes were issued at par. Using the proceeds from the 2027 Notes offering, we retired all $126.5 million of our convertible senior notes ("Convertible Notes") aggregate principal amount.
The indentures for all of our senior notes contain covenants including, among others, limitations on the amount of secured debt we may incur, and limitations on sale and leaseback transactions of non-model home assets and mergers. We believe we are in compliance with all such covenants as of December 31, 2018.
Loans Payable and Other Borrowings
The Company has a $780.0 million unsecured revolving credit facility ("Credit Facility") with an accordion feature that permits the size of the facility to increase to a maximum of $880.0 million, subject to certain conditions, including the availability of additional bank commitments. In June 2018, the maturity date of the credit facility was extended to July 2022. We had no outstanding borrowings under the Credit Facility as of December 31, 2018 or December 31, 2017. During the twelve months ended December 31, 2018 we had $285.0 million of gross borrowings and repayments. During the twelve months ended December 31, 2017 we had $415.0 million of gross borrowings and $430.0 million of repayments, respectively. Borrowings and repayments during the twelve months ended December 31, 2016 totaled $286.0 million and $271.0 million, respectively. As of December 31, 2018 we had outstanding letters of credit issued under the Credit Facility totaling $74.0 million, leaving $706.0 million available under the Credit Facility to be drawn.
Credit Facility Covenants
Borrowings under the Credit Facility are unsecured but availability is subject to, among other things, a borrowing base. The Credit Facility also contains certain financial covenants, including (a) a minimum tangible net worth requirement of $1.1 billion (which amount is subject to increase over time based on subsequent earnings and proceeds from equity offerings), and (b) a maximum leverage covenant that prohibits the leverage ratio (as defined therein) from exceeding 60%. In addition, we are required to maintain either (i) an interest coverage ratio (EBITDA to interest expense, as defined therein) of at least 1.50 to 1.00 or (ii) liquidity (as defined therein) of an amount not less than our consolidated interest incurred during the trailing 12 months. We were in compliance with all Credit Facility covenants as of December 31, 2018. Our actual financial covenant calculations as of December 31, 2018 are reflected in the table below.
|
| | | |
Financial Covenant (dollars in thousands): | Covenant Requirement | | Actual |
Minimum Tangible Net Worth | > $1,202,164 | | $1,680,978 |
Leverage Ratio | < 60% | | 34% |
Interest Coverage Ratio (1) | > 1.50 | | 4.80 |
Minimum Liquidity (1) | > $85,279 | | $1,017,429 |
Investments other than defined permitted investments | < $504,293 | | $17,480 |
| |
(1) | We are required to meet either the Interest Coverage Ratio or Minimum Liquidity, but not both. |
Land under Control
We enter into various purchase and option contracts for land in the normal course of business. Generally, our lot options remain effective so long as we purchase a pre-established minimum number of lots each month or quarter, as determined by the respective agreement. The pre-established number is typically structured to approximate our expected rate of home construction starts, although if demand slows, in some instances starts may fall below the pre-established minimum number of lot purchases and lots would accumulate on our balance sheet. Additional information regarding our purchase agreements and related deposits is presented in Note 3 in the accompanying consolidated financial statements in this Annual Report on Form 10-K.
The total number of lots under control at December 31, 2018 was 34,553 as compared to 34,319 at December 31, 2017. At December 31, 2018 and 2017, respectively, 69.5% and 68.1% of our controlled lots were owned. We secured approximately 10,300 lots with an aggregate purchase price of $370.2 million in 2018 as compared to approximately 13,300 lots with an aggregate purchase price of $557.7 million in 2017. At December 31, 2018, our total option and purchase contracts had aggregated purchase prices of approximately $910.9 million, on which we had made deposits of approximately $51.4 million in cash, of which approximately 91.5% is non-refundable.
Off-Balance Sheet Arrangements
Reference is made to Notes 1, 3, 4, and 15 in the accompanying Notes to the consolidated financial statements included in this Annual Report on Form 10-K and are incorporated by reference herein. These Notes discuss our off-balance sheet arrangements with respect to land acquisition contracts and option agreements, and land development joint ventures, including the nature and amounts of financial obligations relating to these items. In addition, these Notes discuss the nature and amounts of certain types of commitments that arise in connection with the ordinary course of our land development and homebuilding operations, including commitments of land development joint ventures for which we might be obligated.
Contractual Obligations
The following is a summary of our contractual obligations at December 31, 2018, and the effect such obligations are expected to have on our liquidity and cash flows in future periods (in thousands):
|
| | | | | | | | | | | | | | | | | | | | |
| | Payments Due by Period |
| | Total | | Less than 1 Year | | 1-3 Years | | 4-5 Years | | More Than 5 Years |
Principal, senior notes | | $ | 1,300,000 |
| | $ | — |
| | $ | 300,000 |
| | $ | 300,000 |
| | $ | 700,000 |
|
Interest, senior notes | | 379,569 |
| | 81,825 |
| | 127,008 |
| | 83,999 |
| | 86,737 |
|
Loans payable and other borrowings | | 14,773 |
| | 5,377 |
| | 9,360 |
| | 36 |
| | — |
|
Operating lease obligations | | 40,218 |
| | 8,168 |
| | 15,005 |
| | 11,627 |
| | 5,418 |
|
Other contractual obligations (1) | | 4,608 |
| | 2,741 |
| | 1,867 |
| | — |
| | — |
|
Total (2) | | $ | 1,739,168 |
| | $ | 98,111 |
| | $ | 453,240 |
| | $ | 395,662 |
| | $ | 792,155 |
|
| |
(1) | Represents other long-term obligations for items such as software and marketing licenses. |
| |
(2) | See Notes 5, 6 and 15 to our consolidated financial statements included in this report for additional information regarding our contractual obligations. |
We do not engage in commodity trading or other similar activities. We had no derivative financial instruments at December 31, 2018 or 2017.
Recent Accounting Standards
See Note 1 to our consolidated financial statements included in this report for discussion of recently-issued accounting standards.
Item 7A. Quantitative and Qualitative Disclosures About Market Risk
Our fixed rate debt is made up primarily of $1.3 billion of our senior notes. Except in limited circumstances, we do not have an obligation to prepay our fixed-rate debt prior to maturity and, as a result, interest rate risk and changes in fair value should not have a significant impact on our fixed rate borrowings until we would be required to repay such debt. Our Credit Facility is subject to interest rate changes. We had maximum intra-period borrowings under the Credit Facility of up to $250.0 million and $105.0 million for years ending December 31, 2018 and 2017, respectively, with none outstanding at either December 31, 2018 or December 31, 2017. Interest charges resulting from the intra-period borrowings totaled $0.3 million and $1.3 million for the years ended December 31, 2018 and 2017, respectively.
The following table presents our long-term debt obligations, principal cash flows by maturity, weighted average interest rates and estimated fair market value for the year ended December 31, 2018 (in thousands):
|
| | | | | | | | | | | | | | | | | | | | | | | | | | | | | | | | |
| | | Fair Value at December 31, |
| | 2019 | | 2020 | | 2021 | | 2022 | | 2023 | | Thereafter | | Total | | 2018 (a) |
| | | |
Senior Notes | | | | | | | | | | | | |
Fixed rate | | $ | — |
| | $ | 300.0 |
| | $ | — |
| | $ | 300.0 |
| | $ | — |
| | $ | 700.0 |
| | $ | 1,300.0 |
| | $ | 1,252.5 |
|
Weighted average interest rate | | n/a |
| | 7.150% |
| | n/a |
| | 7.000% |
| | n/a |
| | 5.625 | % | | 6.294 | % | | n/a |
|
| | | | | | | | | | | | | | | | |
Loans Payable and Other Borrowings | | | | | | | | | | | | |
Fixed rate | | $ | 5.4 |
| | $ | 9.1 |
| | $ | 0.2 |
| | $ | — |
| | $ | — |
| | $ | — |
| | $ | 14.8 |
| | $ | 14.8 |
|
Average interest rate (b) | | n/a |
| | n/a |
| | n/a |
| | n/a |
| | n/a |
| | n/a |
| | n/a |
| | n/a |
|
| |
(a) | Fair value of our fixed rate debt at December 31, 2018, is derived from quoted market prices by independent dealers. |
| |
(b) | Notes payable in connection with land purchases were all non-recourse and non-interest bearing as of December 31, 2018. |
Our operations are interest rate sensitive. As overall housing demand is adversely affected by increases in interest rates, an increase in mortgage interest rates may negatively affect the ability of homebuyers to secure adequate financing. Higher interest rates could adversely affect our revenues, gross margins and net income and would also increase our variable rate borrowing costs. We do not enter into, or intend to enter into, derivative financial instruments for trading or speculative purposes.
Item 8. Financial Statements and Supplementary Data
Our consolidated financial statements as of December 31, 2018 and 2017 and for each of the years in the three-year period ended December 31, 2018, together with related notes and the report of Deloitte & Touche LLP, independent registered public accounting firm, are on the following pages.
REPORT OF INDEPENDENT REGISTERED PUBLIC ACCOUNTING FIRM
To the stockholders and the Board of Directors of Meritage Homes Corporation
Opinion on the Financial Statements
We have audited the accompanying consolidated balance sheets of Meritage Homes Corporation and subsidiaries (the "Company") as of December 31, 2018 and 2017, the related consolidated income statements, stockholders' equity and cash flows for each of the three years in the period ended December 31, 2018, and the related notes (collectively referred to as the "financial statements"). In our opinion, the financial statements present fairly, in all material respects, the financial position of the Company as of December 31, 2018 and 2017, and the results of its operations and its cash flows for each of the three years in the period ended December 31, 2018, in conformity with accounting principles generally accepted in the United States of America.
We have also audited, in accordance with the standards of the Public Company Accounting Oversight Board (United States) (PCAOB), the Company's internal control over financial reporting as of December 31, 2018, based on criteria established in Internal Control - Integrated Framework (2013) issued by the Committee of Sponsoring Organizations of the Treadway Commission and our report dated February 15, 2019, expressed an unqualified opinion on the Company's internal control over financial reporting.
Basis for Opinion
These financial statements are the responsibility of the Company's management. Our responsibility is to express an opinion on the Company's financial statements based on our audits. We are a public accounting firm registered with the PCAOB and are required to be independent with respect to the Company in accordance with the U.S. federal securities laws and the applicable rules and regulations of the Securities and Exchange Commission and the PCAOB.
We conducted our audits in accordance with the standards of the PCAOB. Those standards require that we plan and perform the audit to obtain reasonable assurance about whether the financial statements are free of material misstatement, whether due to error or fraud. Our audits included performing procedures to assess the risks of material misstatement of the financial statements, whether due to error or fraud, and performing procedures that respond to those risks. Such procedures included examining, on a test basis, evidence regarding the amounts and disclosures in the financial statements. Our audits also included evaluating the accounting principles used and significant estimates made by management, as well as evaluating the overall presentation of the financial statements. We believe that our audits provide a reasonable basis for our opinion.
/s/ DELOITTE & TOUCHE LLP
Phoenix, Arizona
February 15, 2019
We have served as the Company's auditor since 2004.
MERITAGE HOMES CORPORATION AND SUBSIDIARIES
CONSOLIDATED BALANCE SHEETS
|
| | | | | | | | |
| | At December 31, |
| | 2018 | | 2017 |
| | (In thousands, except share data) |
Assets | | | | |
Cash and cash equivalents | | $ | 311,466 |
| | $ | 170,746 |
|
Other receivables | | 77,285 |
| | 79,317 |
|
Real estate | | 2,742,621 |
| | 2,731,380 |
|
Real estate not owned | | — |
| | 38,864 |
|
Deposits on real estate under option or contract | | 51,410 |
| | 59,945 |
|
Investments in unconsolidated entities | | 17,480 |
| | 17,068 |
|
Property and equipment, net | | 54,596 |
| | 33,631 |
|
Deferred tax asset | | 26,465 |
| | 35,162 |
|
Prepaids, other assets and goodwill | | 84,156 |
| | 85,145 |
|
Total assets | | $ | 3,365,479 |
| | $ | 3,251,258 |
|
Liabilities | | | | |
Accounts payable | | $ | 128,169 |
| | $ | 140,516 |
|
Accrued liabilities | | 177,862 |
| | 181,076 |
|
Home sale deposits | | 28,636 |
| | 34,059 |
|
Liabilities related to real estate not owned | | — |
| | 34,978 |
|
Loans payable and other borrowings | | 14,773 |
| | 17,354 |
|
Senior notes, net | | 1,295,284 |
| | 1,266,450 |
|
Total liabilities | | 1,644,724 |
| | 1,674,433 |
|
Stockholders’ Equity | | | | |
Preferred stock, par value $0.01. Authorized 10,000,000 shares; none issued and outstanding at December 31, 2018 and 2017 | | — |
| | — |
|
Common stock, par value $0.01. Authorized 125,000,000 shares; 38,072,659 and 40,330,741 shares issued and outstanding at December 31, 2018 and 2017, respectively | | 381 |
| | 403 |
|
Additional paid-in Capital | | 501,781 |
| | 584,578 |
|
Retained earnings | | 1,218,593 |
| | 991,844 |
|
Total stockholders’ equity | | 1,720,755 |
| | 1,576,825 |
|
Total liabilities and stockholders’ equity | | $ | 3,365,479 |
| | $ | 3,251,258 |
|
See accompanying notes to consolidated financial statements
MERITAGE HOMES CORPORATION AND SUBSIDIARIES
CONSOLIDATED INCOME STATEMENTS
|
| | | | | | | | | | | | |
| | | | | | |
| | Years Ended December 31, |
| | 2018 | | 2017 | | 2016 |
| | (In thousands, except per share data) |
Homebuilding: | | | | | | |
Home closing revenue | | $ | 3,474,712 |
| | $ | 3,186,775 |
| | $ | 3,003,426 |
|
Land closing revenue | | 38,707 |
| | 39,997 |
| | 25,801 |
|
Total closing revenue | | 3,513,419 |
| | 3,226,772 |
| | 3,029,227 |
|
Cost of home closings | | (2,842,762 | ) | | (2,624,636 | ) | | (2,474,584 | ) |
Cost of land closings | | (41,504 | ) | | (35,637 | ) | | (23,431 | ) |
Total cost of closings | | (2,884,266 | ) | | (2,660,273 | ) | | (2,498,015 | ) |
Home closing gross profit | | 631,950 |
| | 562,139 |
| | 528,842 |
|
Land closing gross (loss)/profit | | (2,797 | ) | | 4,360 |
| | 2,370 |
|
Total closing gross profit | | 629,153 |
| | 566,499 |
| | 531,212 |
|
Financial Services: | | | | | | |
Revenue | | 15,162 |
| | 14,203 |
| | 12,507 |
|
Expense | | (6,454 | ) | | (6,006 | ) | | (5,587 | ) |
Earnings from financial services unconsolidated entities and other, net | | 15,336 |
| | 13,858 |
| | 14,982 |
|
Financial services profit | | 24,044 |
| | 22,055 |
| | 21,902 |
|
Commissions and other sales costs | | (241,897 | ) | | (221,647 | ) | | (215,092 | ) |
General and administrative expenses | | (138,478 | ) | | (124,041 | ) | | (123,803 | ) |
Earnings from other unconsolidated entities, net | | 601 |
| | 2,101 |
| | 4,060 |
|
Interest expense | | (785 | ) | | (3,853 | ) | | (5,172 | ) |
Other income, net | | 10,616 |
| | 6,405 |
| | 4,953 |
|
Earnings before income taxes | | 283,254 |
| | 247,519 |
| | 218,060 |
|
Provision for income taxes | | (55,922 | ) | | (104,264 | ) | | (68,519 | ) |
Net earnings | | $ | 227,332 |
| | $ | 143,255 |
| | $ | 149,541 |
|
Earnings per common share: | | | | | | |
Basic | | $ | 5.67 |
| | $ | 3.56 |
| | $ | 3.74 |
|
Diluted | | $ | 5.58 |
| | $ | 3.41 |
| | $ | 3.55 |
|
Weighted average number of shares: | | | | | | |
Basic | | 40,107 |
| | 40,287 |
| | 39,976 |
|
Diluted | | 40,728 |
| | 42,228 |
| | 42,585 |
|
See accompanying notes to consolidated financial statements
MERITAGE HOMES CORPORATION AND SUBSIDIARIES
CONSOLIDATED STATEMENTS OF STOCKHOLDERS’ EQUITY
|
| | | | | | | | | | | | | | | | | | |
| Years Ended December 31, 2018, 2017 and 2016 |
| (In thousands) |
| Number of Shares | | Common Stock | | Additional Paid-In Capital | | Retained Earnings | | Total |
Balance at January 1, 2016 | 39,669 |
| | $ | 397 |
| | $ | 559,492 |
| | $ | 699,048 |
| | $ | 1,258,937 |
|
Net earnings | — |
| | — |
| | — |
| | 149,541 |
| | 149,541 |
|
Issuance of stock | 362 |
| | 3 |
| | 229 |
| | — |
| | 232 |
|
Excess income tax benefit from stock-based awards | — |
| | — |
| | (956 | ) | | — |
| | (956 | ) |
Equity award compensation expense | — |
| | — |
| | 13,741 |
| | — |
| | 13,741 |
|
Balance at December 31, 2016 | 40,031 |
| | 400 |
| | 572,506 |
| | 848,589 |
| | 1,421,495 |
|
Net earnings | — |
| | — |
| | — |
| | 143,255 |
| | 143,255 |
|
Issuance of stock | 300 |
| | 3 |
| | (3 | ) | | — |
| | — |
|
Equity award compensation expense | — |
| | — |
| | 12,075 |
| | — |
| | 12,075 |
|
Balance at December 31, 2017 | 40,331 |
| | 403 |
| | 584,578 |
| | 991,844 |
| | 1,576,825 |
|
Adoption of ASU 2014-09 (1) | — |
| | — |
| | — |
| | (583 | ) | | (583 | ) |
Net earnings | — |
| | — |
| | — |
| | 227,332 |
| | 227,332 |
|
Issuance of stock | 326 |
| | 4 |
| | (4 | ) | | — |
| | — |
|
Equity award compensation expense | — |
| | — |
| | 17,181 |
| | — |
| | 17,181 |
|
Share repurchases | (2,584 | ) | | (26 | ) | | (99,974 | ) | | — |
| | (100,000 | ) |
Balance at December 31, 2018 | 38,073 |
| | $ | 381 |
| | $ | 501,781 |
| | $ | 1,218,593 |
| | $ | 1,720,755 |
|
|
| |
(1) | Refer to Note 1 for additional information related to the adoption of ASU 2014-09. |
See accompanying notes to consolidated financial statements
MERITAGE HOMES CORPORATION AND SUBSIDIARIES
CONSOLIDATED STATEMENTS OF CASH FLOWS
|
| | | | | | | | | | | | |
| | Years Ended December 31, |
| | 2018 | | 2017 | | 2016 |
| | (In thousands) |
Cash flows from operating activities: | | | | | | |
Net earnings | | $ | 227,332 |
| | $ | 143,255 |
| | $ | 149,541 |
|
Adjustments to reconcile net earnings to net cash provided by/(used in) operating activities: | | | | | | |
Depreciation and amortization | | 26,966 |
| | 16,704 |
| | 15,978 |
|
Stock-based compensation | | 17,170 |
| | 12,056 |
| | 13,741 |
|
Excess income tax benefit from stock-based awards | | — |
| | — |
| | 956 |
|
Equity in earnings from unconsolidated entities | | (16,333 | ) | | (15,959 | ) | | (19,042 | ) |
Deferred tax asset revaluation | | (2,741 | ) | | 19,687 |
| | — |
|
Distributions of earnings from unconsolidated entities | | 16,142 |
| | 15,337 |
| | 16,959 |
|
Other | | 15,847 |
| | 5,849 |
| | 9,539 |
|
Changes in assets and liabilities: | | | | | | |
Increase in real estate | | (19,426 | ) | | (301,477 | ) | | (311,426 | ) |
Decrease in deposits on real estate under option or contract | | 12,444 |
| | 21,355 |
| | 2,337 |
|
Decrease/(increase) in receivables, prepaids and other assets | | 3,042 |
| | (17,775 | ) | | (17,513 | ) |
(Decrease)/increase in accounts payable and accrued liabilities | | (12,820 | ) | | 8,125 |
| | 43,377 |
|
(Decrease)/increase in home sale deposits | | (5,423 | ) | | 5,711 |
| | (7,849 | ) |
Net cash provided by/(used in) operating activities | | 262,200 |
| | (87,132 | ) | | (103,402 | ) |
Cash flows from investing activities: | | | | | | |
Investments in unconsolidated entities | | (808 | ) | | (670 | ) | | (7,244 | ) |
Distributions of capital from unconsolidated entities | | 597 |
| | 1,338 |
| | 3,600 |
|
Purchases of property and equipment | | (33,415 | ) | | (18,096 | ) | | (16,662 | ) |
Proceeds from sales of property and equipment | | 99 |
| | 356 |
| | 200 |
|
Maturities/sales of investments and securities | | 1,181 |
| | 1,402 |
| | 746 |
|
Payments to purchase investments and securities | | (1,181 | ) | | (1,402 | ) | | (746 | ) |
Net cash used in investing activities | | (33,527 | ) | | (17,072 | ) | | (20,106 | ) |
Cash flows from financing activities: | | | | | | |
(Repayment of)/proceeds from Credit Facility, net | | — |
| | (15,000 | ) | | 15,000 |
|
Repayment of loans payable and other borrowings | | (15,755 | ) | | (10,970 | ) | | (21,274 | ) |
Repayment of senior notes and senior convertible notes | | (175,000 | ) | | (126,691 | ) | | — |
|
Proceeds from issuance of senior notes | | 206,000 |
| | 300,000 |
| | — |
|
Payment of debt issuance costs | | (3,198 | ) | | (4,091 | ) | | — |
|
Excess income tax provision from stock-based awards | | — |
| | — |
| | (956 | ) |
Proceeds from stock option exercises | | — |
| | — |
| | 232 |
|
Repurchase of shares | | (100,000 | ) | | — |
| | — |
|
Net cash (used in)/provided by financing activities | | (87,953 | ) | | 143,248 |
| | (6,998 | ) |
Net increase/(decrease) in cash and cash equivalents | | 140,720 |
| | 39,044 |
| | (130,506 | ) |
Cash and cash equivalents, beginning of year | | 170,746 |
| | 131,702 |
| | 262,208 |
|
Cash and cash equivalents, end of year | | $ | 311,466 |
| | $ | 170,746 |
| | $ | 131,702 |
|
See Supplemental Disclosure of Cash Flow Information in Note 12.
See accompanying notes to consolidated financial statements
MERITAGE HOMES CORPORATION AND SUBSIDIARIES
NOTES TO CONSOLIDATED FINANCIAL STATEMENTS
December 31, 2018, 2017 and 2016
NOTE 1 — BUSINESS AND SUMMARY OF SIGNIFICANT ACCOUNTING POLICIES
Organization. Meritage Homes is a leading designer and builder of single-family homes. We primarily build in historically high-growth regions of the United States and offer a variety of homes that are designed with a focus on first-time and first move-up buyers. We have homebuilding operations in three regions: West, Central and East, which are comprised of nine states: Arizona, California, Colorado, Texas, Florida, Georgia, North Carolina, South Carolina and Tennessee. We also operate a wholly-owned title company, Carefree Title Agency, Inc. ("Carefree Title"). Carefree Title's core business includes title insurance and closing/settlement services we offer to our homebuyers. Through our successors, we commenced our homebuilding operations in 1985. Meritage Homes Corporation was incorporated in 1988 in the state of Maryland.
Our homebuilding and marketing activities are conducted under the name of Meritage Homes in each of our homebuilding markets. In limited cases, we also offer luxury homes in some markets under the name of Monterey Homes. At December 31, 2018, we were actively selling homes in 272 communities, with base prices ranging from approximately $182,000 to $1,286,000.
Basis of Presentation. The accompanying consolidated financial statements have been prepared in accordance with accounting principles generally accepted in the United States (“GAAP”) and include the accounts of Meritage Homes Corporation and those of our consolidated subsidiaries, partnerships and other entities in which we have a controlling financial interest, and of variable interest entities (see Note 3) in which we are deemed the primary beneficiary (collectively, “us”, “we”, “our” and the “Company”). Intercompany balances and transactions have been eliminated in consolidation.
Cash and Cash Equivalents. Liquid investments with an initial maturity of three months or less are classified as cash equivalents. Amounts in transit from title companies for home closings of approximately $76.1 million and $107.1 million are included in cash and cash equivalents at December 31, 2018 and 2017, respectively.
Real Estate. Real estate is stated at cost unless the asset is determined to be impaired, at which point the inventory is written down to fair value as required by Accounting Standards Codification (“ASC”) 360-10, Property, Plant and Equipment (“ASC 360-10”). Inventory includes the costs of land acquisition, land development, home construction, capitalized interest, real estate taxes, capitalized direct overhead costs incurred during development and home construction that benefit the entire community, less impairments, if any. Land and development costs are typically allocated and transferred to homes under construction when construction begins. Home construction costs are accumulated on a per-home basis, while selling costs are expensed as incurred. Cost of home closings includes the specific construction costs of the home and all related allocated land acquisition, land development and other common costs (both incurred and estimated to be incurred) that are allocated based upon the total number of homes expected to be closed in each community or phase. Any changes to the estimated total development costs of a community or phase are allocated to the remaining homes in the community or phase. When a home closes, we may have incurred costs for goods and services that have not yet been paid. An accrued liability to capture such obligations is recorded in connection with the home closing and charged directly to cost of sales.
We rely on certain estimates to determine our construction and land development costs. Construction and land costs are comprised of direct and allocated costs, including estimated future costs. In determining these costs, we compile project budgets that are based on a variety of assumptions, including future construction schedules and costs to be incurred. Actual results can differ from budgeted amounts for various reasons, including construction delays, labor or material shortages, increases in costs that have not yet been committed, changes in governmental requirements, or other unanticipated issues encountered during construction and development and other factors beyond our control. To address uncertainty in these budgets, we assess, update and revise project budgets on a regular basis, utilizing the most current information available to estimate construction and land costs.
Typically, a community's life cycle ranges from three to five years, commencing with the acquisition of the land, continuing through the land development phase, if applicable, and concluding with the sale, construction and closing of the homes. Actual community lives will vary based on the size of the community, the sales absorption rate and whether the land purchased was raw, partially-developed or in finished status. Master-planned communities encompassing several phases and super-block land parcels may have significantly longer lives and projects involving smaller finished lot purchases may be significantly shorter.
All of our land inventory and related real estate assets are reviewed for recoverability, as our inventory is considered “long-lived” in accordance with GAAP. Impairment charges are recorded to write down an asset to its estimated fair value if the undiscounted cash flows expected to be generated by the asset are lower than its carrying amount. Our determination of fair value is based on projections and estimates. Changes in these expectations may lead to a change in the outcome of our impairment analysis, and actual results may also differ from our assumptions. Our analysis is conducted if indication of a decline in value of our land and real estate assets exist. If an asset is deemed to be impaired, the impairment recognized is measured as the amount by which the asset's carrying amount exceeds its fair value. The impairment of a community is allocated to each lot on a straight-line basis.
Deposits. Deposits paid related to land option and purchase contracts are recorded and classified as Deposits on real estate under option or contract until the related land is purchased. Deposits are reclassified as a component of real estate inventory at the time the deposit is used to offset the acquisition price of the lots based on the terms of the underlying agreements. To the extent they are non-refundable, deposits are charged to expense if the land acquisition is terminated or no longer considered probable. Since our acquisition contracts typically do not require specific performance, we do not consider such contracts to be contractual obligations to purchase the land and our total exposure under such contracts is limited to the loss of any non-refundable deposits and any ancillary capitalized costs. Our deposits were $51.4 million and $59.9 million as of December 31, 2018 and December 31, 2017, respectively.
Goodwill. In accordance with ASC 350, Intangibles, Goodwill and Other ("ASC 350"), we analyze goodwill on an annual basis (or whenever indicators of impairment exist) through a qualitative assessment to determine whether it is necessary to perform a goodwill impairment test. ASC 350 states that an entity may assess qualitative factors to determine whether it is necessary to perform a goodwill impairment test. Such qualitative factors include: (1) macroeconomic conditions, such as a deterioration in general economic conditions, (2) industry and market considerations such as deterioration in the environment in which the entity operates, (3) cost factors such as increases in raw materials, labor costs, etc., and (4) overall financial performance such as negative or declining cash flows or a decline in actual or planned revenue or earnings. If the qualitative analysis determines that additional impairment testing is required, the two-step impairment testing in accordance with ASC 350 would be initiated. We continually evaluate our qualitative inputs to assess whether events and circumstances have occurred that indicate the goodwill balance may not be recoverable. See Note 9 for additional information related to goodwill.
Property and Equipment, net. Property and equipment, net consists of computer and office equipment, model home furnishings and capitalized sales office costs. Depreciation is generally calculated using the straight-line method over the estimated useful lives of the assets, which range from three to seven years. Depreciation expense was $16.3 million, $15.9 million, and $14.3 million for the years ended December 31, 2018, 2017 and 2016, respectively. Maintenance and repair costs are expensed as incurred. At December 31, 2018 and 2017, property and equipment, net consisted of the following (in thousands):
|
| | | | | | | | |
| | At December 31, |
| | 2018 | | 2017 |
Computer and office equipment | | $ | 50,197 |
| | $ | 40,731 |
|
Model home furnishings and capitalized sales office costs | | 87,768 |
| | 50,063 |
|
Gross property and equipment | | 137,965 |
| | 90,794 |
|
Accumulated depreciation | | (83,369 | ) | | (57,163 | ) |
Total (1) | | $ | 54,596 |
| | $ | 33,631 |
|
| |
(1) | Net capitalized sales office costs of $15.8 million were prospectively reclassified as of January 1, 2018 from Real estate to Property and equipment, net in accordance with ASU 2014-09, Revenue from Contracts with Customers. |
Deferred Costs. At December 31, 2018 and 2017, deferred costs representing debt issuance costs related to our Credit Facility totaled approximately $3.6 million and $3.0 million, net of accumulated amortization of approximately $7.6 million and $6.5 million respectively, and are included on our consolidated balance sheets within Prepaids, other assets and goodwill. The costs are primarily amortized to interest expense using the straight line method which approximates the effective interest method. See Note 6 for additional information related to net debt issuance costs associated with our senior notes.
Investments in Unconsolidated Entities. We use the equity method of accounting for investments in unconsolidated entities over which we exercise significant influence but do not have a controlling interest. Under the equity method, our share of the unconsolidated entities’ earnings or loss is included in Earnings from other unconsolidated entities, net, or Earnings from financial services unconsolidated entities and other, net, in our income statements. We use the cost method of accounting for investments in unconsolidated entities over which we do not have significant influence, if any. We track cumulative earnings and distributions from each of our ventures. For cash flow classification, to the extent distributions do not exceed cumulative
earnings, we designate such distributions as return on capital. Distributions in excess of cumulative earnings are treated as return of capital. We evaluate our investments in unconsolidated entities for impairment when events that trigger an evaluation of recoverability present themselves. See Note 4 for additional information related to investments in unconsolidated entities.
Accrued Liabilities. Accrued liabilities at December 31, 2018 and 2017 consisted of the following (in thousands):
|
| | | | | | | | |
| | At December 31, |
| | 2018 | | 2017 |
Accruals related to real estate development and construction activities | | $ | 54,589 |
| | $ | 53,522 |
|
Payroll and other benefits | | 60,209 |
| | 58,186 |
|
Accrued interest | | 13,296 |
| | 15,369 |
|
Accrued taxes | | 7,548 |
| | 14,067 |
|
Warranty reserves | | 24,552 |
| | 23,328 |
|
Other accruals | | 17,668 |
| | 16,604 |
|
Total | | $ | 177,862 |
| | $ | 181,076 |
|
Revenue Recognition. In accordance with ASU 2014-09 Revenue from Contracts with Customers (Topic 606), we apply the following steps in determining the timing and amount of revenue to recognize: (1) identify the contract with our customer; (2) identify the performance obligation(s) in the contract; (3) determine the transaction price; (4) allocate the transaction price to the performance obligations in the contract, if applicable; and (5) recognize revenue when (or as) we satisfy the performance obligation. The performance obligation and subsequent revenue recognition for our three sources of revenue are outlined below:
| |
• | Revenue from closings of residential real estate is recognized when closings have occurred, the risks and rewards of ownership are transferred to the buyer, and we have no continuing involvement with the property, which is generally upon the close of escrow. Revenue is reported net of any discounts and incentives. |
| |
• | Revenue from land sales is recognized when a significant down payment is received, title passes and collectability of the receivable is reasonably assured, and we have no continuing involvement with the property, which is generally upon the close of escrow. |
| |
• | Revenue from financial services is recognized when closings have occurred and all financial services have been rendered, which is generally upon the close of escrow. |
Home sale contract assets consist of cash from home closings that are in transit from title companies, which are considered cash in transit and are classified as cash on our accompanying consolidated balance sheet. See "Cash and Cash Equivalents" in this Note 1 for further information. Contract liabilities include home sale deposit liabilities related to sold but unclosed homes, and are classified as Home sale deposits in our accompanying consolidated balance sheet. Substantially all of our home sales are scheduled to close and be recorded as revenue within one year from the date of receiving a customer deposit. Revenue expected to be recognized in any future year related to remaining performance obligations (if any) and contract liabilities expected to be recognized as revenue, excluding revenue pertaining to contracts that have an original expected duration of one year or less, is not material. Our three sources of revenue are disaggregated by type in the accompanying consolidated income statements.
Cost of Home Closings. Cost of home closings includes direct home construction costs, closing costs, land acquisition and development costs, development period interest and common costs, and impairments, if any. Direct construction costs are accumulated during the period of construction and charged to cost of closings under specific identification methods, as are closing costs. Estimates of costs incurred or to be incurred but not paid are accrued and expensed at the time of closing. Land development, acquisition and common costs are allocated to each lot based on the number of lots remaining to close.
Income Taxes. We account for income taxes using the asset and liability method, which requires that deferred tax assets and liabilities be recognized based on future tax consequences of both temporary differences between the financial statement carrying amounts of existing assets and liabilities and their respective tax bases. Deferred tax assets and liabilities are measured using enacted tax rates expected to apply in the years in which the temporary differences are expected to be recovered or settled. The effect on deferred tax assets and liabilities of a change in tax rates is recognized in earnings in the period when the changes are enacted.
We record deferred tax assets to the extent we believe these assets will more likely than not be realized. In making such determination, we consider all available objectively verifiable positive and negative evidence, including scheduled reversals of
deferred tax liabilities, whether we are in a cumulative loss position, projected future taxable income, tax planning strategies and recent financial operations. If we determine that we will not be able to realize our deferred tax assets in the future, we will record a valuation allowance, which increases the provision for income taxes.
We recognize interest and penalties related to unrecognized tax benefits within the Provision for income taxes line in the accompanying consolidated income statement. Accrued interest and penalties are included within the Accrued liabilities line in the accompanying consolidated balance sheets. See Note 11 for additional information related to income taxes.
Advertising Costs. We expense advertising costs as they are incurred. Advertising expense was approximately $15.4 million, $15.8 million and $15.0 million in fiscal 2018, 2017 and 2016, respectively.
Earnings Per Share. We compute basic earnings per share by dividing net earnings by the weighted average number of common shares outstanding during the period. Diluted earnings per share gives effect to the potential dilution that could occur if securities or contracts to issue common stock that are dilutive were exercised or converted into common stock or resulted in the issuance of common stock that then shared in our earnings. In periods of net losses, no dilution is computed. See Note 8 for additional information related to earnings per share.
Stock-Based Compensation. We account for stock-based compensation in accordance with ASC 718-10, Compensation—Stock Compensation ("ASC 718"). This guidance requires us to estimate forfeitures in calculating the expense related to stock-based compensation. Awards with either a graded or cliff vesting are expensed on a straight-line basis over the life of the award. See Note 10 for additional information on stock-based compensation.
401(k) Retirement Plan. We have a 401(k) plan for all full-time Meritage employees. We match portions of employees’ voluntary contributions, and contributed to the plan approximately $3.7 million, $2.9 million and $2.7 million for the years ended 2018, 2017 and 2016, respectively.
Off-Balance Sheet Arrangements - Joint Ventures. We may participate in land development joint ventures as a means of accessing larger parcels of land and lot positions, expanding our market opportunities, managing our risk profile and leveraging our capital base. See Note 4 for additional discussion of our investments in unconsolidated entities.
Off-Balance Sheet Arrangements - Other. In the normal course of business, we may acquire lots from various development entities pursuant purchase and option agreements. The purchase price generally approximates the market price at the date the contract is executed (with possible future escalators) and may have staggered purchase schedules. See Note 3 for additional information on off-balance sheet arrangements.
Surety Bonds and Letters of Credit. We provide letters of credit in support of our obligations relating to the development of our projects and other corporate purposes. Surety bonds are generally posted in lieu of letters of credit or cash deposits. The amount of these obligations outstanding at any time varies depending on the stage and level of our development activities. Bonds are generally not wholly released until all development activities under the bond are complete. In the event a bond or letter of credit is drawn upon, we would be obligated to reimburse the issuer for any amounts advanced under the bond or letter of credit. We believe it is unlikely that any significant amounts of these bonds or letters of credit will be drawn upon. The table below outlines our surety bond and letter of credit obligations (in thousands):
|
| | | | | | | | | | | | | | | | |
| | At December 31, |
| | 2018 | | 2017 |
| | Outstanding | | Estimated work remaining to complete (unaudited) | | Outstanding | | Estimated work remaining to complete (unaudited) |
Sureties: | | | | | | | | |
Sureties related to owned projects and lots under contract | | 339,221 |
| | 133,662 |
| | 296,387 |
| | 120,320 |
|
Total Sureties | | $ | 339,221 |
| | $ | 133,662 |
| | $ | 296,387 |
| | $ | 120,320 |
|
Letters of Credit (“LOCs”): | | | | | | | | |
LOCs for land development | | 70,287 |
| | N/A |
| | 70,922 |
| | N/A |
|
LOCs for general corporate operations | | 3,750 |
| | N/A |
| | 3,750 |
| | N/A |
|
Total LOCs | | $ | 74,037 |
| | N/A |
| | $ | 74,672 |
| | N/A |
|
Warranty Reserves. We provide home purchasers with limited warranties against certain building defects and have certain obligations related to those post-construction warranties for closed homes. The specific terms and conditions of these limited
warranties vary by state, but overall the nature of the warranties include a complete workmanship and materials warranty typically during the first one to two years after the close of the home and a structural warranty that typically extends up to 10 years subsequent to the close of the home. With the assistance of an actuary, we have estimated these reserves for the structural warranty based on the number of homes still under warranty and historical data and trends for our communities. We also use industry data with respect to similar product types and geographic areas in markets where our experience is incomplete to draw a meaningful conclusion. We regularly review our warranty reserves and adjust them, as necessary, to reflect changes in trends as information becomes available. Based on such reviews of warranty costs incurred, we did not adjust the warranty reserve balance in the twelve months ended December 31, 2018 and decreased it by $1.6 million net in the twelve months ended December 31, 2017, which decreased our cost of sales. Included in the warranty reserve balances at December 31, 2018 and December 31, 2017 reflected in the table below are case-specific reserves for two warranty matters related to (1) alleged stucco defects in Florida; and (2) a foundation design matter affecting a single community in Texas.
A summary of changes in our warranty reserves follows (in thousands):
|
| | | | | | | | |
| | Years Ended December 31, |
| | 2018 | | 2017 |
Balance, beginning of year | | $ | 23,328 |
| | $ | 22,660 |
|
Additions to reserve from new home deliveries | | 15,906 |
| | 17,161 |
|
Warranty claims | | (14,682 | ) | | (14,854 | ) |
Adjustments to pre-existing reserves | | — |
| | (1,639 | ) |
Balance, end of year | | $ | 24,552 |
| | $ | 23,328 |
|
Warranty reserves are included in Accrued liabilities on the accompanying consolidated balance sheets, and additions and adjustments to the reserves are included in Cost of home closings within the accompanying consolidated income statements. These reserves are intended to cover costs associated with our contractual and statutory warranty obligations, which include, among other items, claims involving defective workmanship and materials. We believe that our total reserves, coupled with our contractual relationships and rights with our trades and the insurance we maintain, are sufficient to cover our general warranty obligations. However, as unanticipated changes in legal, weather, environmental or other conditions could have an impact on our actual warranty costs, future costs could differ significantly from our estimates.
Recent Accounting Pronouncements.
In August 2018, the Financial Accounting Standards Board ("FASB") issued Accounting Standards Update ("ASU") No. 2018-15, Intangibles - Goodwill and Other - Internal-Use Software (Subtopic 350-40): Customer's Accounting for Implementation Costs Incurred in a Cloud Computing Arrangement that is a Service Contract ("ASU 2018-15"), which aligns the requirements for capitalizing implementation costs incurred in a hosting arrangement that is a service contract with the requirements for capitalizing implementation costs incurred to develop or obtain internal-use software. ASU 2018-15 is effective for us beginning January 1, 2020. ASU 2018-15 is required to be applied either retrospectively or prospectively to all implementation costs incurred after the date of adoption. We are currently evaluating the impact adopting this guidance will have on our financial statements.
In August 2018, the FASB issued ASU No. 2018-13, Fair Value Measurement (Topic 820): Disclosure Framework - Changes to the Disclosure Requirements for Fair Value Measurement ("ASU 2018-13"), which modifies the disclosure requirements of fair value measurements. ASU 2018-13 is effective for us beginning January 1, 2020. Certain disclosures are required to be applied on a retrospective basis and others on a prospective basis. We are currently evaluating the impact adopting this guidance will have on our financial statement disclosures.
In January 2017, the Financial Accounting Standards Board ("FASB") issued Accounting Standards Update ("ASU") No. 2017-04, Intangibles - Goodwill and Other (Topic 350), Simplifying the Accounting for Goodwill Impairment ("ASU 2017-04"), which simplifies the accounting for goodwill impairments by eliminating the second step of the goodwill impairment test. Under the new guidance, an impairment loss will reflect the amount by which the carrying amount of a reporting unit exceeds its fair value, not to exceed the carrying amount of goodwill. ASU 2017-04 is effective for us beginning January 1, 2020, with early adoption permitted. We elected to early adopt ASU 2017-04 effective January 1, 2018 and it did not have a material impact on our financial statements.
In August 2016, the FASB issued ASU No. 2016-15, Statement of Cash Flows (Topic 230): Classification of Certain Cash Receipts and Cash Payments, ("ASU 2016-15"). ASU 2016-15 adds and clarifies guidance on the classification of certain cash receipts and payments in the statement of cash flows, reducing the existing diversity in practice that has resulted from the lack of consistent principles on this topic. ASU 2016-15 was effective for us beginning January 1, 2018. A retrospective transition method was required on adoption and it did not have a material impact on our statement of cash flows.
In February 2016, the FASB issued ASU No. 2016-02, Leases (Topic 842) ("ASU 2016-02"), which amends the existing accounting standards for lease accounting, including requiring lessees to recognize most leases on their balance sheets. ASU 2016-02 will be effective for us beginning January 1, 2019. ASU 2016-02 requires a modified retrospective transition approach for all leases existing at, or entered into after, the date of initial application, with an option to use certain transition relief. In July 2018, the FASB issued ASU No. 2018-11, Leases (Topic 842): Targeted Improvements ("ASU 2018-11"), which provides entities with an additional transition method that allows entities to initially apply the new leases standard at the adoption date and recognize a cumulative-effect adjustment to the opening balance of retained earnings while continuing to present all prior periods under the previous lease accounting guidance. Also in July 2018, the FASB issued Accounting Standards Update No. 2018-10, Codification Improvements to Topic 842, Leases (“ASU 2018-10”), which provides clarification about the proper implementation of several topics in ASU 2016-02. We have identified our population of leases and related systems and internal control considerations associated with the adoption of ASU 2018-11. Our consolidated balance sheets will be impacted by the recording of a right of use asset and associated lease liability for virtually all of our current operating leases, which are primarily comprised of office space leases. The liability will be equal to the present value of the remaining lease payments while the right-of-use asset will be based on the liability, subject to adjustment, such as for initial direct costs. The right of use asset and lease liability are expected to have a gross up impact on our consolidated balance sheet of approximately $20 million, however, we do not expect a material impact on our consolidated income statements.
In May 2014, the FASB issued ASU 2014-09, Revenue from Contracts with Customers (Topic 606), (“ASU 2014-09”). ASU 2014-09 requires entities to recognize revenue that depicts the transfer of promised goods or services to customers in an amount that reflects the consideration to which the entity expects to be entitled in exchange for those goods or services. We adopted ASU 2014-09 on January 1, 2018 using a modified retrospective method.
The adoption of ASU 2014-09 did not have an impact on the amount or timing of our homebuilding revenues, although forfeited customer deposits, typically an immaterial amount on an annual basis, that were previously included in Other income, net are reported as Home closing revenue in our consolidated income statements effective January 1, 2018. Additionally, as a result of the adoption of ASU 2014-09, there was an immaterial adjustment to our opening balance of Retained earnings with respect to the timing of expenses resulting from ceasing the capitalization of certain selling costs we incur as part of the selling process. The majority of these previously capitalized costs were allocated to either Real estate or Property and equipment, net on our opening 2018 consolidated balance sheet, with an immaterial amount recognized as a cumulative effect adjustment to the opening balance of Retained earnings. See "Property and Equipment, net" and "Revenue Recognition" in this Note 1 for further information.
As of and for the year ended December 31, 2018 the adoption of ASU 2014-09 did not have a material impact on our balance sheet, net earnings, stockholders' equity or our statement of cash flows. The comparative information has not been restated and continues to be reported under the accounting standards in effect for those periods.
NOTE 2 — REAL ESTATE AND CAPITALIZED INTEREST
Real estate consists of the following (in thousands):
|
| | | | | | | | |
| | At December 31, |
| | 2018 | | 2017 |
Homes under contract under construction (1) | | $ | 480,143 |
| | $ | 566,474 |
|
Unsold homes, completed and under construction (1) | | 644,717 |
| | 516,577 |
|
Model homes (1) | | 146,327 |
| | 142,026 |
|
Finished home sites and home sites under development (2) | | 1,471,434 |
| | 1,506,303 |
|
| | $ | 2,742,621 |
| | $ | 2,731,380 |
|
| |
(1) | Includes the allocated land and land development costs associated with each lot for these homes. |
| |
(2) | Includes raw land, land held for development and land held for sale. Land held for development primarily reflects land and land development costs related to land where development activity is not currently underway but is expected to begin in the future. For these parcels, we may have chosen not to currently develop certain land holdings as they typically represent a portion or phases of a larger land parcel that we plan to build out over several years. We do not capitalize interest for inactive assets, and all ongoing costs of land ownership (i.e. property taxes, homeowner association dues, etc.) are expensed as incurred. |
Subject to sufficient qualifying assets, we capitalize our development period interest costs incurred in connection with the development and construction of real estate. Capitalized interest is allocated to active real estate when incurred and charged to cost of closings when the related property is delivered. A summary of our capitalized interest is as follows (in thousands):
|
| | | | | | | | | | | | |
| | Years Ended December 31, |
| | 2018 | | 2017 | | 2016 |
Capitalized interest, beginning of year | | $ | 78,564 |
| | $ | 68,196 |
| | $ | 61,202 |
|
Interest incurred | | 85,278 |
| | 79,045 |
| | 70,348 |
|
Interest expensed | | (785 | ) | | (3,853 | ) | | (5,172 | ) |
Interest amortized to cost of home and land closings | | (74,603 | ) | | (64,824 | ) | | (58,182 | ) |
Capitalized interest, end of year (1) | | $ | 88,454 |
| | $ | 78,564 |
| | $ | 68,196 |
|
| |
(1) | Approximately $454,000, $517,000 and $130,000 of the capitalized interest is related to our joint venture investments and is a component of “Investments in unconsolidated entities” in our consolidated balance sheet as of December 31, 2018, 2017 and 2016, respectively. |
NOTE 3 — VARIABLE INTEREST ENTITIES AND CONSOLIDATED REAL ESTATE NOT OWNED
We enter into purchase and option agreements for land or lots as part of the normal course of business. These purchase and option agreements enable us to acquire properties at one or multiple future dates at pre-determined prices. We believe these acquisition structures reduce our financial risk associated with land acquisitions and holdings and allow us to better leverage our balance sheet.
Based on the provisions of the relevant accounting guidance, we have concluded that when we enter into a purchase agreement to acquire land or lots from an entity, a variable interest entity, or “VIE”, may be created. We evaluate all option and purchase agreements for land to determine whether they are a VIE. ASC 810, Consolidation, requires that for each VIE, we assess whether we are the primary beneficiary and, if we are, we consolidate the VIE in our financial statements and reflect such assets and liabilities as Real estate not owned. The liabilities related to consolidated VIEs are generally excluded from our debt covenant calculations.
In order to determine if we are the primary beneficiary, we must first assess whether we have the ability to control the activities of the VIE that most significantly impact its economic performance. Such activities include, but are not limited to, the ability to determine the budget and scope of land development work, if any; the ability to control financing decisions for the VIE; the ability to acquire additional land into the VIE or dispose of land in the VIE not under contract with Meritage; and the ability to change or amend the existing option contract with the VIE. If we are not determined to control such activities, we are not considered the primary beneficiary of the VIE. If we do have the ability to control such activities, we will continue our analysis by determining if we are also expected to absorb a potentially significant amount of the VIE’s losses or, if no party absorbs the majority of such losses, if we will benefit from a potentially significant amount of the VIE’s expected gains.
In substantially all cases, creditors of the entities with which we have option agreements have no recourse against us and the maximum exposure to loss in our option agreements is limited to non-refundable option deposits and any capitalized pre-acquisition costs. Often, we are at risk for items over budget related to land development on property we have under option if we are the land developer. In these cases, we have contracted to complete development at a fixed cost on behalf of the land owner and any budget savings or shortfalls are borne by us. Some of our option deposits may be refundable to us if certain contractual conditions are not performed by the party selling the lots.
The table below presents a summary of our lots under option that are not recorded on the balance sheet at December 31, 2018 (dollars in thousands):
|
| | | | | | | | | | | | | |
| | Projected Number of Lots (unaudited) | | Purchase Price (unaudited) | | Option/ Earnest Money Deposits–Cash | | |
Purchase and option contracts recorded on balance sheet as Real estate not owned | | — |
| | $ | — |
| | $ | — |
| | |
Option contracts — non-refundable deposits, committed (1) | | 4,325 |
| | 293,274 |
| | 31,248 |
| | |
Purchase contracts — non-refundable deposits, committed (1) | | 5,468 |
| | 206,986 |
| | 15,787 |
| | |
Purchase and option contracts —refundable deposits, committed | | 751 |
| | 32,974 |
| | 401 |
| | |
Total committed | | 10,544 |
| | 533,234 |
| | 47,436 |
| | |
Purchase and option contracts — refundable deposits, uncommitted (2) | | 11,243 |
| | 377,669 |
| | 3,974 |
| | |
Total lots under contract or option | | 21,787 |
| | $ | 910,903 |
| | $ | 51,410 |
| | |
Total purchase and option contracts | | 21,787 |
| | $ | 910,903 |
| | $ | 51,410 |
| | (3) |
| |
(1) | Deposits are non-refundable except if certain contractual conditions are not performed by the selling party. |
| |
(2) | Deposits are refundable at our sole discretion. We have not completed our acquisition evaluation process and we have not internally committed to purchase these lots. |
| |
(3) | Amount is reflected in our consolidated balance sheet in the line item “Deposits on real estate under option or contract” as of December 31, 2018. |
Generally, our options to purchase lots remain effective so long as we purchase a pre-established minimum number of lots each month or quarter, as determined by the respective agreement. Although the pre-established number is typically structured to approximate our expected rate of home construction starts, during a weakened homebuilding market, we may purchase lots at an absorption level that exceeds our sales and home starts pace needed to meet the pre-established minimum number of lots or restructure our original contract to terms that more accurately reflect our revised sales pace expectations.
NOTE 4 - INVESTMENTS IN UNCONSOLIDATED ENTITIES
We may enter into joint ventures as a means of accessing larger parcels of land, expanding our market opportunities, managing our risk profile and leveraging our capital base. While purchasing land through a joint venture can be beneficial, currently we do not view joint ventures as critical to the success of our homebuilding operations. Based on the structure of these joint ventures, they may or may not be consolidated into our results. Our joint venture partners generally are other homebuilders, land sellers or other real estate investors. We generally do not have a controlling interest in these ventures, which means our joint venture partners could cause the venture to take actions we disagree with, or fail to take actions we believe should be undertaken, including the sale of the underlying property to repay debt or recoup all or part of the partners' investments. As of December 31, 2018, we had three active equity-method land ventures.
As of December 31, 2018, we also participated in one mortgage joint venture, which is engaged in mortgage activities and primarily provides services to our homebuyers. Our investment in this mortgage joint venture as of December 31, 2018 and December 31, 2017 was $2.8 million and $2.2 million, respectively.
Summarized condensed financial information related to unconsolidated joint ventures that are accounted for using the equity method was as follows (in thousands): |
| | | | | | | |
| At December 31, |
| 2018 | | 2017 |
Assets: | | | |
Cash | $ | 9,595 |
| | $ | 8,942 |
|
Real estate | 57,631 |
| | 55,552 |
|
Other assets | 3,644 |
| | 4,323 |
|
Total assets | $ | 70,870 |
| | $ | 68,817 |
|
Liabilities and equity: | | | |
Accounts payable and other liabilities | $ | 8,682 |
| | $ | 7,516 |
|
Notes and mortgages payable | 26,808 |
| | 25,194 |
|
Equity of: | | | |
Meritage (1) | 14,472 |
| | 14,521 |
|
Other | 20,908 |
| | 21,586 |
|
Total liabilities and equity | $ | 70,870 |
| | $ | 68,817 |
|
|
| | | | | | | | | | | |
| Years Ended December 31, |
| 2018 | | 2017 | | 2016 |
Revenue | $ | 43,672 |
| | $ | 45,475 |
| | $ | 72,486 |
|
Costs and expenses | (17,294 | ) | | (19,203 | ) | | (34,080 | ) |
Net earnings of unconsolidated entities | $ | 26,378 |
| | $ | 26,272 |
| | $ | 38,406 |
|
Meritage’s share of pre-tax earnings (1) (2) | $ | 16,396 |
| | $ | 16,082 |
| | $ | 19,357 |
|
| |
(1) | Balance represents Meritage’s interest, as reflected in the financial records of the respective joint ventures. This balance may differ from the balance reflected in our consolidated financial statements due to the following reconciling items: (i) timing differences for revenue and distributions recognition, (ii) step-up basis and corresponding amortization, (iii) capitalization of interest on qualified assets, (iv) income deferrals as discussed in Note (2) below and (v) the cessation of allocation of losses from joint ventures in which we have previously written down our investment balance to zero and where we have no commitment to fund additional losses. As discussed in Note 2 to these consolidated financial statements, the balances above do not include $454,000, $517,000 and $130,000 of capitalized interest that is a component of our investment balances at December 31, 2018, 2017 and 2016, respectively. |
| |
(2) | Our share of pre-tax earnings is recorded in Earnings from financial services unconsolidated entities and other, net or Earnings from other unconsolidated entities, net, as applicable, on our consolidated income statements and excludes joint venture profit related to lots we purchased from the joint ventures. Such profit is deferred until homes are delivered by us and title passes to a homebuyer. |
The joint venture assets and liabilities noted in the table above represent the three active land ventures, one mortgage and various inactive ventures. Our total investment in all of these joint ventures is $17.5 million as of December 31, 2018. We believe these ventures are in compliance with their respective debt agreements, if applicable, and such debt is non-recourse to us.
NOTE 5 — LOANS PAYABLE AND OTHER BORROWINGS
Loans payable and other borrowings consist of the following (in thousands):
|
| | | | | | | | |
| | At December 31, |
| | 2018 | | 2017 |
Other borrowings, real estate note payable (1) | | $ | 14,773 |
| | $ | 17,354 |
|
$780.0 million unsecured revolving credit facility with interest approximating LIBOR (approximately 2.52% at December 31, 2018) plus 1.75% or Prime (5.50% at December 31, 2018) plus 0.75% | | — |
| | — |
|
Total | | $ | 14,773 |
| | $ | 17,354 |
|
| |
(1) | Reflects balance of non-recourse non-interest bearing notes payable in connection with land purchases as of December 31, 2018. |
The Company entered into an amended and restated unsecured revolving credit facility ("Credit Facility") in 2014 that has been amended from time to time. In June 2018, the aggregate commitment was increased to $780.0 million and the maturity date extended to July 2022. The accordion feature was refreshed permitting the size of the facility to increase to a maximum of $880.0 million, subject to certain conditions, including the availability of additional bank commitments. Borrowings under the Credit Facility are unsecured but availability is subject to, among other things, a borrowing base. The Credit Facility also contains certain financial covenants, including (a) a minimum tangible net worth requirement of $1.1 billion (which amount is subject to increase over time based on subsequent earnings and proceeds from equity offerings), and (b) a maximum leverage covenant that prohibits the leverage ratio (as defined therein) from exceeding 60%. In addition, we are required to maintain either (i) an interest coverage ratio (EBITDA to interest expense, as defined therein) of at least 1.50 to 1.00 or (ii) liquidity (as defined therein) of an amount not less than our consolidated interest incurred during the trailing 12 months. We were in compliance with all Credit Facility covenants as of December 31, 2018.
We had no outstanding borrowings under the Credit Facility as of December 31, 2018 and December 31, 2017. During the twelve months ended December 31, 2018 we had $285.0 million of gross borrowings and repayments. During the twelve months ended December 31, 2017 we had $415.0 million of gross borrowings and $430.0 million of repayments, respectively. Borrowings and repayments during the twelve months ended December 31, 2016 totaled $286.0 million and $271.0 million, respectively. As of December 31, 2018 we had outstanding letters of credit issued under the Credit Facility totaling $74.0 million, leaving $706.0 million available under the Credit Facility to be drawn.
NOTE 6 — SENIOR NOTES, NET
Senior notes, net consist of the following (in thousands):
|
| | | | | | | | |
| | At December 31, |
| | 2018 | | 2017 |
4.50% senior notes due 2018 | | $ | — |
| | $ | 175,000 |
|
7.15% senior notes due 2020. At December 31, 2018 and December 31, 2017 there was approximately $711 and $1,280 in net unamortized premium, respectively | | 300,711 |
| | 301,280 |
|
7.00% senior notes due 2022 | | 300,000 |
| | 300,000 |
|
6.00% senior notes due 2025. At December 31, 2018 there was approximately $5,318 in net unamortized premium. (1) | | 405,318 |
| | 200,000 |
|
5.125% senior notes due 2027 | | 300,000 |
| | 300,000 |
|
Net debt issuance costs | | (10,745 | ) | | (9,830 | ) |
Total | | $ | 1,295,284 |
| | $ | 1,266,450 |
|
| |
(1) | $200.0 million of the total $400.0 million of 6.00% Senior Notes due 2025 outstanding at December 31, 2018 was issued at par and had no unamortized premium. |
The indentures for all of our senior notes contain covenants including, among others, limitations on the amount of secured debt we may incur, and limitations on sale and leaseback transactions and mergers. We believe we are in compliance with all such covenants as of December 31, 2018.
Obligations to pay principal and interest on the senior notes are guaranteed by substantially all of our wholly-owned subsidiaries (each a “Guarantor” and, collectively, the “Guarantor Subsidiaries”), each of which is directly or indirectly 100% owned by Meritage Homes Corporation. Such guarantees are full and unconditional, and joint and several. In the event of a sale or other disposition of all of the assets of any Guarantor, by way of merger, consolidation or otherwise, or a sale or other disposition of all of the equity interests of any Guarantor then held by Meritage and its subsidiaries, then that Guarantor will be released and relieved of any obligations under its note guarantee. There are no significant restrictions on our ability or the ability of any Guarantor to obtain funds from their respective subsidiaries, as applicable, by dividend or loan. We do not provide separate financial statements of the Guarantor Subsidiaries because Meritage (the parent company) has no independent assets or operations and the guarantees are full and unconditional and joint and several. Subsidiaries of Meritage Homes Corporation that are nonguarantor subsidiaries, if any, are, individually and in the aggregate, minor.
During 2010, we completed an offering of $200.0 million aggregate principal amount of 7.15% senior notes due 2020. The notes were issued at 97.567% of par value to yield 7.50%. In the fourth quarter of 2013, we completed a $100.0 million add-on offering to the existing 7.50% senior notes due 2020. The add-on was issued at 106.699% of par value to yield 5.875%.
In April 2012, we completed an offering of $300.0 million aggregate principal amount of 7.00% Senior Notes due 2022. Concurrent with this offering, we repurchased all $285.0 million outstanding of our 6.25% Senior Notes due 2015. We also repurchased the remaining aggregate principal amount of approximately $26.1 million of our 7.731% Senior Subordinated Notes due 2017.
In June 2015, we completed an offering of $200.0 million aggregate principal amount of 6.00% Senior Notes due 2025 (the "2025 Notes"). The 2025 Notes were issued at par, and the proceeds were used for general corporate obligations and future land spend. In March 2018, the Company completed an offering of $200.0 million aggregate principal amount of additional 2025 Notes (the "Additional Notes"). The Additional Notes were issued as an add-on to the existing 2025 Notes that were issued in June 2015 which resulted in a combined $400.0 million aggregate principal amount of 6.00% Senior Notes due 2025 outstanding as of December 31, 2018. The Additional Notes were issued at a premium of 103% of the principal amount and the net proceeds were used to repay outstanding borrowings under the Credit Facility, which included borrowings used for the redemption of the Company's $175.0 million of 4.50% Senior Notes that were due to mature on March 1, 2018.
In June 2017, we completed an offering of $300.0 million aggregate principal amount of 5.125% Senior Notes due 2027 (the "2027 Notes"). The 2027 notes were issued at par. Using the proceeds from the 2027 Notes offering, we retired all $126.5 million of our convertible senior notes through a repurchase of $51.9 million in privately negotiated transactions and a redemption of the remaining $74.6 million through a combination of holder redemptions and an exercise of our call option at a redemption price equal to 100% of the principal amount of the notes redeemed, plus accrued and unpaid interest. As a result, we incurred a loss on extinguishment of debt of $0.3 included in Other income, net, in the accompanying consolidated income statement for the twelve months ended December 31, 2017.
Scheduled principal maturities of our senior and notes as of December 31, 2018 follow (in thousands): |
| | | |
Year Ended December 31, | |
2019 | $ | — |
|
2020 | 300,000 |
|
2021 | — |
|
2022 | 300,000 |
|
2023 | — |
|
Thereafter | 700,000 |
|
Total | $ | 1,300,000 |
|
NOTE 7 — FAIR VALUE DISCLOSURES
We account for non-recurring fair value measurements of our non-financial assets and liabilities in accordance with ASC 820-10 Fair Value Measurement. This guidance defines fair value, establishes a framework for measuring fair value and addresses required disclosures about fair value measurements. This standard establishes a three-level hierarchy for fair value measurements based upon the significant inputs used to determine fair value. Observable inputs are those which are obtained from market participants external to the company while unobservable inputs are generally developed internally, utilizing management’s estimates, assumptions and specific knowledge of the assets/liabilities and related markets. The three levels are defined as follows:
| |
• | Level 1 — Valuation is based on quoted prices in active markets for identical assets and liabilities. |
| |
• | Level 2 —Valuation is determined from quoted prices for similar assets or liabilities in active markets, quoted prices for identical or similar instruments in markets that are not active, or by model-based techniques in which all significant inputs are observable in the market. |
| |
• | Level 3 — Valuation is derived from model-based techniques in which at least one significant input is unobservable and based on the company’s own estimates about the assumptions that market participants would use to value the asset or liability. |
If the only observable inputs are from inactive markets or for transactions which the company evaluates as “distressed”, the use of Level 1 inputs should be modified by the company to properly address these factors, or the reliance of such inputs may be limited, with a greater weight attributed to Level 3 inputs. Refer to Notes 1 and 2 for additional information regarding the valuation of our non-financial assets.
Financial Instruments: The fair value of our fixed-rate debt is derived from quoted market prices by independent dealers (level 2 inputs as per the discussion above) and is as follows (in thousands): |
| | | | | | | | | | | | | | | | | |
| | | At December 31, |
| | | 2018 | | 2017 |
| | | Aggregate Principal | | Estimated Fair Value | | Aggregate Principal | | Estimated Fair Value |
4.50% senior notes | | | N/A |
| | N/A |
| | $ | 175,000 |
| | $ | 175,228 |
|
7.15% senior notes | | | $ | 300,000 |
| | $ | 307,500 |
| | $ | 300,000 |
| | $ | 326,250 |
|
7.00% senior notes | | | $ | 300,000 |
| | $ | 309,750 |
| | $ | 300,000 |
| | $ | 337,500 |
|
6.00% senior notes | | | $ | 400,000 |
| | $ | 379,520 |
| | $ | 200,000 |
| | $ | 214,000 |
|
5.125% senior notes | | | $ | 300,000 |
| | $ | 255,750 |
| | $ | 300,000 |
| | $ | 305,250 |
|
Due to the short-term nature of other financial assets and liabilities including our Loans payable and other borrowings, we consider the carrying amounts of our other short-term financial instruments to approximate fair value.
NOTE 8 — EARNINGS PER SHARE
Basic and diluted earnings per common share were calculated as follows (in thousands, except per share amounts):
|
| | | | | | | | | | | | |
| | Years Ended December 31, |
| | 2018 | | 2017 | | 2016 |
Basic weighted average number of shares outstanding | | 40,107 |
| | 40,287 |
| | 39,976 |
|
Effect of dilutive securities: | | | | | | |
Convertible debt (1) | | — |
| | 1,311 |
| | 2,176 |
|
Stock options and unvested restricted stock | | 621 |
| | 630 |
| | 433 |
|
Diluted average shares outstanding | | 40,728 |
| | 42,228 |
| | 42,585 |
|
Net earnings as reported | | $ | 227,332 |
| | $ | 143,255 |
| | $ | 149,541 |
|
Interest attributable to convertible senior notes, net of income taxes | | — |
| | 941 |
| | 1,615 |
|
Net earnings for diluted earnings per share | | $ | 227,332 |
| | $ | 144,196 |
| | $ | 151,156 |
|
Basic earnings per share | | $ | 5.67 |
| | $ | 3.56 |
| | $ | 3.74 |
|
Diluted earnings per share (1) | | $ | 5.58 |
| | $ | 3.41 |
| | $ | 3.55 |
|
Antidilutive securities not included in the calculation of diluted earnings per share | | 8 |
| | 2 |
| | 4 |
|
| |
(1) | In accordance with ASC 260-10, Earnings Per Share, ("ASC 260-10") we calculate the dilutive effect of convertible securities using the "if-converted" method based on the number of days the Convertible Notes were outstanding during the period. All of the Convertible Notes were retired in 2017. |
NOTE 9 — ACQUISITIONS AND GOODWILL
Goodwill. We have previously entered new markets through the acquisition of the homebuilding assets and operations of other homebuilders. Our current goodwill is related to acquisitions of local/regional homebuilders in Georgia, South Carolina and Tennessee. The acquisitions were recorded in accordance with ASC 805, Business Combinations ("ASC 805") and ASC 820, using the acquisition method of accounting. The purchase price for the acquisitions were allocated based on estimated fair value of the assets and liabilities at the date of the acquisition. The combined excess purchase price over the fair value of the net assets of $33.0 million was recorded as goodwill, which is included in our consolidated balance sheet in Prepaids, other assets and goodwill. In accordance with ASC 350, we assess the recoverability of goodwill annually, or more frequently, if impairment triggers are present. Our analysis concluded that our goodwill balance was not impaired.
A summary of changes in the carrying amount of goodwill follows (in thousands): |
| | | | | | | | | | | | | | | | | | | | | | | |
| West | | Central | | East | | Financial Services | | Corporate | | Total |
Balance at January 1, 2017 | $ | — |
| | $ | — |
| | $ | 32,962 |
| | $ | — |
| | $ | — |
| | $ | 32,962 |
|
Additions | — |
| | — |
| | — |
| | — |
| | — |
| | — |
|
Balance at December 31, 2017 | — |
| | — |
| | 32,962 |
| | — |
| | — |
| | 32,962 |
|
Additions | — |
| | — |
| | — |
| | — |
| | — |
| | — |
|
Balance at December 31, 2018 | $ | — |
| | $ | — |
| | $ | 32,962 |
| | $ | — |
| | $ | — |
| | $ | 32,962 |
|
NOTE 10 — STOCK BASED AND DEFERRED COMPENSATION
We have two stock-based compensation plans, the Amended and Restated 2006 Stock Incentive Plan (the “2006 Plan”) and the Meritage Homes Corporation 2018 Stock Incentive Plan (the "2018 Plan"), collectively the "Stock Plans". The 2006 Plan was adopted in 2006 and has been amended or restated from time to time. The 2018 Plan was approved by our Board of Directors and our stockholders and adopted in May 2018. Both plans are administered by our Board of Directors and allow for the grant of stock appreciation rights, restricted stock awards, restricted stock units, performance share awards in addition to non-qualified and incentive stock options. The Stock Plans authorize awards to officers, key employees, non-employee directors and consultants. The 2006 Plan authorizes 5,350,000 shares of common stock to be awarded, of which 688,623 shares remain available for grant at December 31, 2018. Upon expiration of the 2006 Plan in May 2019, any available shares from expired, terminated or forfeited awards that remain under the 2006 Plan and prior plans will be available for grant under the 2018 Plan. The 2018 Plan authorizes 1,250,000 shares of stock to be awarded, of which 1,240,917 shares remain available at December 31, 2018. We believe that such awards provide a means of performance-based compensation to attract and retain qualified employees and better align the interests of our employees with those of our stockholders. Non-vested stock awards are usually granted with a five-year ratable vesting period for employees and with a three-year cliff vesting for both non-vested stock and performance-based awards granted to senior executive officers and non-employee directors.
Summary of Stock Option Activity:
We have not granted any stock options since 2009 and had no stock options outstanding as of December 31, 2018, 2017 and 2016. The total intrinsic value of option exercises for the year ended December 31, 2016 was $0.2 million. The intrinsic value of a stock option is the amount by which the market value of the underlying stock exceeds the exercise price of the stock option.
Summary of Nonvested (Restricted) Shares and Units Activity:
In addition to the stock options discussed above, we grant time-based and performance-based restricted shares or units. Performance-based restricted shares are only granted to executive officers. All performance shares only vest upon the attainment of certain financial and operational criteria as established and approved by our Board of Directors.
|
| | | | | | | | | | | | | | |
| | Nonvested Restricted Share Activity (time-based) | | Weighted Average Grant Date Fair Value | | Nonvested Restricted Share Activity (performance- based) | | Weighted Average Grant Date Fair Value |
Outstanding at January 1, 2016 | | 883,707 |
| | $ | 40.75 |
| | 180,770 |
| | $ | 42.93 |
|
Granted | | 499,865 |
| | 31.60 |
| | 66,698 |
| | 34.39 |
|
Vested (Earned/Released) | | (305,359 | ) | | 30.87 |
| | (41,665 | ) | | 31.02 |
|
Forfeited (1) | | (115,910 | ) | | 36.79 |
| | (20,835 | ) | | 42.56 |
|
Outstanding as of December 31, 2016 | | 962,303 |
| | 37.00 |
| | 184,968 |
| | 34.84 |
|
Granted | | 430,575 |
| | 34.45 |
| | 154,120 |
| | 34.10 |
|
Vested (Earned/Released) | | (279,856 | ) | | 38.39 |
| | (20,367 | ) | | 45.60 |
|
Forfeited (1) | | (130,370 | ) | | 35.09 |
| | (31,716 | ) | | 45.60 |
|
Outstanding at December 31, 2017 | | 982,652 |
| | 35.59 |
| | 287,005 |
| | 35.80 |
|
Granted | | 315,247 |
| | 46.07 |
| | 157,637 |
| | 45.20 |
|
Vested (Earned/Released) | | (288,709 | ) | | 37.93 |
| | (36,801 | ) | | 41.17 |
|
Forfeited (1) | | (85,900 | ) | | 37.53 |
| | (29,386 | ) | | 41.17 |
|
Outstanding at December 31, 2018 | | 923,290 |
| | $ | 38.25 |
| | 378,455 |
| | $ | 38.77 |
|
| |
(1) | Forfeitures on time-based nonvested shares are a result of terminations of employment, while forfeitures on performance-based nonvested shares are a result of failing to attain certain goals as outlined in our executive officers' compensation agreements. |
Compensation cost related to time-based restricted stock awards is measured as of the closing price on the date of grant and is expensed, less forfeitures, on a straight-line basis over the vesting period of the award. Compensation cost related to performance-based restricted stock awards is also measured as of the closing price on the date of grant but is expensed in accordance with ASC 718, which requires an assessment of probability of attainment of the performance target. As our performance targets are dependent on performance over a specified measurement period, once we determine that the performance target outcome is probable, the cumulative expense is recorded immediately with the remaining expense and recorded on a straight-line basis through the end of the award’s vesting period. A portion of the performance-based restricted stock awards granted contain market conditions as defined by ASC 718. The guidance in ASC 718 requires that compensation expense for stock awards with market conditions be expensed based on a derived grant date fair value and expensed over the service period. We engaged a third party to perform a valuation analysis on the awards containing market conditions and our associated expense with those awards is based on the derived fair value from that analysis and is being expensed straight line over the service period of the awards. Below is a summary of compensation expense and stock award activity (in thousands):
|
| | | | | | | | | | | | |
| | Years Ended December 31, |
| | 2018 | | 2017 | | 2016 |
Stock-based compensation expense | | $ | 17,170 |
| | $ | 12,056 |
| | $ | 13,741 |
|
Cash received by Company from stock option exercises | | $ | — |
| | $ | — |
| | $ | 232 |
|
The following table includes additional information regarding our Plan (dollars in thousands):
|
| | | | | | | | |
| | At December 31, |
| | 2018 | | 2017 |
Unrecognized stock-based compensation cost | | $ | 24,954 |
| | $ | 18,439 |
|
Weighted average years expense recognition period | | 2.24 |
| | 2.48 |
|
Total equity awards outstanding | | 1,301,745 |
| | 1,269,657 |
|
We also offer a non-qualified deferred compensation plan ("deferred compensation plan") to highly compensated employees in order to allow them additional pre-tax income deferrals above and beyond the limits that qualified plans, such as 401(k) plans, impose on highly compensated employees. We do not currently offer a contribution match on the deferred compensation plan. All contributions to the plan to date have been funded by the employees and, therefore, we have no associated expense related to the deferred compensation plan for the years ended December 31, 2018, 2017 and 2016, other than minor administrative costs.
NOTE 11 — INCOME TAXES
Components of income tax expense are as follows (in thousands):
|
| | | | | | | | | | | | |
| | Years Ended December 31, |
| | 2018 | | 2017 | | 2016 |
Current taxes: | | | | | | |
Federal | | $ | 37,926 |
| | $ | 76,988 |
| | $ | 55,547 |
|
State | | 9,162 |
| | 8,006 |
| | 7,075 |
|
| | 47,088 |
| | 84,994 |
| | 62,622 |
|
Deferred taxes: | | | | | | |
Federal | | 6,687 |
| | 18,916 |
| | 4,064 |
|
State | | 2,147 |
| | 354 |
| | 1,833 |
|
| | 8,834 |
| | 19,270 |
| | 5,897 |
|
Total | | $ | 55,922 |
| | $ | 104,264 |
| | $ | 68,519 |
|
Income taxes differ for the years ended December 31, 2018, 2017 and 2016, from the amounts computed using the expected federal statutory income tax rate of 21%, 35% and 35%, respectively, as a result of the following (in thousands):
|
| | | | | | | | | | | | |
| | Years Ended December 31, |
| | 2018 | | 2017 | | 2016 |
Expected taxes at current federal statutory income tax rate | | $ | 59,483 |
| | $ | 86,632 |
| | $ | 76,321 |
|
State income taxes, net of federal tax benefit | | 8,934 |
| | 5,434 |
| | 5,791 |
|
Tax Act revaluation of deferred tax balances | | (2,741 | ) | | 19,687 |
| | — |
|
Manufacturing deduction | | — |
| | (7,580 | ) | | (6,708 | ) |
Federal tax credits | | (10,330 | ) | | (484 | ) | | (7,229 | ) |
Non-deductible costs and other | | 576 |
| | 575 |
| | 344 |
|
Income tax expense | | $ | 55,922 |
| | $ | 104,264 |
| | $ | 68,519 |
|
The effective tax rate was 19.7%, 42.1%, and 31.4% for 2018, 2017 and 2016, respectively. The reduced rate in 2018 is due to lower corporate tax rates under tax reform, extension of the Internal Revenue Code §45L new energy efficient homes credit in early 2018 for homes closed in 2017, additional energy tax credits obtained by qualifying more homes in open prior tax years, and a favorable revaluation adjustment to our deferred tax assets in accordance with the SEC Staff Accounting Bulletin No. 118. The 2017 effective tax rate does not include the benefit of 2017 energy tax credits due to the legislation being passed in 2018, but does include additional energy tax credits obtained by qualifying more homes from prior open tax years. The 2017 effective tax rate was favorably impacted by the homebuilder manufacturing deduction which was eliminated in tax reform. The 2017 effective tax rate was unfavorably impacted by a revaluation adjustment to our deferred tax assets as a result of tax reform which was estimated at that time and revised in 2018 when our accounting for the income tax effects of tax reform was completed. The 2016 effective tax rate was favorably impacted by both the homebuilder manufacturing deduction and energy tax credits.
Deferred tax assets and liabilities are netted on our balance sheet by tax jurisdiction. Net overall tax assets for all jurisdictions are grouped and included as a separate asset. Net overall deferred tax liabilities for all jurisdictions are grouped and included in Accrued liabilities. At December 31, 2018, we have a net deferred tax asset of $26.5 million. We also have net deferred tax liabilities of $4.4 million. Deferred tax assets and liabilities are comprised of timing differences (in thousands) as follows:
|
| | | | | | | | |
| | At December 31, |
| | 2018 | | 2017 |
Deferred tax assets: | | | | |
Real estate | | $ | 11,053 |
| | $ | 14,648 |
|
Goodwill | | 862 |
| | 2,076 |
|
Warranty reserve | | 5,824 |
| | 5,499 |
|
Wages payable | | 4,908 |
| | 5,796 |
|
Equity-based compensation | | 5,153 |
| | 4,486 |
|
Accrued expenses | | 104 |
| | 141 |
|
Net operating loss carry-forwards | | 1,005 |
| | 1,813 |
|
Other | | 4,946 |
| | 4,982 |
|
Total deferred tax assets | | 33,855 |
| | 39,441 |
|
| | | | |
Deferred tax liabilities: | | | | |
Deferred revenue | | — |
| | 462 |
|
Prepaids | | 1,409 |
| | 759 |
|
Fixed assets | | 5,981 |
| | 3,058 |
|
Total deferred tax liabilities | | 7,390 |
| | 4,279 |
|
| | | | |
Deferred tax assets, net | | 26,465 |
| | 35,162 |
|
Other deferred tax liability - state franchise taxes | | 4,378 |
| | 4,240 |
|
| | | | |
Net deferred tax assets and liabilities | | $ | 22,087 |
| | $ | 30,922 |
|
At December 31, 2018 and December 31, 2017, we have no unrecognized tax benefits due to the lapse of the statute of limitations and completion of audits for prior years. We believe that our current income tax filing positions and deductions will be sustained on audit and do not anticipate any adjustments that will result in a material change. Our policy is to accrue interest and penalties on unrecognized tax benefits and include them in federal income tax expense.
We determine our deferred tax assets and liabilities in accordance with ASC 740, Income Taxes ("ASC 740"). We evaluate our deferred tax assets, including the benefit from net operating losses ("NOLs"), by jurisdiction to determine if a valuation allowance is required. Companies must assess whether a valuation allowance should be established based on the consideration of all available evidence using a “more likely than not” standard with significant weight being given to evidence that can be objectively verified. This assessment considers, among other matters, the nature, frequency and severity of cumulative losses, forecasts of future profitability, the length of statutory carryforward periods, experiences with operating losses and experiences of utilizing tax credit carryforwards and tax planning alternatives. We have no valuation allowance on our deferred tax assets and NOL carryovers at December 31, 2018.
On December 22, 2017, the President signed into law the Tax Act. Under ASC 740, the effects of new legislation are recognized in the period that includes the date of enactment. The estimated impact on 2017 was to reduce the value of our deferred tax asset by $19.7 million and has been reflected in our effective tax rate reconciliation. The disclosed impact was our most reasonable estimate at that time based on our understanding of the Tax Act as it applied to our business and changed as more information became available. At December 31, 2018, we have completed our accounting for the income tax effects of the Tax Act on our deferred tax assets. In accordance with SEC Staff Accounting Bulletin No. 118 and ASC 740, we have revised the valuation of our 2017 deferred tax assets for the impact of the Tax Act based on completion of our 2017 income tax returns during the fourth quarter of 2018. Accordingly, in 2018 we recorded a favorable revaluation adjustment of $2.7 million which was also reflected in our effective tax rate reconciliation.
Our future NOL and deferred tax asset realization depends on sufficient taxable income in the carryforward periods under existing tax laws. Federal NOL carryforwards may be used to offset future taxable income for 20 years. State NOL carryforwards may be used to offset future taxable income for a period of time ranging from 5 to 20 years, depending on the state jurisdiction. At December 31, 2018, we had no remaining un-utilized federal NOL carryforward or federal tax credits. At December 31, 2018, we had tax benefits for state NOL carryforwards of $1.0 million that begin to expire in 2028.
At December 31, 2018, we have a current tax receivable of $2.2 million, which primarily consists of current federal and state tax accruals, net of estimated tax payments and energy tax credits. This amount is recorded in Other Receivables in the accompanying balance sheet at December 31, 2018.
We conduct business and are subject to tax in the U.S. and several states. With few exceptions, we are no longer subject to U.S. federal, state, or local income tax examinations by taxing authorities for years prior to 2014. We have one state income tax examination covering various years pending resolution at this time.
The tax benefits from NOLs, built-in losses, and tax credits would be materially reduced or potentially eliminated if we experience an “ownership change” as defined under Internal Revenue Code (“IRC”) §382. Based on our analysis performed as of December 31, 2018 we do not believe that we have experienced an ownership change. As a protective measure, our stockholders held a Special Meeting of Stockholders on February 16, 2009 and approved an amendment to our Articles of Incorporation that restricts certain transfers of our common stock. The amendment is intended to help us avoid an unintended ownership change and thereby preserve the value of any tax benefit for future utilization.
NOTE 12 — SUPPLEMENTAL DISCLOSURE OF CASH FLOW INFORMATION
The following table presents certain supplemental cash flow information (in thousands):
|
| | | | | | | | | | | | |
| | Years Ended December 31, |
| | 2018 | | 2017 | | 2016 |
Cash paid during the year for: | | | | | | |
Interest, net of interest capitalized | | $ | 4,229 |
| | $ | 570 |
| | $ | 1,760 |
|
Income taxes | | $ | 56,350 |
| | $ | 85,814 |
| | $ | 65,020 |
|
Non-cash operating activities: | | | | | | |
Real estate not owned (decrease)/increase | | $ | — |
| | $ | 38,864 |
| | $ | — |
|
Real estate acquired through notes payable | | $ | 13,174 |
| | $ | 11,129 |
| | $ | 14,199 |
|
NOTE 13 — RELATED PARTY TRANSACTIONS
From time to time, in the normal course of business, we have transacted with related or affiliated companies and with certain of our officers and directors. We believe that the terms and fees negotiated for all transactions listed below are no less favorable than those that could be negotiated in arm’s length transactions.
We charter aircraft services from companies that use the private plane of Steven Hilton, our Chairman and CEO, although Mr. Hilton does not have an ownership interest in the companies. Payments made to these companies were approximately $606,000, $580,000 and $711,000 for the years ended December 31, 2018, 2017 and 2016, respectively.
NOTE 14 — OPERATING AND REPORTING SEGMENTS
We operate with two principal business segments: homebuilding and financial services. As defined in ASC 280-10, Segment Reporting, we have nine homebuilding operating segments. The homebuilding segments are engaged in the business of acquiring and developing land, constructing homes, marketing and selling those homes and providing warranty and customer services. We aggregate our homebuilding operating segments into reporting segments based on similar long-term economic characteristics and geographical proximity. Our current reportable homebuilding segments are as follows:
West: Arizona, California and Colorado
Central: Texas
East: Florida, Georgia, North Carolina, South Carolina and Tennessee
Management’s evaluation of segment performance is based on segment operating income, which we define as homebuilding and land revenues less cost of home construction, commissions and other sales costs, land development and other land sales costs and other costs incurred by or allocated to each segment, including impairments. Each reportable segment follows the same accounting policies described in Note 1, “Business and Summary of Significant Accounting Policies.” Operating results for each segment may not be indicative of the results for such segment had it been an independent, stand-alone entity for the periods presented. The following segment information is in thousands:
|
| | | | | | | | | | | | |
| | Years Ended December 31, |
| | 2018 | | 2017 | | 2016 |
Homebuilding revenue (1): | | | | | | |
West | | $ | 1,436,334 |
| | $ | 1,437,860 |
| | $ | 1,300,906 |
|
Central | | 1,013,878 |
| | 904,908 |
| | 787,849 |
|
East | | 1,063,207 |
| | 884,004 |
| | 940,472 |
|
Consolidated total | | 3,513,419 |
| | 3,226,772 |
| | 3,029,227 |
|
Homebuilding segment operating income: | | | | | | |
West | | 134,852 |
| | 129,781 |
| | 103,801 |
|
Central | | 92,925 |
| | 92,451 |
| | 74,253 |
|
East | | 59,522 |
| | 32,089 |
| | 48,126 |
|
Total homebuilding segment operating income | | 287,299 |
| | 254,321 |
| | 226,180 |
|
Financial services segment profit | | 24,044 |
| | 22,055 |
| | 21,902 |
|
Corporate and unallocated costs (2) | | (38,521 | ) | | (33,510 | ) | | (33,863 | ) |
Earnings from other unconsolidated entities, net | | 601 |
| | 2,101 |
| | 4,060 |
|
Interest expense | | (785 | ) | | (3,853 | ) | | (5,172 | ) |
Other income, net (3) | | 10,616 |
| | 6,405 |
| | 4,953 |
|
Net earnings before income taxes | | $ | 283,254 |
| | $ | 247,519 |
| | $ | 218,060 |
|
| |
(1) | Homebuilding revenue includes the following land closing revenue, by segment: |
|
| | | | | | | | | | | | |
| | Years Ended December 31, |
Land closing revenue: | | 2018 | | 2017 | | 2016 |
West | | $ | 18,508 |
| | $ | 18,116 |
| | $ | 15,608 |
|
Central | | 7,657 |
| | 622 |
| | 8,885 |
|
East | | 12,542 |
| | 21,259 |
| | 1,308 |
|
Total | | $ | 38,707 |
| | $ | 39,997 |
| | $ | 25,801 |
|
| |
(2) | Balance consists primarily of corporate costs and numerous shared service functions such as finance and treasury that are not allocated to the homebuilding or financial reporting segments. |
| |
(3) | For the year ended December 31, 2018, Other income, net includes a favorable $4.8 million legal settlement from long-standing litigation related to a previous joint venture in Nevada. |
|
| | | | | | | | | | | | | | | | | | | | | | | |
| At December 31, 2018 |
| West | | Central | | East | | Financial Services | | Corporate and Unallocated | | Total |
Deposits on real estate under option or contract | $ | 7,514 |
| | $ | 13,870 |
| | $ | 30,026 |
| | $ | — |
| | $ | — |
| | $ | 51,410 |
|
Real estate | 1,188,975 |
| | 679,422 |
| | 874,224 |
| | — |
| | — |
| | 2,742,621 |
|
Investments in unconsolidated entities | 8,320 |
| | 6,396 |
| | — |
| | — |
| | 2,764 |
| | 17,480 |
|
Other assets | 51,115 |
| (1) | 117,150 |
| (2) | 85,869 |
| (3) | 1,013 |
| | 298,821 |
| (4) | 553,968 |
|
Total assets | $ | 1,255,924 |
| | $ | 816,838 |
| | $ | 990,119 |
| | $ | 1,013 |
| | $ | 301,585 |
| | $ | 3,365,479 |
|
| |
(1) | Balance consists primarily of cash and property and equipment. |
| |
(2) | Balance consists primarily of development reimbursements from local municipalities and cash. |
| |
(3) | Balance consists primarily of goodwill, cash and property and equipment. |
| |
(4) | Balance consists primarily of cash. |
|
| | | | | | | | | | | | | | | | | | | | | | | | | | | | |
| | | | | | | | | | | | |
| | At December 31, 2017 |
| | West | | Central | | East | | Financial Services | | Corporate and Unallocated | | Total |
Deposits on real estate under option or contract | | $ | 15,557 |
| | $ | 21,309 |
| | $ | 23,079 |
| | $ | — |
| | $ | — |
| | $ | 59,945 |
|
Real estate | | 1,174,285 |
| | 700,460 |
| | 856,635 |
| | — |
| | — |
| | 2,731,380 |
|
Investments in unconsolidated entities | | 7,833 |
| | 6,999 |
| | — |
| | — |
| | 2,236 |
| | 17,068 |
|
Other assets | | 58,470 |
| (1 | ) | 110,173 |
| (2 | ) | 144,681 |
| (3 | ) | 1,249 |
| | 128,292 |
| (4 | ) | 442,865 |
|
Total assets | | $ | 1,256,145 |
| | $ | 838,941 |
| | $ | 1,024,395 |
| | $ | 1,249 |
| | $ | 130,528 |
| | $ | 3,251,258 |
|
| |
(1) | Balance consists primarily of cash and property and equipment. |
| |
(2) | Balance consists primarily of development reimbursements from local municipalities and cash. |
| |
(3) | Balance consists primarily of real estate not owned, cash and goodwill (see Note 9). |
| |
(4) | Balance consists primarily of cash and our deferred tax asset. |
NOTE 15 — COMMITMENTS AND CONTINGENCIES
We are involved in various routine legal and regulatory proceedings, including, without limitation, claims and litigation alleging construction defects. In general, the proceedings are incidental to our business, and most exposure is subject to and should be covered by warranty and indemnity obligations of our consultants and subcontractors. Additionally, some such claims are also covered by insurance. With respect to the majority of pending litigation matters, our ultimate legal and financial responsibility, if any, cannot be estimated with certainty and, in most cases, any potential losses related to these matters are not considered probable. Historically, most disputes regarding warranty claims are resolved prior to litigation. We believe there are not any pending legal or warranty matters that could have a material adverse impact upon our consolidated financial condition, results of operations or cash flows that have not been sufficiently reserved.
As discussed in Note 1 under the heading “Warranty Reserves”, we have case specific reserves within our $24.6 million of total warranty reserves related to a foundation design matter affecting a single community in Texas. In addition to the repairs required to be made to homes within that community, we have been named as a defendant in several lawsuits filed by homeowners in that community. As of December 31, 2018, the claim we made for this matter under our general liability insurance policies has initially been denied, which we vehemently disagree with and have disputed with our insurance carrier. We regularly review our reserves, and adjust them, as necessary to reflect changes as more information becomes available. As of December 31, 2018, taking into account sources of potential recovery from the consultant and contractors involved with the design and construction of these homes and their insurers as well as from our general liability insurer, we believe our reserves are sufficient to cover repairs and related claims.
Also included within our case specific reserves and as discussed in Note 1 under the heading “Warranty Reserves” are reserves for alleged stucco defects in homes in certain Florida communities we developed prior to 2016. We are involved in legal proceedings relating to such stucco defects. Our review of these stucco related matters is ongoing and our estimate of and reserve for future costs of repairs is based on our judgment, various assumptions and internal data. Due to the degree of judgment and the potential for variability in our underlying assumptions and data, as we obtain additional information, we may revise our estimate and thus our related reserves. As of December 31, 2018, after considering potential recovery under our general liability insurance policies and potential recoveries from the contractors involved and their insurers, we believe our reserves are sufficient to cover the existing stucco related repairs and claims.
Lease Agreements
We lease office facilities, model homes and equipment under various operating lease agreements. Approximate future minimum lease payments for non-cancellable operating leases as of December 31, 2018, are as follows (in thousands):
|
| | | |
Years Ended December 31, | |
2019 | $ | 8,168 |
|
2020 | 8,083 |
|
2021 | 6,922 |
|
2022 | 6,286 |
|
2023 | 5,341 |
|
Thereafter | 5,418 |
|
| $ | 40,218 |
|
Rent expense was $10.3 million, $9.7 million and $7.8 million in 2018, 2017 and 2016, respectively, and is included within General and administrative expense or in Commissions and other sales costs on our consolidated income statements. Sublease income was $0.6 million, $0.7 million and $0.6 million in 2018, 2017 and 2016, respectively, and is included within Other income, net on our consolidated income statements.
See Note 1 for information related to our warranty obligations.
NOTE 16 — SELECTED QUARTERLY FINANCIAL DATA (UNAUDITED)
Quarterly results for the years ended December 31, 2018 and 2017 follow (in thousands, except per share amounts):
|
| | | | | | | | | | | | | | | | |
| | First | | Second | | Third | | Fourth |
2018 | | | | | | | | |
Total closing revenue | | $ | 742,564 |
| | $ | 877,495 |
| | $ | 884,581 |
| | $ | 1,008,779 |
|
Total closing gross profit | | $ | 123,120 |
| | $ | 158,828 |
| | $ | 158,517 |
| | $ | 188,688 |
|
Earnings before income taxes | | $ | 48,884 |
| | $ | 71,185 |
| | $ | 71,409 |
| | $ | 91,776 |
|
Net earnings | | $ | 43,874 |
| | $ | 53,838 |
| | $ | 54,135 |
| | $ | 75,485 |
|
Per Share Data: | | | | | | | | |
Basic earnings per share (1) | | $ | 1.08 |
| | $ | 1.32 |
| | $ | 1.34 |
| | $ | 1.93 |
|
Diluted earnings per share (1) | | $ | 1.07 |
| | $ | 1.31 |
| | $ | 1.33 |
| | $ | 1.91 |
|
2017 | | | | | | | | |
Total closing revenue | | $ | 672,772 |
| | $ | 801,978 |
| | $ | 805,597 |
| | $ | 946,425 |
|
Total closing gross profit | | $ | 109,763 |
| | $ | 140,910 |
| | $ | 144,601 |
| | $ | 171,225 |
|
Earnings before income taxes | | $ | 36,769 |
| | $ | 63,205 |
| | $ | 63,455 |
| | $ | 84,090 |
|
Net earnings | | $ | 23,572 |
| | $ | 41,580 |
| | $ | 42,550 |
| | $ | 35,553 |
|
Per Share Data: | | | | | | | | |
Basic earnings per share (1) | | $ | 0.59 |
| | $ | 1.03 |
| | $ | 1.06 |
| | $ | 0.88 |
|
Diluted earnings per share (1) | | $ | 0.56 |
| | $ | 0.98 |
| | $ | 1.02 |
| | $ | 0.87 |
|
| |
(1) | Due to the computation of earnings per share, the sum of the quarterly amounts may not equal the full-year results. |
We typically experience seasonal variability in our quarterly operating results and capital requirements. Historically, we sell more homes in the first half of the year, which results in more working capital requirements and home closings in the third and fourth quarters. However, during economic downturns or times of certain government incentives, our results may not follow our historical trends.
NOTE 17 — SUBSEQUENT EVENTS
Issuer Purchases of Equity Securities
On February 13, 2019, our Board of Directors authorized a new share repurchase program in the amount of $100.0 million.
Under the Company's newly authorized program, repurchases of the Company’s shares may be made in the open market, in privately negotiated transactions, or otherwise. The timing and amount of repurchases, if any, will be determined by the
Company’s management at its discretion and be based on a variety of factors such as the market price of the Company’s common stock, corporate and contractual requirements, prevailing market and economic conditions and legal requirements. The share repurchase program may be modified, suspended or discontinued at any time.
|
| |
Item 9. | Changes in and Disagreements With Accountants on Accounting and Financial Disclosure |
None
|
| |
Item 9A. | Controls and Procedures |
In order to ensure that the information we must disclose in our filings with the SEC is recorded, processed, summarized and reported on a timely basis, we have developed and implemented disclosure controls and procedures. Our management, with the participation of our chief executive officer and chief financial officer, has reviewed and evaluated the effectiveness of our disclosure controls and procedures, as defined in Securities Exchange Act Rules 13a-15(e) and 15d-15(e), as of the end of the period covered by this Form 10-K (the “Evaluation Date”). Based on such evaluation, management has concluded that, as of the Evaluation Date, our disclosure controls and procedures were effective at a reasonable assurance level in ensuring that information that is required to be disclosed in the reports we file or submit under the Securities Exchange Act of 1934 (the “Exchange Act”) is recorded, processed, summarized and reported within the time periods specified in the SEC’s rules and forms, and that information required to be disclosed in our reports filed or submitted under the Exchange Act is accumulated and communicated to our management, including our CEO and CFO, as appropriate to allow timely decisions regarding required disclosures.
There was no change in our internal control over financial reporting (as defined in Rules 13a-15(f) and 15d-15(f) under the Exchange Act) identified in connection with the foregoing evaluation that occurred during our fiscal quarter ended December 31, 2018 that has materially affected, or is reasonably likely to materially affect, our internal control over financial reporting.
Management’s Annual Report on Internal Control over Financial Reporting
Our management is responsible for establishing and maintaining adequate internal control over financial reporting, as such term is defined in Exchange Act Rule 13a-15(f). Internal control over financial reporting is a process to provide reasonable assurance regarding the reliability of our financial reporting and the preparation of financial statements for external purposes in accordance with accounting principles generally accepted in the United States. Because of its inherent limitations, internal control over financial reporting is not intended to provide absolute assurance that a misstatement of our financial statements would be prevented or detected. Also, projections of any evaluation of internal control effectiveness to future periods are subject to the risk that controls may become inadequate because of changes in conditions, or that the degree of compliance with internal control policies or procedures may deteriorate. Under the supervision and with the participation of our management, including our CEO and CFO, we conducted an evaluation of the effectiveness of our internal control over financial reporting based on the framework in Internal Control—Integrated Framework (2013) issued by the Committee of Sponsoring Organizations of the Treadway Commission. Based on this evaluation, our management concluded that our internal control over financial reporting was effective as of December 31, 2018. The effectiveness of our internal control over financial reporting as of December 31, 2018 has been audited by Deloitte & Touche LLP, an independent registered accounting firm, as stated in their attestation report, which is included herein.
REPORT OF INDEPENDENT REGISTERED PUBLIC ACCOUNTING FIRM
To the stockholders and the Board of Directors of Meritage Homes Corporation
Opinion on Internal Control over Financial Reporting
We have audited the internal control over financial reporting of Meritage Homes Corporation and subsidiaries (the “Company”) as of December 31, 2018, based on criteria established in Internal Control - Integrated Framework (2013) issued by the Committee of Sponsoring Organizations of the Treadway Commission (COSO). In our opinion, the Company maintained, in all material respects, effective internal control over financial reporting as of December 31, 2018, based on criteria established in Internal Control - Integrated Framework (2013) issued by COSO.
We have also audited, in accordance with the standards of the Public Company Accounting Oversight Board (United States) (PCAOB), the consolidated financial statements as of and for the year ended December 31, 2018, of the Company and our report dated February 15, 2019, expressed an unqualified opinion on those financial statements.
Basis for Opinion
The Company’s management is responsible for maintaining effective internal control over financial reporting and for its assessment of the effectiveness of internal control over financial reporting, included in the accompanying Management’s Annual Report on Internal Control over Financial Reporting. Our responsibility is to express an opinion on the Company’s internal control over financial reporting based on our audit. We are a public accounting firm registered with the PCAOB and are required to be independent with respect to the Company in accordance with the U.S. federal securities laws and the applicable rules and regulations of the Securities and Exchange Commission and the PCAOB.
We conducted our audit in accordance with the standards of the PCAOB. Those standards require that we plan and perform the audit to obtain reasonable assurance about whether effective internal control over financial reporting was maintained in all material respects. Our audit included obtaining an understanding of internal control over financial reporting, assessing the risk that a material weakness exists, testing and evaluating the design and operating effectiveness of internal control based on the assessed risk, and performing such other procedures as we considered necessary in the circumstances. We believe that our audit provides a reasonable basis for our opinion.
Definition and Limitations of Internal Control over Financial Reporting
A company’s internal control over financial reporting is a process designed to provide reasonable assurance regarding the reliability of financial reporting and the preparation of financial statements for external purposes in accordance with generally accepted accounting principles. A company’s internal control over financial reporting includes those policies and procedures that (1) pertain to the maintenance of records that, in reasonable detail, accurately and fairly reflect the transactions and dispositions of the assets of the company; (2) provide reasonable assurance that transactions are recorded as necessary to permit preparation of financial statements in accordance with generally accepted accounting principles, and that receipts and expenditures of the company are being made only in accordance with authorizations of management and directors of the company; and (3) provide reasonable assurance regarding prevention or timely detection of unauthorized acquisition, use, or disposition of the company’s assets that could have a material effect on the financial statements.
Because of its inherent limitations, internal control over financial reporting may not prevent or detect misstatements. Also, projections of any evaluation of effectiveness to future periods are subject to the risk that controls may become inadequate because of changes in conditions, or that the degree of compliance with the policies or procedures may deteriorate.
/s/ DELOITTE & TOUCHE LLP
Phoenix, Arizona
February 15, 2019
|
| |
Item 9B. | Other Information |
None
PART III
|
| |
Item 10. | Directors, Executive Officers and Corporate Governance |
Except as set forth herein, information required in response to this item is incorporated by reference from the information contained in our 2019 Proxy Statement (which will be filed with the Securities and Exchange Commission no later than 120 days following the Company’s fiscal year end (the "2019 Proxy Statement")). The information required by Item 10 regarding our executive officers appears in Part I, Item 1 of this Annual Report as permitted by General Instruction G(3).
|
| |
Item 11. | Executive Compensation |
Information required in response to this item is incorporated by reference to our 2019 Proxy Statement.
|
| |
Item 12. | Security Ownership of Certain Beneficial Owners and Management and Related Stockholder Matters |
Information required in response to this item is incorporated by reference to our 2019 Proxy Statement.
|
| |
Item 13. | Certain Relationships and Related Transactions, and Director Independence |
Information required in response to this item is incorporated by reference to our 2019 Proxy Statement.
|
| |
Item 14. | Principal Accountant Fees and Services |
Information required in response to this item is incorporated by reference to our 2019 Proxy Statement.
PART IV
|
| |
Item 15. | Exhibits and Financial Statement Schedules |
| |
(a) | Financial Statements and Schedules |
(i) Financial Statements:
The consolidated financial statements are included under Part II, Item 8 in this Annual Report on Form 10-K.
(ii) Financial Statement Schedules:
Schedules have been omitted because of the absence of conditions under which they are required or because the required information is included in the consolidated financial statements or notes thereto.
|
| | | |
Exhibit Number | Description | Page or Method of Filing |
2.1 |
| Agreement and Plan of Reorganization, dated as of September 13, 1996, by and among Homeplex, the Monterey Merging Companies and the Monterey Stockholders P | Incorporated by reference to Appendix A of Form S-4 Registration Statement No. 333-15937. |
| | |
3.1 |
| | Incorporated by reference to Exhibit 3 of Form 8-K dated June 20, 2002. |
| | |
3.1.1 |
| | Incorporated by reference to Exhibit 3.1 of Form 8-K dated September 15, 2004. |
| | |
3.1.2 |
| | Incorporated by reference to Appendix A of the Proxy Statement for the 2006 Annual Meeting of Stockholders. |
| | |
3.1.3 |
| | Incorporated by reference to Appendix B of Proxy Statement for the 2008 Annual Meeting of Stockholders. |
| | |
3.1.4 |
| | Incorporated by reference to Appendix A of the Definitive Proxy Statement filed with the Securities and Exchange Commission on January 9, 2009. |
| | |
3.2 |
| | Incorporated by reference to Exhibit 3.1 of Form 8-K dated May 10, 2017. |
| | |
4.1 |
| | Incorporated by reference to Exhibit 4.1 of Form 10-K for the year ended December 31, 2007. |
| | |
4.2 |
| | Incorporated by reference to Exhibit 4.1 of Form 8-K dated April 13, 2010 |
| | |
4.2.1 |
| | Incorporated by reference to Exhibit 4.2 of Form 10-Q for the quarter ended March 31, 2011). |
| | |
4.2.2 |
| | Incorporated by reference to Exhibit 4.4.2 of Form 10-K for the year ended December 31, 2011. |
| | |
4.2.3 |
| | Incorporated by reference to Exhibit 4.5 of Form 10-Q for the quarterly period ended March 31, 2012 |
| | |
4.2.4 |
| | Incorporated by reference to Exhibit 4.1 of Form 8-K filed on October 1, 2012 |
| | |
4.2.5 |
| | Incorporated by reference to Exhibit 4.3.4 of Form S-4 Registration Statement No. 333-187457 |
| | |
4.2.6 |
| | Incorporated by reference to Exhibit 4.4 of Form 10-Q for the quarter ended September 30, 2013 |
|
| | | |
Exhibit Number | Description | Page or Method of Filing |
4.2.7 |
| | Incorporated by reference to Exhibit 4.2.7 of Form S-4 Registration Statement No. 333-192730 |
| | |
4.2.8 |
| | Incorporated by reference to Exhibit 4.3 of Form 10-Q for the quarter ended June 30, 2014 |
| | |
4.2.9 |
| | Incorporated by reference to Exhibit 4.4 of Form 10-Q for the quarter ended June 30, 2014 |
| | |
4.2.10 |
| | Incorporated by reference to Exhibit 4.2.10 of Form 10-K for the year ended December 31, 2014 |
| | |
4.3 |
| | Incorporated by reference to Exhibit 4.1 of Form 8-K dated April 10, 2012 |
| | |
4.3.1 |
| | Incorporated by reference to Exhibit 4.4.1 of Form S-4 Registration Statement No. 333-187457 |
| | |
4.3.2 |
| | Incorporated by reference to Exhibit 4.2 of Form 10-Q for the quarter ended September 30, 2013 |
| | |
4.3.3 |
| | Incorporated by reference to Exhibit 4.5 of Form 10-Q for the quarter ended June 30, 2014 |
| | |
4.3.4 |
| | Incorporated by reference to Exhibit 4.6 of Form 10-Q for the quarter ended June 30, 2014 |
| | |
4.3.5 |
| | Incorporated by reference to Exhibit 4.3.5 of Form 10-K for the year ended December 31, 2014 |
| | |
4.5 |
| | Incorporated by reference to Exhibit 4.1 of Form 8-K dated June 2, 2015 |
| | |
4.6 |
| | Incorporated by reference to Exhibit 4.1 of Form 8-K dated June 6, 2017 |
| | |
10.1 |
| | Incorporated by reference to Appendix B of the Proxy Statement for the 2014 Annual Meeting of Stockholders |
| | |
10.2 |
| | Incorporated by reference to Appendix A of the Proxy Statement for the 2014 Annual Meeting of Stockholders |
| | |
10.2.1 |
| | Incorporated by reference to Appendix of the Proxy Statement for the 2016 Annual Meeting of Stockholders |
| | |
10.2.2 |
| | Incorporated by reference to Exhibit 4.9 of Form S-8 Registration Statement No. 333-166991 |
| | |
10.2.3 |
| | Incorporated by reference to Exhibit 4.9.1 of Form S-8 Registration Statement No. 333-166991 |
| | |
10.2.4 |
| | Incorporated by reference to Exhibit 4.9.2 of Form S-8 Registration Statement No. 333-166991 |
| | |
|
| | | |
Exhibit Number | Description | Page or Method of Filing |
10.2.5 |
| | Incorporated by reference to Exhibit 4.10 of Form S-8 Registration Statement No. 333-166991 |
| | |
10.2.6 |
| | Incorporated by reference to Exhibit 4.4 of Form S-8 Registration Statement No. 333-134637 |
| | |
10.2.7 |
| | Incorporated by reference to Exhibit 4.5 of Form S-8 Registration Statement No. 333-134637 |
| | |
10.2.8 |
| | Incorporated by reference to Exhibit 10.9 of Form 8-K dated March 28, 2014 |
| | |
10.2.9 |
| | Incorporated by reference to Exhibit 10.10 of Form 8-K dated March 28, 2014 |
| | |
10.3 |
| | Incorporated by reference to Exhibit 10.1 of Form 8-K dated February 14, 2017 |
| | |
10.3.1 |
| | Incorporated by reference to Exhibit 10.5 of Form 8-K dated January 19, 2010. |
| | |
10.3.2 |
| | Incorporated by reference to Exhibit 10.5 of Form 8-K dated March 28, 2014 |
| | |
10.4 |
| | Incorporated by reference to Exhibit 10.2 of Form 8-K dated February 14, 2017 |
| | |
10.4.1 |
| | Incorporated by reference to Exhibit 10.7 of Form 8-K dated January 19, 2010 |
| | |
10.4.2 |
| | Incorporated by reference to Exhibit 10.7 of Form 8-K dated March 28, 2014 |
| | |
10.5 |
| | Incorporated by reference to Exhibit 10.3 of Form 8-K dated February 14, 2017 |
| | |
10.5.1 |
| | Incorporated by reference to Exhibit 10.1 of Form 8-K dated May 15, 2017 |
| | |
10.6 |
| | Incorporated by reference to Exhibit 10.4 of Form 8-K dated February 14, 2017 |
| | |
10.7 |
| | Incorporated by reference to Exhibit 10.5 of Form 8-K dated February 14, 2017 |
| | |
10.8 |
| | Incorporated by reference to Exhibit 10.1 of Form 8-K dated June 6, 2013 |
| | |
10.9 |
| | Incorporation by reference to Exhibit 10.6 of Form 8-K dated February 14, 2017 |
| | |
10.10 |
| | Incorporated by reference to Exhibit 10.1 of Form 8-K dated June 13, 2014 |
| | |
10.10.1 |
| | Incorporated by reference to Exhibit 10.1 of Form 8-K dated July 9, 2015 |
| | |
10.10.2 |
| | Incorporation by reference to Exhibit 10.1 of Form 8-K dated June 29, 2016 |
| | |
10.10.3 |
| | Incorporated by reference to Exhibit 10.1 of Form 8-K dated May 31, 2017 |
| | |
10.10.4 |
| | Incorporated by reference to Exhibit 10.1 to Form 8-K dated June 29, 2018 |
|
| | | |
Exhibit Number | Description | Page or Method of Filing |
10.11 |
| | Incorporated by reference to Exhibit 10.1 to Form 8-K dated March 26, 2018 |
| | |
10.12 |
| | Incorporated by reference to Exhibit 10.2 to Form 8-K dated March 26, 2018 |
| | |
10.13 |
| | Incorporated by reference to Exhibit 10.3 to Form 8-K dated March 26, 2018 |
| | |
10.14 |
| | Incorporated by reference to Exhibit 10.4 to Form 8-K dated March 26, 2018 |
| | |
10.15 |
| | Incorporated by reference to Exhibit 10.5 to Form 8-K dated March 26, 2018 |
| | |
10.16 |
| | Incorporated by reference to Appendix A of the Proxy Statement for the 2018 Annual Meeting of Stockholders |
| | |
21 |
| | Filed herewith. |
| | |
23.1 |
| | Filed herewith. |
| | |
24 |
| | See Signature Page. |
| | |
31.1 |
| | Filed herewith. |
| | |
31.2 |
| | Filed herewith. |
| | |
32.1 |
| | Filed herewith. |
| | |
101 |
| The following financial statements from Meritage Homes Corporation Annual Report on Form 10-K for the year ended December 31, 2018, filed on February 19, 2019, formatted in XBRL (Extensible Business Reporting Language); (i) Consolidated Balance Sheets, (ii) Consolidated Income Statements, (iii) Consolidated Statements of Cash Flows, (iv) Consolidated Statements of Stockholders’ Equity and (v) the Notes to Consolidated Financial Statements. |
|
| |
* | Indicates a management contract or compensation plan. |
|
| |
Item 16. | Form 10-K Summary |
Not applicable.
SIGNATURES
Pursuant to the requirements of Section 13 or 15(d) of the Securities Exchange Act of 1934, the registrant has duly caused this report to be signed on its behalf by the undersigned, thereunto duly authorized, this 15th day of February 2019.
|
| | | |
| | | |
| | MERITAGE HOMES CORPORATION, a Maryland Corporation |
| |
| | By | /s/ STEVEN J. HILTON |
| | | Steven J. Hilton Chairman and Chief Executive Officer |
| | | |
| | By | /s/ HILLA SFERRUZZA |
| | | Hilla Sferruzza Executive Vice President and Chief Financial Officer |
KNOW ALL MEN BY THESE PRESENTS, that each person whose signature appears below constitutes and appoints Steven J. Hilton, C. Timothy White and Hilla Sferruzza, and each of them, his or her true and lawful attorneys-in-fact and agents, with full power of substitution and resubstitution, for him or her and in his or her name, place and stead, in any and all capacities, to sign any and all amendments to this Annual Report on Form 10-K, and to file the same, with all exhibits thereto and other documents in connection therewith the Securities and Exchange Commission, granting unto said attorneys-in-fact and agents, and each of them, full power and authority to do and perform each and every act and thing requisite and necessary to be done in and about the premises, as fully and to all intents and purposes as he or she might or could do in person hereby ratifying and confirming all that said attorneys-in-fact and agents, or his or her substitute or substitutes, may lawfully do or cause to be done by virtue hereof.
Pursuant to the requirements of the Securities Exchange Act of 1934, this report has been signed below by the following persons on behalf of the registrant and in the capacities and on the dates indicated:
|
| | | | |
| | | | |
Signature | | Title | | Date |
| | |
/s/ STEVEN J. HILTON | | Chairman and Chief Executive Officer | | February 15, 2019 |
Steven J. Hilton | | | |
| | |
/s/ HILLA SFERRUZZA | | Executive Vice President, Chief Financial Officer (Principal Financial Officer and Principal Accounting Officer)
| | February 15, 2019 |
Hilla Sferruzza | | |
| | |
/s/ PETER L. AX | | Director | | February 15, 2019 |
Peter L. Ax | | | |
| | |
/s/ RAYMOND OPPEL | | Director | | February 15, 2019 |
Raymond Oppel | | | |
| | |
/s/ ROBERT G. SARVER | | Director | | February 15, 2019 |
Robert G. Sarver | | | |
| | |
/s/ RICHARD T. BURKE, SR. | | Director | | February 15, 2019 |
Richard T. Burke, Sr. | | | |
| | |
/s/ GERALD W. HADDOCK | | Director | | February 15, 2019 |
Gerald W. Haddock | | | |
| | |
/s/ DANA BRADFORD | | Director | | February 15, 2019 |
Dana Bradford | | | |
| | |
/s/ MICHAEL R. ODELL | | Director | | February 15, 2019 |
Michael R. Odell | | | |
| | | | |
/s/ DEB HENRETTA | | Director | | February 15, 2019 |
Deb Henretta | | | |